Session Standard Deviation Date Range Analyzer MT4
- Göstergeler
-
Tien Long Tu
 Developing indicators since 2023, I consider myself an adept indicator developer from Vietnam. Since embarking on this journey, I have dedicated myself to mastering the intricacies of market analysis and indicator development. My work is driven by a deep curiosity and a commitment to creating tools
 - Sürüm: 1.0
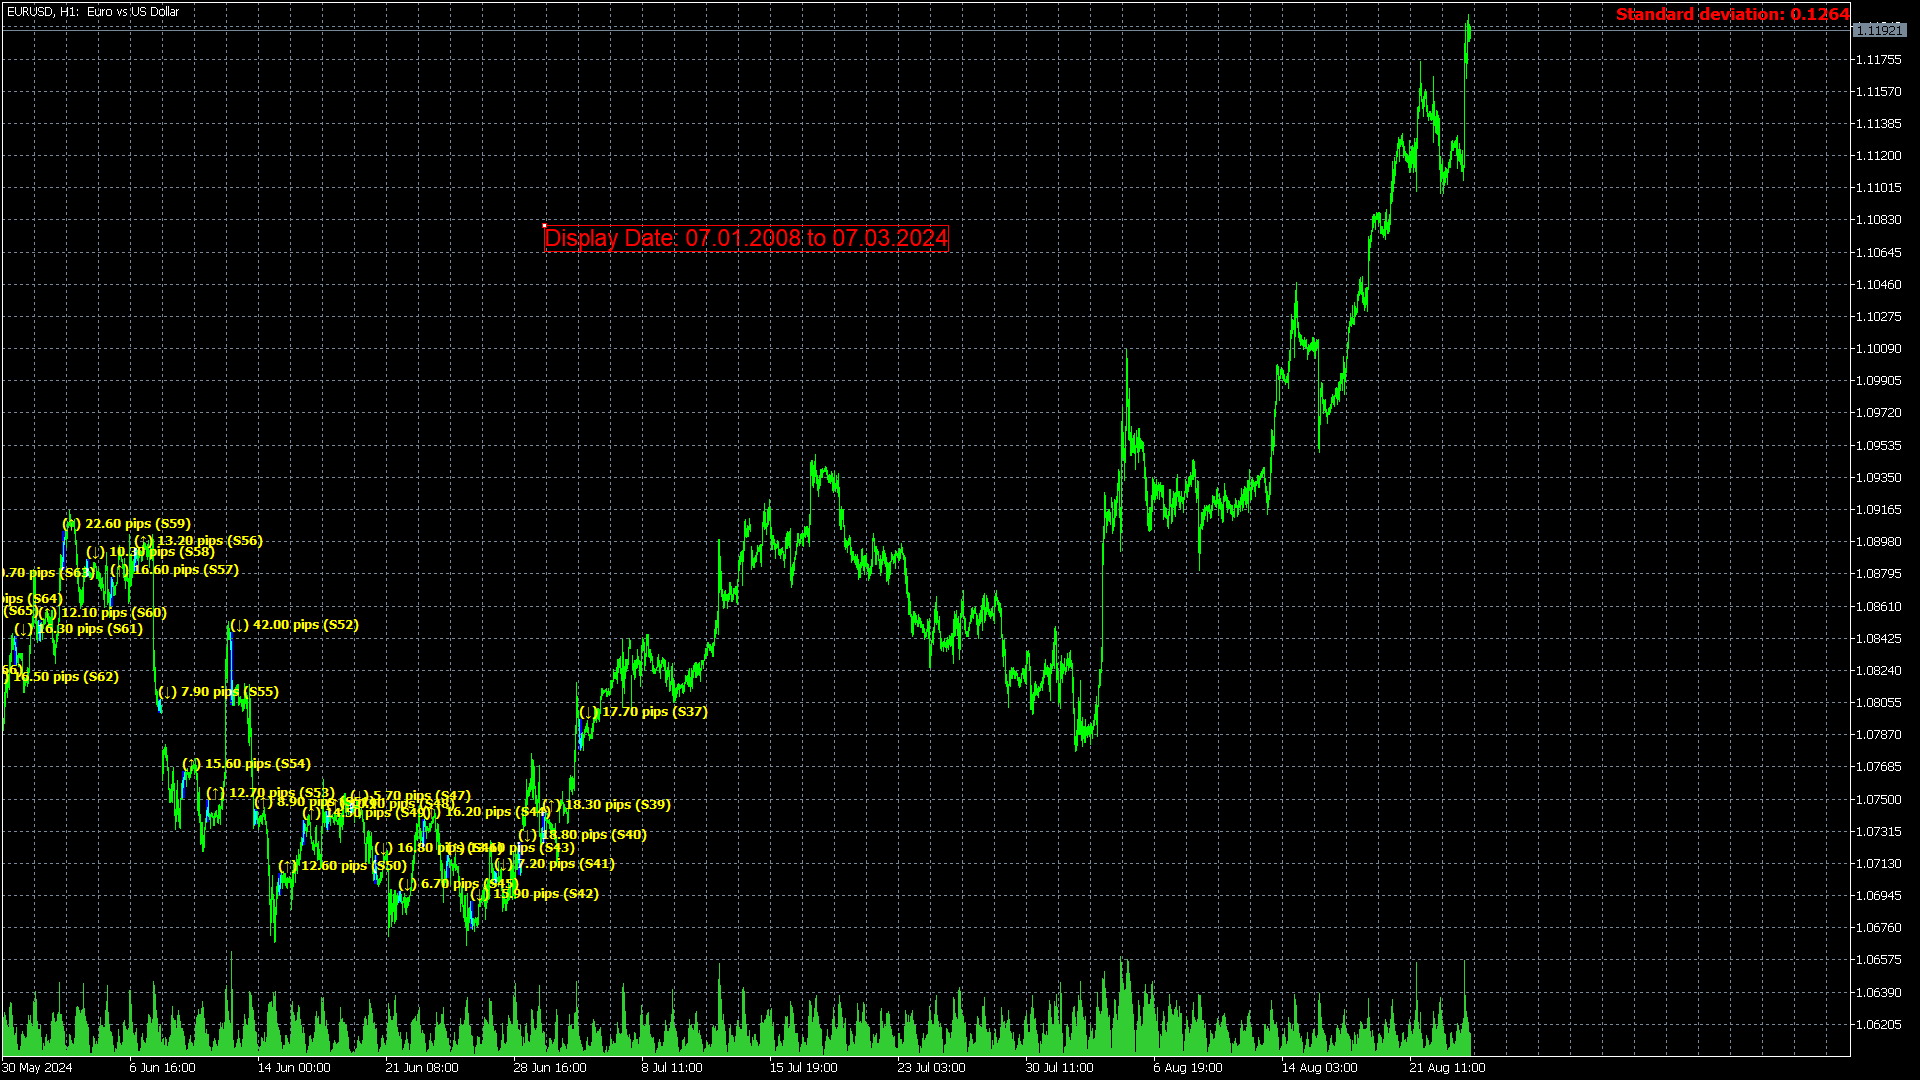
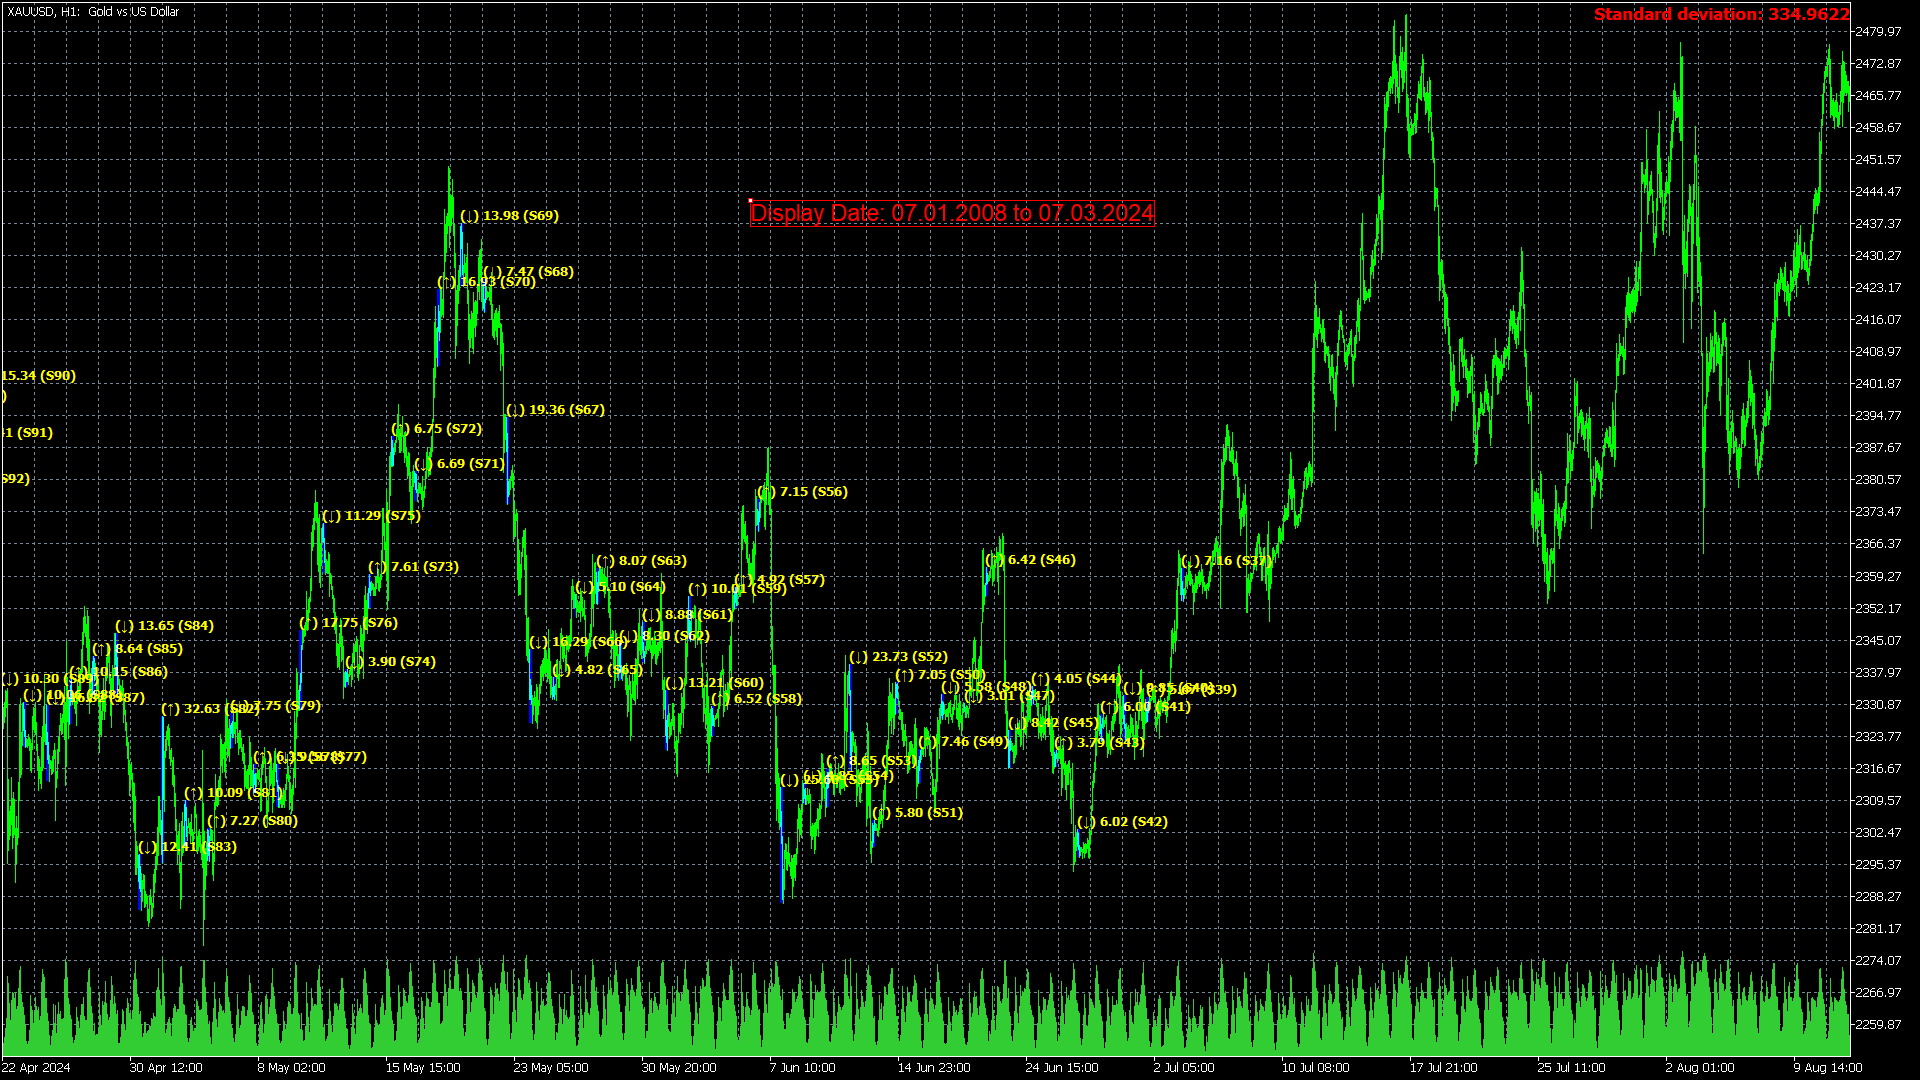
Session Standard Deviation Date Range Analyzer: Evaluate the standard deviation of each bar's price (high, low, close, open, weighted, median, and typical) within defined trading sessions and date ranges, providing detailed insights into price volatility and market behavior.
**Note:** When the trading platform is closed, the indicator may not load correctly. To ensure it works, you may need to load the indicator, unload it, and then load it again.
**Note:** This indicator can only be used with historical data. It does not support real-time data analysis.
**Note:** When switching to a different timeframe, it's recommended to switch back and forth between timeframes to ensure that all data loads properly. This process helps to fetch the necessary historical data, ensuring that calculations based on this data are accurate. Description:
The "Session Standard Deviation Date Range Analyzer" is a sophisticated analytical tool crafted for traders and analysts seeking to evaluate price volatility across specific trading sessions within a user-defined date range. Unlike traditional indicators that focus solely on high and low prices, this tool provides a comprehensive analysis based on each bar’s price, including high, low, close, open, weighted, median, and typical prices. This detailed approach helps in understanding the standard deviation of price movements, offering deeper insights into market volatility and behavior over selected periods.
Key Features:
1. Customizable Time and Date Input:
- Start Time and End Time: Users can specify the exact start and end times of the trading session they wish to analyze. This allows for precise examination of specific market hours, such as the New York session, or any other relevant time frame.
- Start Date and End Date: Define the range of dates for analysis, enabling users to focus on particular periods, such as historical economic events or periods of significant market fluctuations.
2. Bar-Based Analysis:
- The tool calculates standard deviation based on various bar prices, including high, low, close, open, weighted, median, and typical prices. This approach provides a nuanced view of price volatility by examining how each bar’s price contributes to the overall standard deviation within the selected session and date range.
3. Enhanced Volatility Insights:
- By leveraging detailed price data, users can gain a deeper understanding of market volatility during specific sessions. This feature is particularly valuable for backtesting trading strategies or studying price behavior during critical historical periods.
4. Historical Data Analysis:
- Users can analyze how price volatility has evolved over time by examining historical data. This is essential for understanding market dynamics and assessing the impact of significant events on trading sessions.
5. Application for Detailed Studies:
- The tool supports both short-term and long-term analysis, making it suitable for users looking to study price volatility over various periods. Whether evaluating daily market movements or extended historical trends, the Session Standard Deviation Date Range Analyzer provides valuable insights.
Practical Use Case:
For a trader aiming to assess the volatility of the New York trading session during the financial crisis of 2007-2009, the Session Standard Deviation Date Range Analyzer can be utilized to input the exact start and end times for the New York session and set the relevant date range. The tool will then calculate and provide the standard deviation of prices based on each bar's price data, offering a detailed view of how market volatility behaved during these turbulent times.
This tool is designed for a wide range of users, from academic researchers to professional traders, by offering a detailed and customizable view of price volatility across specific sessions and date ranges. Its advanced analysis capabilities make it a valuable asset for anyone involved in price analysis and volatility assessment.
Note: The indicator is optimized for timeframes of H4 and below.
Main Inputs:
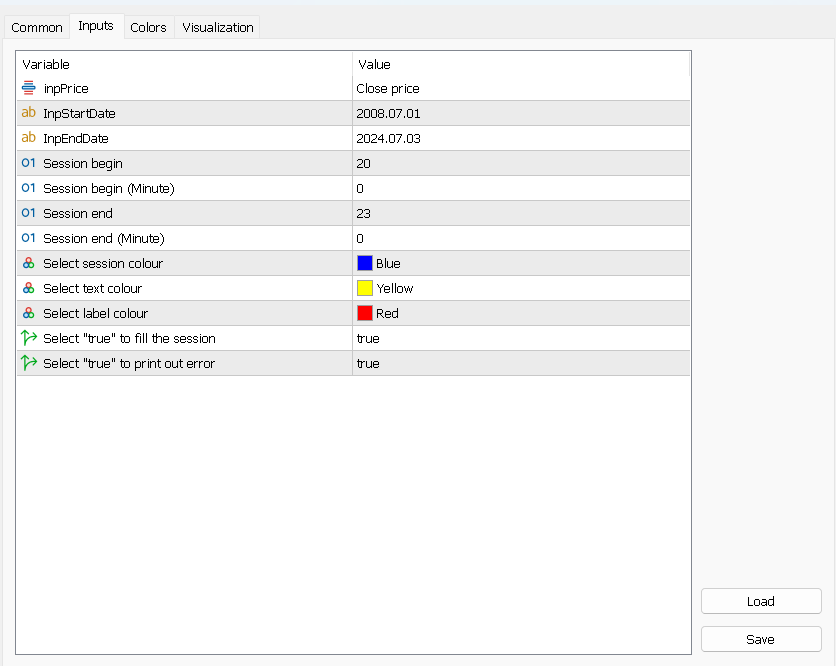
- InpPrice: Specifies the type of price used for standard deviation calculation within the selected session and date range. Options include:
- High: Use the highest price of each bar.
- Low: Use the lowest price of each bar.
- Close: Use the closing price of each bar.
- Open: Use the opening price of each bar.
- Weighted: Use the weighted price of each bar.
- Median: Use the median price of each bar.
- Typical: Use the typical price of each bar.
- InpStartDate:Specify the starting date for the analysis period.
- InpEndDate: Define the ending date for the analysis period.
- SBegin (Broker time): Sets the starting hour of the session in 24-hour format.
- SBeginMinute (Broker time): Defines the starting minute of the session.
- SEnd (Broker time): Determines the ending hour of the session in 24-hour format.
- SEndMinute (Broker time): Specifies the ending minute of the session.
- SColor: Chooses the color for displaying the session on the chart.
- InpTextColor: Sets the color for the text displayed by the indicator.
- InpLabelColor: Defines the color for labels within the indicator.
- InpFill: Selects whether to fill the session area with color.
- InpPrint: Determines whether to print error messages to the log.