CoralPage

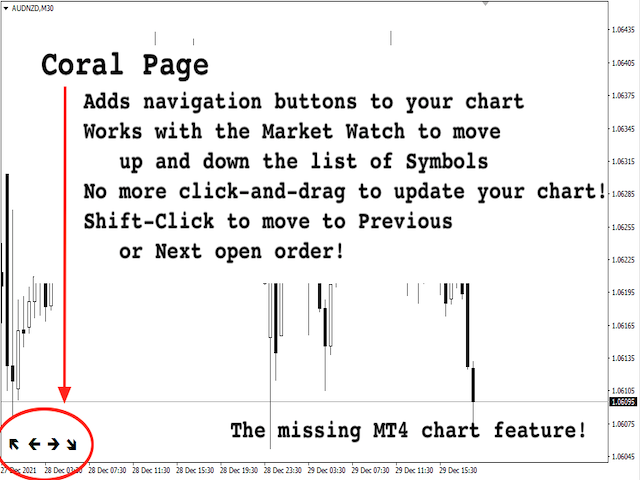
CoralPage is a simple little utility to add navigation controls to your chart.  You can now easily step through the symbols in the Market Watch without having to click-and-drag a symbol from the Market Watch onto your chart.  It's a simple but indispensable time-saver!

Click move to the first, previous, next or last symbol in the Market Watch.  Shift-click to go the the previous or next symbol that has an open order.

CoralPage is completely free.  If you like this, please check out my other products!

Önerilen ürünler
Show Pips
Roman Podpora
4.26 (58)
Bu bilgi göstergesi her zaman hesaptaki güncel durumdan haberdar olmak isteyenler için faydalı olacaktır. Gösterge, puan cinsinden kâr, yüzde ve para birimi gibi verilerin yanı sıra mevcut çiftin spreadini ve mevcut zaman diliminde çubuğun kapanmasına kadar geçen süreyi görüntüler. VERSİYON MT5 -   Daha kullanışlı göstergeler Bilgi satırını grafiğe yerleştirmek için birkaç seçenek vardır: Fiyatın sağında (fiyatın arkasında); Yorum olarak (grafiğin sol üst köşesinde); Ekranın seçilen köşesinde.
FREE
Running multiple EA's on your account and confused by who's winning and who's loosing? Try this indicator that report's in real time on the Magic Numbers in your account by reading the History_trades along with the Open_trades. Note: Manual trades are grouped under Magic Number "0". For a better visual report,  run it on a symbol that you don't execute trades on, switch the history bars to "Line Charts" and set it's color to Black.
FREE
Matrix Arrow Indicator Çoklu Zaman Çerçevesi Paneli MT4 , Matrix Arrow Indicator MT4 için ücretsiz bir eklenti ve harika bir varlıktır. 5 kullanıcı tarafından özelleştirilmiş zaman çerçevesi ve toplamda 16 değiştirilebilir sembol/araç için mevcut Matrix Arrow Indicator MT4 sinyalini gösterir. Kullanıcı, Matrix Arrow Indicator MT4 'ün içerdiği 10 standart göstergeden herhangi birini etkinleştirme/devre dışı bırakma seçeneğine sahiptir. 10 standart gösterge özelliğinin tümü, Matrix Arrow Indicato
FREE
This indicator will mirror the assets in use in another metatrader, being able to choose the timeframe and a template. This is the Metatrader 4 Client, it needs the Metatrader 4 or 5 Server versions: Metatrader 4 Mirror Chart Server: https://www.mql5.com/en/market/product/88644 Metatrader 5 Mirror Chart Server:   https://www.mql5.com/en/market/product/88652 Details of how it works in the video.
FREE
Toms Dashboard
Thomas Alexander Kevin Anderson
Dynamic Trading Dashboard for MT4 This powerful MT4 trading dashboard offers traders a comprehensive view of current and historical trading performance in an intuitive and visually organized format. With its precision-engineered design, the dashboard provides a seamless blend of real-time insights and historical analysis.  This trading dashboard is perfect for meticulous traders who seek a precise, all-encompassing tool to manage open and closed positions while gaining insights into past perform
FREE
Advanced Trade Information Dashboard –  MT4 Everything I need to know about my account and open positions, right on the chart. I got tired of clicking between the terminal, the trade tab, and the calculator just to check my margin, pip value, or total profit in pips. So I built this dashboard to put it all in one place. What It Shows Total P&L – Real profit/loss from the positions I care about (filter by symbol, magic number, or include swap/commission). Margin Level – The one number that k
FREE
This indicator help to mark the high and low of the session Asian,London,Newyork , with custom hour setting This indicator is set to count from minute candle so it will move with the current market and stop at the designated hour and create a accurate line for the day. below is the customization that you can adjust : Input Descriptions EnableAsian Enables or disables the display of Asian session high and low levels. EnableLondon Enables or disables the display of London session high and
FREE
Apex Drawdown
Carl Christian Nyberg
Uncomplicated straightforward indicator that shows the maximum account drawdown since the indicator was added to the chart. The indicator does not take transaction history into account since it is impossible to calculate drawdown from historical entries en closures of trades. The indicator will be free in this basic form. Eventually it will be developed but the focus is to keep it plain and simple.
FREE
The indicator displays price distribution on a horizontal histogram. Horizontal histogram help find out key levels of price so that you can make good decision on setting point of take profit, stop loss... You can improve exist trading strategy or get new trading idea with the histogram of price. Outstanding features Support multiple time frame : you can choose to work with history data in any time frame you want. It does not depend on current display time frame. Support weighting by volume and/
FREE
Bar0TimeSpread
Stanislav Korotky
4.5 (2)
This is a must have tool for every trader, because this indicator provides the scoreboard with most important basic information for trading. It displays current server time, remaining time of the current bar, a calculated lot for the specified risk and free margin, characteristic bar sizes, and spreads. When placed on a chart, the indicator creates a text label in the upper right corner with the following information: -17:50 [70%] 11:42:30 SL:0 SP:17 B:A41/M39/D67 L:0.26/5% remaining time to cur
FREE
This indicator allows you to number bars within a trading session for CFDs. It works on GER40, UK100, US30, US100, and US500 and is fully customizable to fit your trading style and chart preferences. Key Features & Parameters: Customizable session interval: define your own session start and end times Option to hide even numbers for a cleaner chart Adjust number distance to position the bar numbers as you prefer Font size and color: choose the size and color that suit your chart Number of days di
FREE
Trendline Architect
Torsten Hempel
5 (4)
This indicator calculates and draws lines over the chart. There are two types of trends: Trend A: the line is drawn using local lows for uptrends and local highs for downtrends Trend B: the line is drawn using local highs for uptrends and local lows for downtrends There are a few conditions, which have to be fulfilled and can be changed by the parameters (see also picture 4): MinBarAge : the count of bars to the last base point of a line is called BarAge and has to be greater than the parameter
FREE
Th3Eng Chart shadow indicator is a tool helps you to display another symbol on the current symbol in candles style or line. You can type the second symbol name in the setting and select the drawing mode { candles or line }. Also, the indicator displays the spread and current price of both pairs on the left top side corner of the chart. setting: 1- Symbol: Insert The second symbol name. 2- Drawing mode: Choose the draw mode from (Candles or line). 3- Show spreads:  true\false to display the pric
FREE
Fibomathe for MT4
Almaquio Ferreira De Souza Junior
Fibomathe Indicator: Support and Resistance Tool for MT4 The Fibomathe Indicator is a technical analysis tool designed for MetaTrader 4 (MT4) that assists traders in identifying support and resistance levels, take-profit zones, and additional price projection areas. It is suitable for traders who use structured approaches to analyze price action and manage trades. Key Features Support and Resistance Levels: Allows users to define and adjust support and resistance levels directly on the chart. L
FREE
This indicator is designed for calculating the value of points for the specified lot sizes. The MT5 version is here  https://www.mql5.com/en/market/product/29230 Description by lines Line 1 - deposit currency. Line 2 - lot size (10 input parameters) . All further values are calculated into columns below each lot size. Line 3 - calculation of value for one point. Line 4 - calculation of value for spread. All subsequent lines - calculation of value for points (20 input parameters) . All you need t
FREE
This indicator displays two important pieces of information on the MT4 chart: Current Spread - Trading cost measured in points, helping traders assess optimal entry timing when spread is low. Time Countdown - Remaining time (minutes:seconds) until the current candle closes and a new candle forms, supporting candle-based trading strategies. Information is displayed as compact text in a chart corner (default top-right), with customizable position, color, and font size. The indicator updates in rea
FREE
Time Range Separator
Chantal Sala
4.83 (6)
Time Range Separator is a useful tool to display a separator period on your platform. You could go in the properties of the indicator, select the desired range and that's ALL. We believe it is a useful and necessary that we wish to share with you for free all our followers. Input Values: TimeFrame Period Separator GMT_Hour (ex. +1 or -1) to move the lines at Period Time +/- tot hours in input Hide_dates to show or hide the datetime on vertical lines VLine_Color = Vertical Color Line VLine_Style
FREE
MQLTA Show Magic Numbers
MQL4 Trading Automation
4.14 (7)
The panel displays the list of all orders (market and pending) along with their details, including magic numbers and commentaries. The panel can be moved around the chart. For market orders, the profit listed includes the associated commission and swaps. There aren't any important input parameters, but you can control the panel's initial location via them.
FREE
TCL Super Trend
Stratos Digital (PVT) Ltd
TCL Super Trend is a trend-following indicator for MetaTrader 4. It plots a SuperTrend line, ATR-adaptive volatility bands, trend-change arrows, and an on-chart dashboard panel. HOW THE ENGINE WORKS Most SuperTrend indicators use a single Average True Range (ATR) multiplier to place a line above or below price. TCL Super Trend uses a dual-logic state machine that tracks both the highest lows and the lowest highs within a configurable lookback window, called Amplitude. A trend reversal is con
FREE
USDJPY Keltner Range M15 Strategy is a fully automated MetaTrader 5 strategy designed to capture structured breakout opportunities on USDJPY using daily directional confirmation, Keltner Channel reference levels, volatility-buffered pending STOP entries and simple fixed-risk management. The strategy is designed for USDJPY on the M15 timeframe. Its goal is to participate when the market shows directional intent through daily high or daily low behavior, while using Keltner Channel structure and
FREE
Cumulative Delta MT4
Evgeny Shevtsov
4.86 (29)
The indicator analyzes the volume scale and splits it into two components - seller volumes and buyer volumes, and also calculates the delta and cumulative delta. The indicator does not flicker or redraw, its calculation and plotting are performed fairly quickly, while using the data from the smaller (relative to the current) periods. The indicator operation modes can be switched using the Mode input variable: Buy - display only the buyer volumes. Sell - display only the seller volumes. BuySell -
FREE
The Analytical cover trend indicator is a revolutionary trend trading and filtering solution with all the important features of a trend tool built into one tool! The Analytical cover indicator is good for any trader, suitable for any trader for both forex and binary options. You don’t need to configure anything, everything is perfected by time and experience, it works great during a flat and in a trend. The Analytical cover trend indicator is a tool for technical analysis of financial markets
ZoomChart2
Sergii Krasnyi
ZoomChart göstergesi iki grafikle çalışır - başlatıldığı mevcut grafik ve bir sonraki grafik. Gösterge, ikinci grafiği birincisinin şu anda bulunduğu zamana çevirir. Böylece, ikinci grafik ilk grafikteki (göstergenin başlatıldığı yer) aynı durumu, ancak farklı bir zaman diliminde gösterir. Başka bir deyişle, bu gösterge bir büyüteç görevi görür veya tam tersine, durumu daha büyük bir zaman diliminde görüntülemek için grafiği küçültür. ZoomChar göstergesi, ana grafikteki mevcut en dıştaki çubuğ
FREE
Attention, for the indicator to work correctly, you need to put the "MQL5" folder in your terminal folder, you can download it from the link below: https://disk.yandex.ru/d/DPyo0ntaevi_2A One of the best arrow indicators for Binary Options, which can also be used in the Forex market. Any time frame from M1 to MN, any currency pair, can also be used on stocks - the indicator is universal. Expiration from 1 to 5 candles. Displays traffic statistics on a graph. The indicator gives signals along th
FREE
US30 Revolt
Lesedi Oliver Seilane
4.6 (10)
US30 Revolt a Technical indicator that is 100% non-repaint and appears on the current candlestick  works on all timeframes (recommended M15,M30,H1) The indicator is made for US30 but it can be used on other pairs as well When a blue arrow appears look for buying opportunities  When a orange arrow appears look for selling opportunities Please watch the YouTube video on how to properly set up and use the indicator
FREE
Geo Info
Georgij Komarov
5 (3)
Geo_Info is one of the most informative indicators displaying net levels as well as basic data on a symbol and trading positions in a space-saving manner. displays brief data on the basic symbol parameters in the upper left corner of the chart: Swap for Buy order, swap for Sell order, current spread, margin, tick size, stop level, order freeze level . The data is shown for one lot in points. The data is displayed as follows: SWAP B:4.200 /S:-8.470 /SPR:342 /MRG:256.0/TCV:0.10/STL:0/FRL The data
FREE
StrikePin
Mike Pascal Plavonil
1 (1)
The StrikePin indicator is a technical, analytical tool designed to identify trend reversals and find optimal market entries.  The StrikePin indicator is based on the pin bar pattern, which is the Price Action reversal pattern. An entry signal, in a trending market, can offer a very high-probability entry and a good risk to reward scenario. Be careful: the indicator is repainting since it is looking for highest high and lowest lows.  You should avoid to use it in experts but you can use it in
FREE
IceFX SpreadMonitor
Norbert Mereg
4.91 (11)
IceFX SpreadMonitor is a special spread logging indicator which displays the current, minimum/maximum and average spread values. These values are set to be visible even after a reboot. Also, SpreadMonitor could save all the desired spread values to .csv files for later analysis of the results. Indicator parameters: SpreadLowLevel - low level of spread (show value in green color) SpreadHighLevel - high level of spread (show value in red color) BGColor - background of panel SpreadNormalColor - co
FREE
There is a very simple and surprisingly effective indicator called Pi Cycle, which starts to give the first warning. It is worth a look, so as not to miss the giant elephant in the living room!)) What is Pi Cycle? Pi Cycle is a very simple indicator created by analyst Philip Swift . It takes into account two (DMA biased moving averages ): 350-day average x 2 111-day average Both can be considered long-term indicators. The second one is obviously more sensitive to current market changes, since
FREE
This indicator is one of the useful tools for traders who trade on currency pairs and based on the strength of each currency they can make a correct decision or confirmation in the positions.  It has been calculated for all the minor currency pairs supported by the broker and displays the values of the major currencies. These currencies are displayed horizontally or vertically according to the trader's config when executing the indicator. One of the trading strategies that can be used is to cho
FREE
Bu ürünün alıcıları ayrıca şunları da satın alıyor
Gann Made Easy
Oleg Rodin
4.83 (162)
Gann Made Easy , bay teorisini kullanarak ticaretin en iyi ilkelerine dayanan, profesyonel ve kullanımı kolay bir Forex ticaret sistemidir. WD Gann. Gösterge, Zararı Durdur ve Kâr Al Seviyeleri dahil olmak üzere doğru SATIN AL ve SAT sinyalleri sağlar. PUSH bildirimlerini kullanarak hareket halindeyken bile işlem yapabilirsiniz. Satın alma işleminden sonra, alım satım talimatlarını ve harika ek göstergeleri ücretsiz olarak almak için lütfen benimle iletişime geçin! Muhtemelen Gann ticaret yöntem
The Propfolio Master Suite is the ultimate all-in-one analytical workstation for professional traders. Combining the power of the Beat The Market Maker (BTMM) methodology, Smart Money Concepts (SND/Liquidity), and Advanced Volume Profile, this suite replaces multiple different indicators with one optimized engine. Monitor up to 14 pairs simultaneously from a single chart, instantly identify market cycles, and seamlessly map institutional footprints with the click of a button. The Command Center
Scalper Inside PRO
Alexey Minkov
4.74 (69)
Scalper Inside PRO Scalper Inside PRO is an intraday trend and scalping indicator for MetaTrader 4 that uses an exclusive algorithm to quickly detect market direction and key target levels. It automatically calculates entry, exit and multiple profit targets, and shows detailed performance statistics so you can see how different instruments and strategies performed. This helps you choose the most suitable trading instruments for the current market conditions. Additionally, you can easily integrat
PZ Harmonacci Patterns
PZ TRADING SLU
3.17 (6)
Trade smarter, not harder: Empower your trading with Harmonacci Patterns This is arguably the most complete harmonic price formation auto-recognition indicator you can find for the MetaTrader Platform. It detects 19 different patterns, takes fibonacci projections as seriously as you do, displays the Potential Reversal Zone (PRZ) and finds suitable stop-loss and take-profit levels. [ Installation Guide | Update Guide | Troubleshooting | FAQ | All Products  ] It detects 19 different harmonic pric
M1 Sniper
Oleg Rodin
5 (23)
M1 SNIPER kullanımı kolay bir işlem göstergesi sistemidir. M1 zaman dilimi için tasarlanmış bir ok göstergesidir. Gösterge, M1 zaman diliminde scalping için bağımsız bir sistem olarak kullanılabilir ve mevcut işlem sisteminizin bir parçası olarak kullanılabilir. Bu işlem sistemi özellikle M1'de işlem yapmak için tasarlanmış olsa da, diğer zaman dilimleriyle de kullanılabilir. Başlangıçta bu yöntemi XAUUSD ve BTCUSD ticareti için tasarladım. Ancak bu yöntemi diğer piyasalarda işlem yaparken de ya
Auto Optimized Parabolic RSI: Gelişmiş 3D Momentum Motoru Çoğu perakende indikatörü, piyasa volatilitesi değiştiği an çöken statik girdilere dayandığı için başarısız olur. Auto Optimized Parabolic RSI, kendi matematiksel avantajını sürekli olarak yeniden hesaplayarak "indikatör körelmesi" (indicator decay) sorununu çözer ve kurumsal düzeyde kantitatif adaptasyonu doğrudan MT5 terminalinize getirir. Temel Avantaj: Özel Bellek İçi (In-Memory) 3D Optimizasyon   Standart otomatik optimize ediciler,
NAM Order Blocks
NAM TECH GROUP, CORP.
3.67 (3)
MT4 Multi-timeframe Order Blocks detection indicator. Features - Fully customizable on chart control panel, provides complete interaction. - Hide and show control panel wherever you want. - Detect OBs on multiple timeframes. - Select OBs quantity to display. - Different OBs user interface. - Different filters on OBs. - OB proximity alert. - ADR High and Low lines. - Notification service (Screen alerts | Push notifications). Summary Order block is a market behavior that indicates order collection
Quants HL Break
Ferhat Mutlu
5 (2)
LH ve HL kesintilerini bulmak için saf fiyat eylemiyle yapılan gelişmiş hesaplama. Piyasada size büyük bir geri dönüş noktası verecektir.LH ve HL sinyalleri trengle çıkışları için de kullanılabilir. Koparma gerçekleştiğinde, güçlü bir geri dönüş olduğunu gösterir.Hareketli Ortalamalar için güzel bir filtre.Bunu trend göstergeleriyle kullanmanızı şiddetle tavsiye ederim. Destek ve direnç, arz talep göstergeleri için ekstra bir onay olarak kullanılabilir. Daha fazla ayrıntı aşağıdaki forex iş p
Dynamic Forex28 Navigator
Bernhard Schweigert
4.43 (7)
Dynamic Forex28 Navigator - Yeni Nesil Forex Ticaret Aracı. ŞU ANDA %49 İNDİRİM. Dynamic Forex28 Navigator, uzun zamandır popüler olan göstergelerimizin evrimidir ve üçünün gücünü tek bir göstergede birleştirir: Gelişmiş Döviz Gücü28 Göstergesi (695 inceleme) + Gelişmiş Döviz İMPULS ve UYARI (520 inceleme) + CS28 Kombo Sinyalleri (Bonus). Gösterge hakkında ayrıntılar https://www.mql5.com/en/blogs/post/758844 Yeni Nesil Güç Göstergesi Ne Sunuyor?  Orijinallerde sevdiğiniz her şey, şimdi yeni
PRO Renko Sistemi, RENKO grafikleri ticareti için özel olarak tasarlanmış son derece hassas bir ticaret sistemidir. Bu, çeşitli ticaret araçlarına uygulanabilen evrensel bir sistemdir. Sistemi etkin piyasa sana doğru ters sinyallerine erişim hakkı denilen ses nötralize eder. Göstergenin kullanımı çok kolaydır ve sinyal üretiminden sorumlu tek bir parametreye sahiptir. Aracı, seçtiğiniz herhangi bir ticaret aracına ve renko çubuğunun boyutuna kolayca uyarlayabilirsiniz. Yazılımımla karlı bir
RFI levels PRO
Roman Podpora
5 (1)
Bu gösterge, fiyat dönüş noktalarını ve fiyat geri dönüş bölgelerini doğru bir şekilde gösterir.       Başlıca oyuncular   . Yeni trendlerin nerede oluştuğunu görüyorsunuz ve her işlem üzerinde kontrolü elinizde tutarak, azami hassasiyetle kararlar alıyorsunuz. TREND LINES PRO   göstergesiyle birlikte kullanıldığında maksimum potansiyelini ortaya koyar.  VERSION MT5 Göstergenin gösterdiği şey: Yeni bir trendin başlangıcında aktivasyonla birlikte tersine dönüş yapıları ve tersine dönüş seviyeler
Apollo SR Master , Destek/Direnç bölgelerinde alım satımı daha kolay ve güvenilir hale getiren özelliklere sahip bir Destek/Direnç göstergesidir. Gösterge, yerel fiyat zirvelerini ve diplerini tespit ederek Destek/Direnç bölgelerini herhangi bir gecikme olmadan gerçek zamanlı olarak hesaplar. Ardından, yeni oluşan Destek/Direnç bölgesini doğrulamak için, Destek/Direnç bölgesinin dikkate alınabileceğini ve gerçek bir SAT veya AL sinyali olarak kullanılabileceğini gösteren özel bir sinyal gösterir
Bu indikatörü satın alırsanız, Profesyonel Trade Manager’ımı  + EA   ÜCRETSİZ olarak alacaksınız. Öncelikle, bu Ticaret Sistemi'nin Non-Repainting, Non-Redrawing ve Non-Lagging Göstergesi olduğunu vurgulamak önemlidir, bu da hem manuel hem de robot ticareti için ideal hale getirir. Online kurs, kılavuz ve ön ayarları indir. "Smart Trend Trading System MT5", yeni ve deneyimli tüccarlar için özelleştirilmiş kapsamlı bir ticaret çözümüdür. 10'dan fazla premium göstergeyi birleştiriyor ve 7'den faz
GoldRush Trend Ok Sinyali GoldRush Trend Ok Sinyali göstergesi, XAU/USD'de yüksek hızlı, kısa vadeli scalperlar için özel olarak tasarlanmış hassas, gerçek zamanlı trend analizi sağlar. 1 dakikalık zaman dilimi için özel olarak tasarlanan bu araç, net giriş noktaları için yön okları gösterir ve scalper'ların değişken piyasa koşullarında güvenle hareket etmelerini sağlar. Gösterge, PRIMARY ve SECONDARY uyarı oklarından oluşur. PRIMARY sinyalleri, trend yönündeki değişikliği gösteren Beyaz ve
ŞU ANDA %40INDIRIMLI Yeni Başlayanlar veya Uzman Tüccarlar için En İyi Çözüm! Bu Gösterge benzersiz, yüksek kaliteli ve uygun fiyatlı bir ticaret aracıdır çünkü bir dizi tescilli özellik ve yeni bir formül ekledik. Sadece BİR grafik ile 28 Forex çifti için Döviz Gücünü okuyabilirsiniz! Yeni bir trendin veya scalping fırsatının tam tetik noktasını belirleyebildiğiniz için ticaretinizin nasıl gelişeceğini hayal edin? Kullanım kılavuzu: buraya tıklayın Bu ilk olan, orijinal! Değersiz bir özent
CRT Candle Range Theory HTF MT4.   Ultimate CRT Indicator: Advanced ICT Concepts and Malaysian SnR Trading System Discounted   Price   $50  !!     Secure your lifetime access   now   before it switches to   subscription-only ! Master the Market Maker's Footprints with the Most Advanced Candle Range Theory Indicator Unlock the true power of   Smart Money Concepts (SMC)   and trade precisely like the institutions with the   Ultimate CRT Indicator . Built exclusively for serious traders, this indic
Market Structure Patterns MT4
Samuel Manoel De Souza
5 (18)
Market Structure Patterns ,   smart money concepts   (akıllı para kavramları) temelinde geliştirilen ve   SMC/ICT   öğelerini grafik üzerinde gösteren bir göstergedir. Bu öğeler, işlem kararlarınızı bir üst seviyeye taşımanıza yardımcı olur. Grafikte bir unsur oluştuğunda, fiyat bir seviyeyi geçtiğinde veya bir kutu/bölgeye girdiğinde,   uyarılar ,   bildirimler   ve   e-posta mesajları   aracılığıyla anında bilgilendirilirsiniz. Geliştiriciler,   global variables   (küresel değişkenler) aracılı
Advanced Supply Demand
Bernhard Schweigert
4.91 (300)
Özel Ticaret –%40 İndirim Yeni Başlayanlar veya Uzman Yatırımcılar İçin En İyi Çözüm! Bu gösterge, bir dizi özel özellik ve yeni bir formül içerdiği için benzersiz, yüksek kaliteli ve uygun fiyatlı bir işlem aracıdır. Bu güncelleme ile çift zaman dilimi bölgeleri gösterebileceksiniz. Sadece daha yüksek bir zaman dilimini değil, hem grafik zaman dilimini hem de daha yüksek zaman dilimini gösterebileceksiniz: İÇ İÇE GEÇMİŞ BÖLGELER GÖSTERİYOR. Tüm Arz Talep yatırımcıları buna bayılacak. :) Önem
Identify key turning points with reliable fractal analysis This indicator examines the price structure of fractals of different periods to determine possible reversal points in the market, providing timing to positional traders that already have a fundamental or technical valuation model. Unlike its younger brother, Reversal Fractals , this indicator won't miss reversals because of the period selected, and will find reversal fractals on a zig-zag fashion, ignoring those reversals which do not
Eğer Forex piyasasında işlem yapıyorsanız, döviz gücü ve döviz çiftleri arasındaki korelasyon hakkında ayrıntılı bilgi sahibi olmak, işlem performansınızı yeni bir seviyeye taşıyabilir. Korelasyon, riskinizi yarıya indirmenize yardımcı olurken, güç analizi kârınızı maksimize etmenizi sağlar. Bu gösterge, döviz gücü analizi ile döviz çiftleri korelasyonunu birleştirerek en uygun döviz çiftlerini seçmek için hibrit bir yaklaşım sunar. Döviz Gücü Analizi Nasıl Kullanılır Örneğin, işlem stratejiniz
Trend Catcher ind
Ramil Minniakhmetov
TREND YAKALAYICI GÖSTERGE Trend Yakalayıcı Gösterge, yazarın tescilli ve özelleştirilmiş uyarlanabilir trend analiz göstergelerinin bir kombinasyonunu kullanarak piyasa fiyat hareketlerini analiz eder. Kısa vadeli gürültüyü filtreleyerek ve temel momentum gücüne, volatilite genişlemesine ve fiyat yapısı davranışına odaklanarak gerçek piyasa yönünü belirler. Ayrıca, hareketli ortalamalar, RSI ve volatilite filtreleri gibi yumuşatma ve trend filtreleme özelleştirilmiş göstergelerinin bir kombina
Day Trader Master , günlük tüccarlar için eksiksiz bir ticaret sistemidir. Sistem iki göstergeden oluşmaktadır. Bir gösterge, satın almak ve satmak için bir ok işaretidir. Aldığınız ok göstergesidir. Size ikinci göstergeyi ücretsiz olarak sağlayacağım. İkinci gösterge, bu oklarla birlikte kullanılmak üzere özel olarak tasarlanmış bir trend göstergesidir. GÖSTERGELER TEKRARLAMAYIN VE GEÇ KALMAYIN! Bu sistemi kullanmak çok basittir. İki renkli bir çizgi olarak görüntülenen mevcut trend yönündeki o
KURAMA GOLD SIGNAL PRO (MT4) — 7 Katmanlı Filtre, Otomatik TP/SL ve Kalite Puanı ile Komple XAUUSD Trading Sistemi REPAINT YOK. YENİDEN ÇİZİM YOK. GECİKME YOK. Her sinyal kalıcıdır. Gördüğün, aldığındır. BONUS: Ömür boyu lisansı al ve AI Zone Radar ($59 değerinde) + tam PDF kılavuzunu ÜCRETSİZ al. Satın aldıktan sonra bana mesaj gönder. AI Zone Radar: https://www.mql5.com/en/market/product/175834 TRADERLAR GÜVENİYOR: Aktif bir Altın trader topluluğu tarafından zaten kullanılıyor. Hassasiyet
" Dynamic Scalper System " göstergesi, trend dalgaları içinde işlem yapmak için scalping yöntemi için tasarlanmıştır. Başlıca döviz çiftleri ve altın üzerinde test edilmiştir, diğer işlem araçlarıyla uyumluluğu mümkündür. Ek fiyat hareketi desteğiyle trend boyunca pozisyonların kısa vadeli açılması için sinyaller sağlar. Göstergenin prensibi. Büyük oklar trend yönünü belirler. Küçük oklar şeklinde scalping için sinyaller üreten bir algoritma trend dalgaları içinde çalışır. Kırmızı oklar yüksel
Master head and shoulders patterns for better trading decisions A head and shoulders pattern is a chart formation that resembles a baseline with three peaks, the outside two are close in height and the middle is highest. It predicts a bullish-to-bearish trend reversal and is believed to be one of the most reliable trend reversal patterns. It is one of several top patterns that signal, with varying degrees of accuracy, that a trend is nearing its end. [ Installation Guide | Update Guide | Trouble
Trade double tops and bottoms effectively The PZ Double Top/Bottom Indicator is a technical analysis tool that helps traders identify potential price reversal patterns in the market. These patterns, known as double tops and bottoms, are characterized by two consecutive peaks or valleys in the price of an asset. Double tops and bottoms are often seen as potential reversal patterns because they can signal a change in the direction of the current trend. [ Installation Guide | Update Guide | Troubl
Apex Break PRO, MetaTrader 4 için yeniden çizim yapmayan bir pivot trend çizgisi kırılım göstergesidir. Pivot yükseklerini ve pivot düşüklerini tespit eder, ardışık pivotlar arasında dinamik eğimli trend çizgileri çizer ve fiyat onaylanmış bir bar kapanışında bu trend çizgilerini kırdığında alım ve satım sinyalleri üretir. Her sinyal en fazla dört bağımsız konfluans katmanından geçirilerek filtrelenir — EMA trendi, RSI sınırları, hacim ani artış tespiti ve ADX trend gücü — ve yıldız derecelendir
Special offer : ALL TOOLS , just $35 each! New tools   will be   $30   for the   first week   or the   first 3 purchases !  Trading Tools Channel on MQL5 : Join my MQL5 channel to update the latest news from me Üç Çubuklu Tersine Dönüş Deseni Göstergesi , üç çubuklu tersine dönüş modellerini otomatik olarak tanımlayıp fiyat grafiğinde vurgulayan güçlü bir araç sunar. Bu gösterge, potansiyel trend tersine dönüşlerini tespit etmek için değerli bir kaynaktır ve kullanıcıların entegre edilmiş trend
Gold Scalper Super
Aleksandr Makarov
5 (2)
Gold Scalper Super is an easy-to-use trading system. The indicator can be used as a standalone scalping system on the M1 time frame, as well as part of your existing trading system. Bonus: when purchasing an indicator, Trend Arrow Super is provided free of charge, write to us after purchase. The indicator 100% does not repaint!!! If a signal appears, it does not disappear! Unlike indicators with redrawing, which lead to the loss of a deposit, because they can show a signal and then remove it.
Grafikleri yapılandıran ve döngüsel fiyat hareketlerini belirleyen teknik bir gösterge. Herhangi bir grafik üzerinde çalışabilirim. Birkaç çeşit bildirim var. Grafiğin kendisinde ek oklar var. Tarihe yeniden bakmadan, mumun kapanışına dair çalışmalar. M5 ve üzeri TF önerilir. Kullanımı ve yapılandırması kolay parametreler. Farklı parametrelere sahip 2 indikatörü kullanırken, bunları diğer indikatörler olmadan da kullanabilirsiniz. 2 giriş parametresi vardır Döngüsellik ve Sinyal Süresi Bu 2 pa
Yazarın diğer ürünleri
CoralDash
D Armond Lee Speers
CoralDash is a simple symbol shortcut dashboard.   The Symbol List has many presets to choose from:  Market Watch Open Orders Current Chart Majors A custom list Clicking the symbol has two available actions Set the current chart symbol Filter the list of symbols shown in the dashboard based on one currency (e.g., see all EUR pairs) Click the "PAIR" cell in the header to toggle between the two available actions Click the symbol cell to apply the action For the filter, click the left side to selec
FREE
Coral Trade Planner is a 3-in-1 tool for making smart trades.   The Lot Size Calculator lets you determine the appropriate lot size based on risk, and see the impact on your risk as you change the stop loss distance and/or lot size.   The Trade Planner is an innovative tool for visualizing your planned trades on the chart, and gives you immediate feedback on the value of the trade (both the risk of hitting your stop loss and the reward of hitting your take profit).  Both Market and Pending order
Coral Multi TF Meter allows you to quickly see how price is moving on a single currency pair across multiple timeframes at once.  You can select which timeframes to display; the size, position, colors of cells; whether to display values or not; and how often the meter is updated. The calculation is based on ATR distance for each displayed timeframe.  Hover over the header cell for the row (with the currency name in it) to see the current ATR value (in pips) for that period.  When "Display Values
Coral Heatmap
D Armond Lee Speers
Coral Heatmap is a currency strength meter based on the ATR values for the selected timeframe.  There are two main view modes: All Currencies (default) - see the ranked strength of all currencies in a single view Selected Currency - see the relative strength of all other currencies compared to a selected currency You can optionally display the timeframe selection toolbar; timeframe is always synchronized to the current chart timeframe.  Use keyboard shortcuts to quickly navigate currencies (up/d
Coral Rate of Change Dashboard  displays "rate of change" calculations across multiple symbols and timeframes simultaneously.  See at a glance which pairs are moving, and how quickly.  Receive alerts when any symbol + timeframe is experiencing very strong movement.  You can display data for currency pairs, or for individual currencies (takes the average for each currency across all available pairs). See the CoralDash product description for the core functionality of the dashboard (symbol exposu
Coral Notify Dash
D Armond Lee Speers
Coral Notify Dash allows you to manage all of your chart price-based notifications from a single consolidated dashboard.  It fills a gap left by MT4, which does not support popup alerts.  If you're like me and you often don't hear the alert sound for the built-in alerts, this is an indispensable tool. I use Coral Notify Dash as part of my daily chart analysis workflow.  I use a tool like Coral Dash (available for free,  here ) or one of the other dashboards to set my trading bias.  As I review t
Coral History displays information about your trading account and a summary of your history for the day, week, month and all time in a convenient, lightweight window. NEW : You can now set daily / weekly / monthly goals.   Coral History can notify you when reaching a goal.  If set the goal will be displayed in the History section row header; and if you've reached the goal the row will be highlighted in green. Account Information Balance Equity Free Margin (amount, percent or drawdown) Marin Leve
Coral Rescue will help save an account with trades in drawdown.  Do you have losing trades that are just too large to deal with?  They reduce your available margin and can be accumulating swap costs, but the loss would be too great to just accept closing the trades.  Just hoping that price will eventually come back is not an effective strategy, you need a disciplined, consistent and preferably automatic way to dig yourself out of the hole. Coral Rescue is not an EA that places trades on its own.
Chart Logic is here!  Chart automation for MT4: put your Ideas into Actions! Chart Logic is an EA for MT4 that lets you automate actions on your charts.  You define "conditions" and 'actions"; when all the conditions are true, then all the actions are triggered.  Conditions can refer to a wide range of observations, about account information, candle data, technical indicators, key levels, price, time, market data, trades and so on.  And actions can send alerts/notifications, open/close/modify tr
Filtrele:
Değerlendirme yok
Değerlendirmeye yanıt