Five Candles Pattern
- Göstergeler
- Sürüm: 1.6
- Güncellendi: 17 Kasım 2021
- Etkinleştirmeler: 5

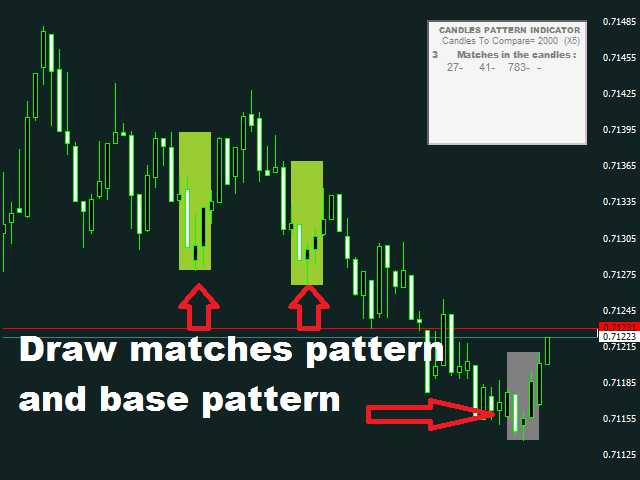
The "Five Candle Pattern" indicator is a novel way to see the market, because with it we can compare and/or seek training or the pattern of the past 4 or 5 Candles, and identify them in the same graph, to view your behavior at an earlier time.
The indicator creates a pattern of those 4 or 5 candles and searches backward, identifies, and marks the same formation or pattern.
With that information you adjust the strategy that is operating, or create a new one, because you can compare the past development of the current pattern and on that basis it easier to identify the trend.
It is an easy and immediate way to look as the graph behaved when the information was quite similar to the formation or candlestick pattern that is developing at the moment.
Although the name emphasizes a pattern of 5 candles, the indicator can be used also by a pattern of 4 candles, just as is customizable color pattern base, the color of the pattern matches, and the number of candles to review in search of the Pattern or formation.
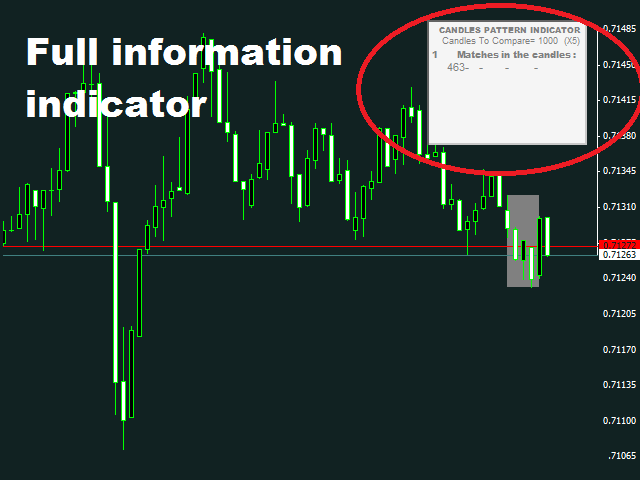
It is a potential tool that will refine the strategy and which will be completely useful for traders. The indicator is accompanied by an information table which shows all the information and results of the indicator.
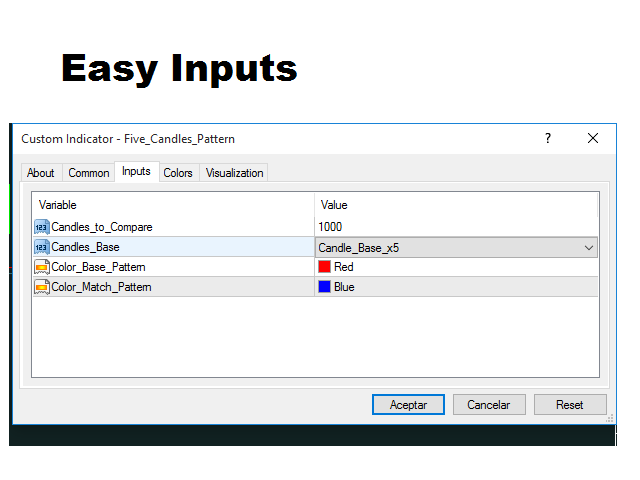
Indicator parameters
- Candles_to_Compare: is the number of candles we want to review, and in which we will look for matches with the base pattern
- Candles_base: select between 2 options, search for a pattern of 4 candles or a pattern of 5 candles.
- Color_Base_Pattern: We select the color for the base pattern.
- Color_Match_Pattern: Select the color for the patterns that have matched.
- Corner: from this option, select one of the 4 corners of the chart, where you want the indicator information to appear