Five Candles Pattern
- Indikatoren
-
Miguel Antonio Rojas Martinez
 Mql language programmer.
I have automated various strategies to different customers in order to make operations easier when the Forex market operates - Version: 1.6
- Aktualisiert: 17 November 2021
- Aktivierungen: 5
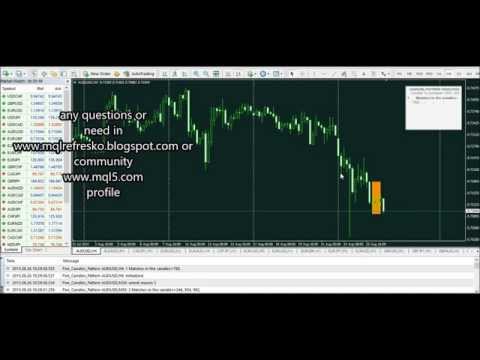
Der "Five Candle Pattern"-Indikator ist eine neue Art, den Markt zu sehen, denn mit ihm können wir die Ausbildung oder das Muster der letzten 4 oder 5 Kerzen vergleichen und/oder suchen und sie in derselben Grafik identifizieren, um Ihr Verhalten zu einem früheren Zeitpunkt zu sehen.
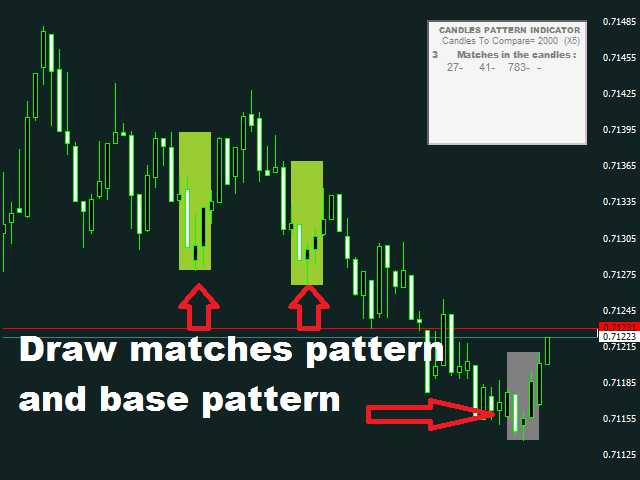
Der Indikator erstellt ein Muster aus diesen 4 oder 5 Kerzen und sucht rückwärts, identifiziert und markiert die gleiche Formation oder das gleiche Muster.
Anhand dieser Informationen können Sie die derzeitige Strategie anpassen oder eine neue Strategie entwickeln, da Sie die Entwicklung des aktuellen Musters in der Vergangenheit vergleichen und auf dieser Grundlage den Trend leichter erkennen können.
Es ist ein einfacher und unmittelbarer Weg, um zu sehen, wie sich das Diagramm verhalten hat, als die Informationen der Formation oder dem Candlestick-Muster, das sich im Moment entwickelt, sehr ähnlich waren.
Obwohl der Name betont ein Muster von 5 Kerzen, kann der Indikator auch durch ein Muster von 4 Kerzen verwendet werden, ebenso wie anpassbare Farbe Muster Basis, die Farbe des Musters entspricht, und die Anzahl der Kerzen zu überprüfen, auf der Suche nach dem Muster oder Formation.
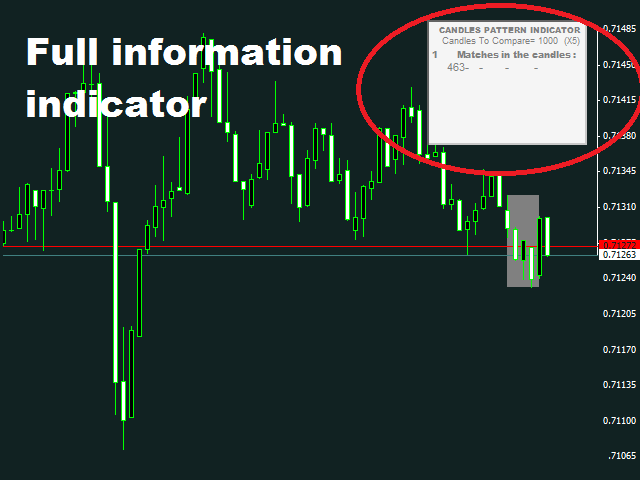
Es handelt sich um ein potentielles Werkzeug, das die Strategie verfeinern wird und das für Trader durchaus nützlich sein wird. Der Indikator wird von einer Informationstabelle begleitet, die alle Informationen und Ergebnisse des Indikators anzeigt.
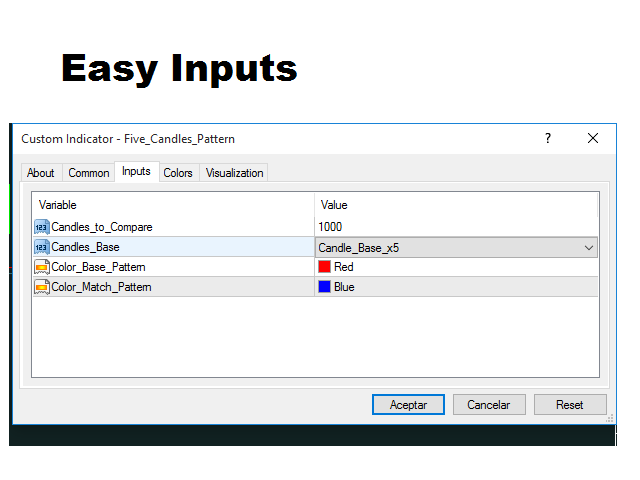
Parameter des Indikators
- Candles_to_Compare: ist die Anzahl der Kerzen, die wir überprüfen wollen, und in denen wir nach Übereinstimmungen mit dem Basismuster suchen werden
- Kerzen_Basis: Wählen Sie zwischen 2 Optionen, suchen Sie nach einem Muster aus 4 Kerzen oder einem Muster aus 5 Kerzen.
- Farbe_Basismuster: Wir wählen die Farbe für das Basismuster.
- Farbe_Anpassen_Muster: Wählen Sie die Farbe für die Muster, die übereinstimmen.
- Ecke: Wählen Sie aus dieser Option eine der 4 Ecken des Charts aus, in der die Indikatorinformationen erscheinen sollen.