• Aperçu
  • Avis (1)
  • Commentaires (4)
  • Nouveautés

Color Candles Identify the Major Trend

5

L'indicateur comprend deux parties.

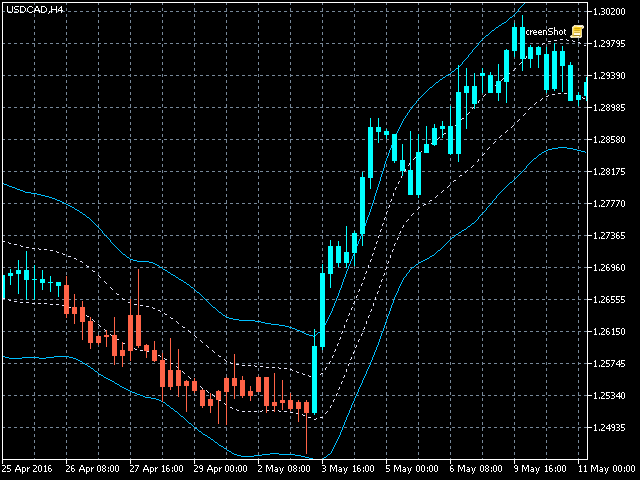
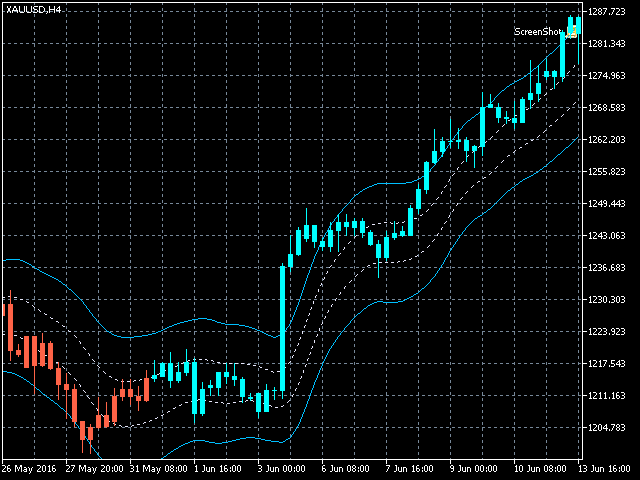
Partie I : Les bougies colorées montrent la grande tendance

Les bougies de couleur consistent à identifier l'état du marché à l'aide de chandeliers de couleur.

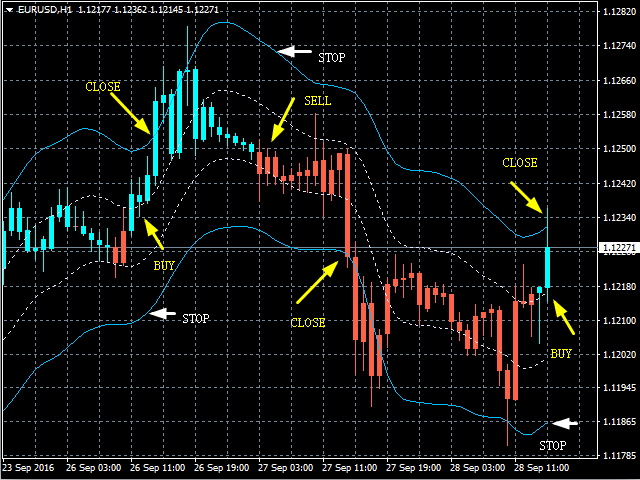
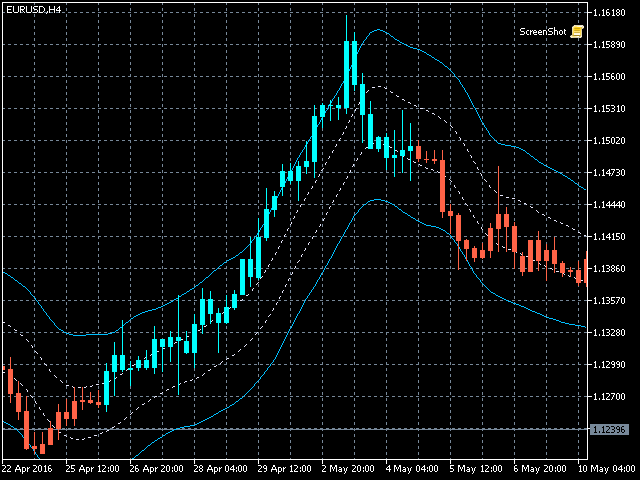
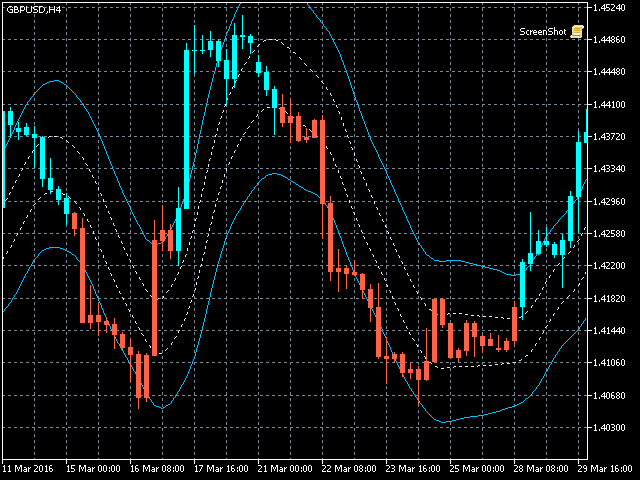
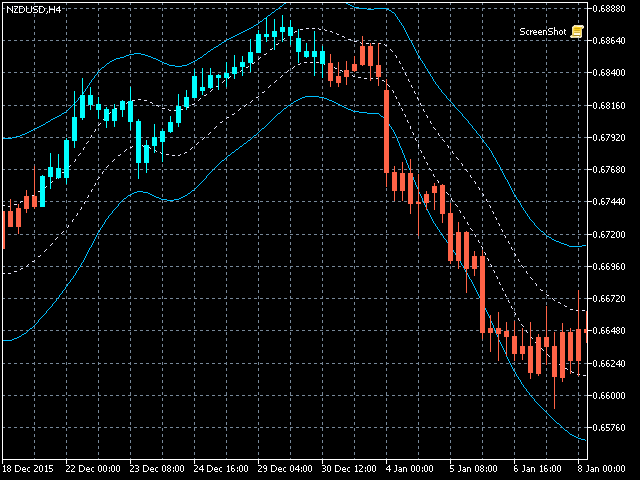
Comme le montrent les captures d'écran, si la couleur est Aqua, le marché est dans un état dans lequel vous devez passer des ordres longs ou quitter des ordres courts. Si la couleur est Tomate, c'est le moment de passer des commandes courtes ou de sortir des commandes longues.

Si la couleur change, il vaut mieux attendre sa fin (jusqu'à ce que la barre actuelle soit fermée).

Partie II : Dessiner des bandes

Les bandes intérieures sont définies comme zone de sécurité et les bandes extérieures sont destinées aux ordres rapprochés.

Stratégie de trading comme ci-dessous :

  • Si la couleur est Aqua et que le prix est dans les bandes intérieures, passez une commande longue, lorsque le prix traverse les bandes extérieures, il est temps de clôturer la commande.
  • Si la couleur est tomate et que le prix est dans les bandes intérieures, passez une commande courte, lorsque le prix traverse les bandes extérieures, il est temps de clôturer la commande.
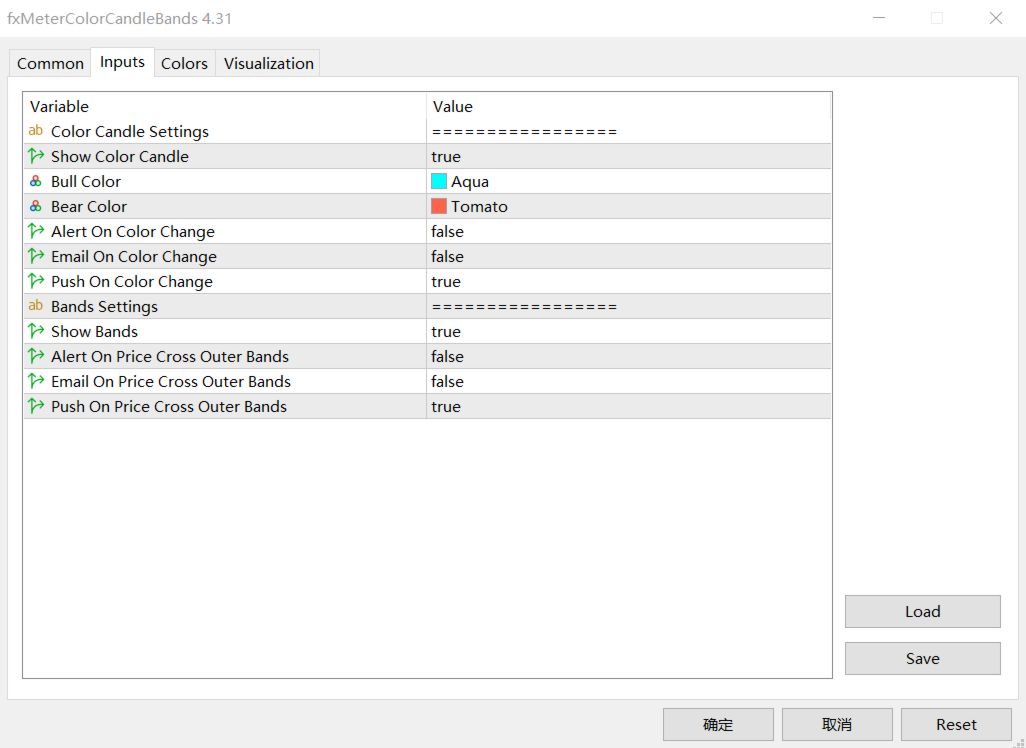
Remarque : marché d'entrée uniquement lorsque le prix se situe dans les bandes intérieures. Ceci est très important.


Paramètres d'entrée

  • ShowColorCandle    - vrai signifie que l'indicateur dessine une bougie de couleur.
  • AlertColorChange   - vrai signifie qu'il y aura une alerte lorsque le changement de couleur sera terminé.
  • EmailColorChange   - vrai signifie qu'il y aura un e-mail lorsque le changement de couleur sera terminé.
  • ShowBands    - l'indicateur de vrais moyens dessine les bandes
  • AlertCrossOuterBands   - De vrais hommes seront alertés lorsque le prix franchira les bandes extérieures
  • AlertCrossOuttrBands   - vrai signifie qu'il y aura un e-mail lorsque le prix franchira les bandes extérieures.

Version MT4 :   https://www.mql5.com/fr/market/product/10455


Avis 1
Edgar Duttweiler
639
Edgar Duttweiler 2018.08.21 14:47 
 

For my strategy a great EA-indicator !!!!

Produits recommandés
An indicator of pattern #31 ("Long Island") from Encyclopedia of Chart Patterns by Thomas N. Bulkowski. The second gap is in the opposite direction. Parameters: Alerts - show alert when an arrow appears   Push - send a push notification when an arrow appears (requires configuration in the terminal) GapSize - minimum gap size in points ArrowType - a symbol from 1 to 17 ArrowVShift - vertical shift of arrows in points   ShowLevels - show levels ColUp - color of an upward line ColDn - color of a
Owl Smart Levels MT5
Sergey Ermolov
4.47 (36)
Version MT4   |  FAQ L' indicateur Owl Smart Levels est un système de trading complet au sein d'un seul indicateur qui comprend des outils d'analyse de marché populaires tels que les fractales avancées de Bill Williams , Valable ZigZag qui construit la structure d'onde correcte du marché et les niveaux de Fibonacci qui marquent les niveaux exacts d'entrée. sur le marché et les endroits où prendre des bénéfices. Description détaillée de la stratégie Mode d'emploi de l'indicateur Conseiller-Assis
Noize Absorption Index - is the manual trading system that measures the difference of pressure between bears forces and bulls forces. Green line - is a noize free index that showing curent situation. Zero value of index shows totally choppy/flat market.Values above zero level shows how powerfull bullish wave is and values below zero measures bearish forces.Up arrow appears on bearish market when it's ready to reverse, dn arrow appears on weak bullish market, as a result of reverse expectation.
Laguerre SuperTrend Clouds   adds an Adaptive Laguerre averaging algorithm and alerts to the widely popular SuperTrend indicator. As the name suggests,   Laguerre SuperTrend Clouds (LSC)   is a trending indicator which works best in trendy (not choppy) markets. The SuperTrend is an extremely popular indicator for intraday and daily trading, and can be used on any timeframe. Incorporating Laguerre's equation to this can facilitate more robust trend detection and smoother filters. The LSC uses the
US30NinjaMT5
Satyaseelan Shankarananda Moodley
US30 Ninja is a 5 minute scalping indicator that will let know you when there is a trade set up (buy or sell). Once the indicator gives the trade direction, you can open a trade and use a 30 pip stop loss and a 30 pip to 50 pip take profit. Please trade at own own risk. This indicator has been created solely for the US30 market and may not yield positive results on any other pair. 
Trading Utility for Forex Currency Pairs Only not for Gold  Functions Auto Lot Calculation based on Risk Auto stoploss  Auto TakeProfit Breakeven Auto Close Half % Close in percentage with respect to the PIPs Pending Orders BuyLimit Sell Limit with distances BuyStop Sell Stop    with distances Trading Informations Risk in percentage For Multiple trades Combine Takeprofit and Combine Stoplosses
Renko Gold
Ignacio Agustin Mene Franco
Renko Gold! clearly indicates the floors and ceilings where it goes from 4 lines, the line below that marks the floor in green confirming with the thinnest line clarifies the purchase entry, the same is for sale, the top line marks the ceiling and the thinnest red line marks the sale, This indicator works for all temporalities! For Forex and Synthetic Indices markets! It also works for crypto markets! Good profit! World Investor.
This is a multi-symbol and multi-timeframe table-based indicator designed for a candlestick patterns detection with 46 patterns for META TRADER 5. Each formation has own image for easier recognition. Here you find most popular formations such as "Engulfing", "Hammer", "Three Line Strike", "Piercing" or Doji - like candles. Check my full list of patterns on my screenshots below. Also you can not only switch all bearish or bullish patterns from input, but also select formation for a specified symb
Candle hunter
Ruslan Khasanov
5 (1)
Indicateur pour l'analyse graphique. Marque les principaux modèles de chandeliers japonais sur le graphique. À l'heure actuelle, l'ensemble de modèles suivant est disponible pour le commerçant :  - Bearish/Bullish Abandoned Baby;  - Bearish Advance Block;  - Bearish Deliberation;  - Bearish/Bullish Belt Hold;  - Bearish/Bullish Engulfing;  - Bearish Shooting Star;  - Bearish Evening Star;  - Bearish Evening Doji Star;  - Bearish/Bullish Doji Star;    - Bearish/Bullish Tri-Star;  - Bearish Hangi
An indicator of pattern #30 ("Island Reversal") from Encyclopedia of Chart Patterns by Thomas N. Bulkowski (two gaps, the second gap is in the direction of the first one). Parameters: Alerts - show alert when an arrow appears   Push - send a push notification when an arrow appears (requires configuration in the terminal) GapSize - minimum gap size in points ArrowType - a symbol from 1 to 17 ArrowVShift - vertical shift of arrows in pixels ShowLevels - show levels ColUp - color of an upward line
L'indicateur montre des modèles harmoniques sur le graphique   sans repeindre   avec le minimum de décalage possible. La recherche de sommets d'indicateurs est basée sur le principe des vagues de l'analyse des prix. Les paramètres avancés vous permettent de choisir les paramètres de votre style de trading. À l'ouverture d'une bougie (barre), lorsqu'un nouveau motif se forme, une flèche de la direction probable du mouvement des prix est fixée, qui reste inchangée. L'indicateur reconnaît les modèl
L'indicateur calcule et trace automatiquement les niveaux de support et de résistance de Fibonacci - l'un des outils les plus efficaces pour l'analyse de marché. Le calcul utilise les données de prix moyennes pour la période et la période sélectionnées. Le minimum et le maximum pour cette période sont considérés comme le début et la fin du mouvement. Les niveaux de Fibonacci vous permettent de voir des points de référence potentiels, autour desquels le mouvement des prix peut ralentir ou s'inver
Was: $249  Now: $99   Market Profile defines a number of day types that can help the trader to determine market behaviour. A key feature is the Value Area, representing the range of price action where 70% of trading took place. Understanding the Value Area can give traders valuable insight into market direction and establish the higher odds trade. It is an excellent addition to any system you may be using. Inspired by Jim Dalton’s book “Mind Over Markets”, this indicator is designed to suit the
Market Structure Patterns
Samuel Manoel De Souza
4.7 (20)
Market Structure Patterns is an indicator based on smart money concepts that displays almost all of the SMC/ICT elements needed to take your trading decisions to the next level. Take advantage of the alerts , push notifications and email messages to keep informed from when an element is formed on the chart, the price crosses a level and/or enters in a box/zone. Developers can access the values of the elements of the indicator using the global variables  what allows the automation of trading deci
Volality Index scalper indicator  Meant for Volality pairs such as Volality 10, 25, 50, 75 and 100 The indicator works on all timeframes from the 1 minute to the monthly timeframe the indicator is non repaint the indicator has 3 entry settings 1 color change on zero cross 2 color change on slope change 3 color change on signal line cross Orange line is your sell signal Blue line is your buy signal.
An indicator of patterns #24, #25, #26 and #27 ("Head and Shoulders", "Complex Head and Shoulders") from Encyclopedia of Chart Patterns by Thomas N. Bulkowski. Parameters: Alerts - show alert when an arrow appears   Push - send a push notification when an arrow appears (requires configuration in the terminal) PeriodBars - indicator period K - an additional parameter that influences the accuracy of pattern shape recognition. The smaller the value is, the smoother the row of peaks/valleys shoul
Your Trend Friend
Luigi Nunes Labigalini
The trend is your friend! Look at the color of the indicator and trade on that direction. It does not  repaint. After each candle is closed, that's the color of the trend. You can focus on shorter faster trends or major trends, just test what's most suitable for the symbol and timeframe you trade. Simply change the "Length" parameter and the indicator will automatically adapt. You can also change the color, thickness and style of the lines. Download and give it a try! There are big movements
Le niveau Premium est un indicateur unique avec une précision de plus de 80 % des prédictions correctes ! Cet indicateur a été testé par les meilleurs Trading Specialists depuis plus de deux mois ! L'indicateur de l'auteur que vous ne trouverez nulle part ailleurs ! À partir des captures d'écran, vous pouvez constater par vous-même la précision de cet outil ! 1 est idéal pour le trading d'options binaires avec un délai d'expiration de 1 bougie. 2 fonctionne sur toutes les paires de de
To get access to MT4 version please click here . - This is the exact conversion from TradingView: "Stochastic Momentum Index" By "UCSgears". - This is a popular version of stochastic oscillator on tradingview. - This is a light-load processing and non-repaint indicator. - Buffers are available for the lines on chart. - You can message in private chat for further changes you need. Thanks for downloading
You can change the time period of the chart at the touch of a button. You can also change multiple charts at the touch of a button. You can also change multiple charts at the touch of a button,   saving you the trouble of changing time periods. We are live-streaming the actual operation of the system. Please check for yourself if it is usable. Please check it out for yourself. https://www.youtube.com/@ganesha_forex We do not guarantee your investment results. Investments should be made at y
Atomic Analyst MT5
Issam Kassas
3.64 (11)
Tout d'abord, il convient de souligner que cet indicateur de trading n'est ni repainting, ni redrawing et ne présente aucun délai, ce qui le rend idéal à la fois pour le trading manuel et automatisé. L'Analyste Atomique est un indicateur d'action sur les prix PA qui utilise la force et le momentum du prix pour trouver un meilleur avantage sur le marché. Équipé de filtres avancés qui aident à éliminer les bruits et les faux signaux, et à augmenter le potentiel de trading. En utilisant plusieur
Trend Monitor MT5
Pavel Zamoshnikov
3.67 (3)
The indicator generates early signals basing on ADX reading data combined with elements of price patterns. Works on all symbols and timeframes. The indicator does not redraw its signals. You see the same things on history and in real time. For better visual perception signals are displayed as arrows (in order not to overload the chart). Features The best results are obtained when the indicator works on two timeframes. For example: M30 – the indicator shows the main trend; M5 – the indicator ge
Awesome Oscillator by Bill Williams with the ability to fine-tune and replace the averaging algorithms of the indicator, which significantly expands the possibilities of using this oscillator in algorithmic trading and brings it closer in its properties to such an indicator as the MACD. To reduce price noise, the final indicator is processed with an additional Smooth averaging. The indicator has the ability to give alerts, send mail messages and push signals when the direction of movement of th
Cumulative delta indicator As most traders believe, the price moves under the pressure of market buying or selling. When someone redeems an offer standing in the cup, the deal is a "buy". If someone pours into the bid standing in the cup - the deal goes with the direction of "sale". The delta is the difference between purchases and sales. A cumulative delta - the difference between the cumulative sum of purchases and sales for a certain period of time. It allows you to see who is currently contr
Accelerator Oscillator by Bill Williams   with the ability to fine-tune and replace the averaging algorithms of the indicator, which significantly expands the possibilities of using this oscillator in algorithmic trading and brings it closer in its properties to such an indicator as MACD. To reduce price noise, the final indicator is processed with an additional Smooth averaging.  The indicator has the ability to give alerts, send mail messages and push signals when the direction of movement
Indicator and Expert Adviser  EA Available in the comments section of this product. Download with Indicator must have indicator installed for EA to work. Mt5 indicator alerts for bollinger band and envelope extremes occurring at the same time. Buy signal alerts occur when A bullish candle has formed below both the lower bollinger band and the lower envelope  Bar must open and close below both these indicators. Sell signal occur when A bear bar is formed above the upper bollinger band and upp
Introducing the Power Trade Plus indicator designed by a small group of traders with a few years of experience trading the market profitably.  The Power Trade Plus is derived from the Power Trade indicator,  the indicator strive in powerful sniper entries and take profit levels,  with an algorithm that's can determine the markets volatility and Provides entries based on the current market volatility. This indicator is much more effective in stock ,currencies and indices.
HMA Trend Professional MT5
Pavel Zamoshnikov
4.4 (5)
Improved version of the free HMA Trend indicator (for MetaTrader 4) with statistical analysis. HMA Trend is a trend indicator based on the Hull Moving Average (HMA) with two periods. HMA with a slow period identifies the trend, while HMA with a fast period determines the short-term movements and signals in the trend direction. The main differences from the free version: Ability to predict the probability of a trend reversal using analysis of history data. Plotting statistical charts for analyz
Are you tired of the uncertainty that arises when your orders fail to stop at a specific line due to the spread? Look no further! Introducing our  indicator that plots candlesticks based on the Ask price instead of the traditional bid-based chart commonly used in MQL4. With this indicator, you can say goodbye to the frustrations caused by the bid-based chart, as it provides you with a more accurate representation of market movements. By utilizing the Ask price, which represents the price at whic
LT Rainbow Trend
Thiago Duarte
5 (1)
Do you, like me, like to trade with the trend? Then this indicator will help you! Rainbow Trend is a trend indicator, which uses several Moving Averages on the chart. It measures different trend strenght zones for different periods: very long term, long term, mid term, short term and very short term. Each zone has its color, and it is possible to have sound alert when the prices leaves a zone and enters another. Its configuration is very simple. If you find any bug or have any suggestions, co
Les acheteurs de ce produit ont également acheté
Tout d'abord, il convient de souligner que ce système de trading est un indicateur non repeint, non redessiné et non retardé, ce qui le rend idéal pour le trading manuel et automatisé. Le "Système de Trading Smart Trend MT5" est une solution de trading complète conçue pour les traders débutants et expérimentés. Il combine plus de 10 indicateurs premium et propose plus de 7 stratégies de trading robustes, ce qui en fait un choix polyvalent pour différentes conditions de marché. Stratégie de suivi
Quantum Trend Sniper
Bogdan Ion Puscasu
5 (37)
Présentation       Quantum Trend Sniper Indicator   , l'indicateur révolutionnaire MQL5 qui transforme la façon dont vous identifiez et négociez les inversions de tendance ! Développé par une équipe de traders expérimentés avec une expérience commerciale de plus de 13 ans,       Indicateur Quantum Trend Sniper       est conçu pour propulser votre parcours de trading vers de nouveaux sommets grâce à sa manière innovante d'identifier les inversions de tendance avec une précision extrêmement élevée
Trend Screener Pro MT5
STE S.S.COMPANY
4.89 (61)
Indicateur de tendance, solution unique révolutionnaire pour le trading et le filtrage des tendances avec toutes les fonctionnalités de tendance importantes intégrées dans un seul outil ! Il s'agit d'un indicateur multi-période et multi-devises 100 % non repeint qui peut être utilisé sur tous les symboles/instruments : forex, matières premières, crypto-monnaies, indices et actions. Trend Screener est un indicateur de suivi de tendance efficace qui fournit des signaux de tendance fléchés avec des
FX Volume MT5
Daniel Stein
4.94 (17)
Obtenez votre mise à jour quotidienne du marché avec des détails et des captures d'écran via notre Morning Briefing ici sur mql5 et sur Telegram ! FX Volume est le PREMIER et SEUL indicateur de volume qui fournit un VRAI aperçu du sentiment du marché du point de vue d'un courtier. Il fournit des informations impressionnantes sur la façon dont les acteurs institutionnels du marché, comme les courtiers, sont positionnés sur le marché des changes, bien plus rapidement que les rapports COT. Voir c
FX Power MT5 NG
Daniel Stein
5 (4)
Obtenez votre mise à jour quotidienne du marché avec des détails et des captures d'écran via notre Morning Briefing ici sur mql5 et sur Telegram ! FX Power MT5 NG est la nouvelle génération de notre très populaire indicateur de force des devises, FX Power. Et qu'est-ce que ce compteur de force de nouvelle génération offre ? Tout ce que vous avez aimé de l'original FX Power PLUS Analyse de la force de l'OR/XAU Des résultats de calcul encore plus précis Périodes d'analyse configurables individuel
Tout d'abord, il convient de souligner que cet outil de trading est un indicateur non repeint, non redessiné et non retardé, ce qui le rend idéal pour le trading professionnel. L'indicateur Smart Price Action Concepts est un outil très puissant à la fois pour les nouveaux et les traders expérimentés. Il regroupe plus de 20 indicateurs utiles en un seul, combinant des idées de trading avancées telles que l'analyse du trader Inner Circle et les stratégies de trading Smart Money Concepts. Cet in
Advanced Supply Demand MT5
Bernhard Schweigert
4.53 (15)
La meilleure solution pour tout commerçant débutant ou expert ! Cet indicateur est un outil de trading unique, de haute qualité et abordable car nous avons intégré un certain nombre de fonctionnalités propriétaires et une nouvelle formule. Avec cette mise à jour, vous pourrez afficher des zones à double horaire. Vous pourrez non seulement afficher un TF plus élevé, mais afficher les deux, le graphique TF, PLUS le TF supérieur : AFFICHAGE DES ZONES NICHÉES. Tous les traders Supply Demand vont ado
RelicusRoad Pro MT5
Relicus LLC
4.81 (21)
Maintenant 147 $ (augmentant à 499 $ après quelques mises à jour) - Comptes illimités (PCS ou Mac) Manuel d'utilisation RelicusRoad + Vidéos de formation + Accès au groupe Discord privé + Statut VIP UNE NOUVELLE FAÇON DE REGARDER LE MARCHÉ RelicusRoad est l'indicateur de trading le plus puissant au monde pour le forex, les contrats à terme, les crypto-monnaies, les actions et les indices, offrant aux traders toutes les informations et tous les outils dont ils ont besoin pour rester renta
XQ Indicator MetaTrader 5
Marzena Maria Szmit
5 (1)
Step into the realm of Forex trading with confidence and precision using XQ, a cutting-edge Forex indicator designed to elevate your trading game to unprecedented heights. Whether you're a seasoned trader or just stepping into the world of currency exchange, XQ Forex Indicator empowers you with the insights and signals needed to make informed trading decisions. The signal conditions are a combination of three indicators, and XQ Forex Indicator only display  medium and long-term trends . The ind
The Volume by Price Indicator for MetaTrader 5 features Volume Profile and Market Profile TPO (Time Price Opportunity). Get valuable insights out of currencies, equities and commodities data. Gain an edge trading financial markets. Volume and TPO histogram bar and line charts. Volume Footprint charts. TPO letter and block marker charts including split structures. Versatile segmentation and compositing methods. Static, dynamic and flexible ranges with relative and/or absolute visualizations. Lay
Présentation       Quantum Breakout PRO   , l'indicateur révolutionnaire MQL5 qui transforme la façon dont vous négociez les zones d'évasion ! Développé par une équipe de traders expérimentés avec une expérience commerciale de plus de 13 ans,       Évasion quantique PRO       est conçu pour propulser votre parcours commercial vers de nouveaux sommets grâce à sa stratégie de zone de discussion innovante et dynamique. Quantum Breakout Indicator vous donnera des flèches de signalisation sur le
Top indicator for MT5   providing accurate signals to enter a trade without repainting! It can be applied to any financial assets:   forex, cryptocurrencies, metals, stocks, indices .  Watch  the video  (6:22) with an example of processing only one signal that paid off the indicator! MT4 version is here It will provide pretty accurate trading signals and tell you when it's best to open a trade and close it. Most traders improve their trading results during the first trading week with the help of
ICT, SMC, SMART MONEY CONCEPTS, SMART MONEY, Smart Money Concept, Support and Resistance, Trend Analysis, Price Action, Market Structure, Order Blocks, BOS/CHoCH,   Breaker Blocks ,  Momentum Shift,   Supply&Demand Zone/Order Blocks , Strong Imbalance,   HH/LL/HL/LH,    Fair Value Gap, FVG,  Premium  &   Discount   Zones, Fibonacci Retracement, OTE, Buy Side Liquidity, Sell Side Liquidity, BSL/SSL Taken, Equal Highs & Lows, MTF Dashboard, Multiple Time Frame, BigBar, HTF OB, HTF Market Structure
AW Trend Predictor MT5
AW Trading Software Limited
4.76 (54)
La combinaison des niveaux de tendance et de panne dans un seul système. Un algorithme d'indicateur avancé filtre le bruit du marché, détermine la tendance, les points d'entrée, ainsi que les niveaux de sortie possibles. Les signaux indicateurs sont enregistrés dans un module statistique, qui vous permet de sélectionner les outils les plus appropriés, montrant l'efficacité de l'historique des signaux. L'indicateur calcule les marques Take Profit et Stop Loss. Manuel et instruction ->   ICI   / v
Auto Order Block with break of structure based on ICT and Smart Money Concepts Futures Break of Structure ( BoS )             Order block ( OB )            Higher time frame Order block / Point of Interest ( POI )    shown on current chart           Fair value Gap ( FVG ) / Imbalance   ,  MTF      ( Multi Time Frame )    Volume Imbalance     ,  MTF          vIMB Gap’s Equal High / Low’s     ,  MTF             EQH / EQL Liquidity               Current Day High / Low           HOD /
Blahtech Supply Demand MT5
Blahtech Limited
4.57 (14)
Was: $299  Now: $99   Supply Demand uses previous price action to identify potential imbalances between buyers and sellers. The key is to identify the better odds zones, not just the untouched ones. Blahtech Supply Demand indicator delivers functionality previously unavailable on any trading platform. This 4-in-1 indicator not only highlights the higher probability zones using a multi-criteria strength engine, but also combines it with multi-timeframe trend analysis, previously confirmed swings
L'indicateur de Carré Gann est un puissant outil d'analyse du marché basé sur l'article "Formule Mathématique pour les Prédictions de Marché" écrit par W.D. Gann. Cet outil utilise des concepts mathématiques et des théories de Gann pour réaliser une analyse précise du marché. Il utilise les carrés de 144, 90, 52 et aussi le carré de 9. De plus, il intègre la méthode du  pour le carré de 9 et sa relation avec les canaux et le modèle en étoile de ce carré. Manuel d'Utilisateur et Application : Ava
TrendMaestro5
Stefano Frisetti
note: this indicator is for METATRADER4, if you want the version for METATRADER5 this is the link:  https://www.mql5.com/it/market/product/108106 TRENDMAESTRO recognizes a new TREND in the bud, he never makes mistakes. The certainty of identifying a new TREND is priceless. DESCRIPTION TRENDMAESTRO identifies a new TREND in the bud, this indicator examines the volatility, volumes and momentum to identify the moment in which there is an explosion of one or more of these data and therefore the mome
Le profit de la structure du marché change à mesure que le prix s'inverse et recule. L'indicateur d'alerte d'inversion de la structure du marché identifie le moment où une tendance ou un mouvement de prix approche de l'épuisement et est prêt à s'inverser. Il vous avertit des changements dans la structure du marché qui se produisent généralement lorsqu'un renversement ou un recul majeur est sur le point de se produire. L'indicateur identifie initialement les cassures et la dynamique des prix,
Trend Line Map Pro MT5
STE S.S.COMPANY
4.67 (9)
Trend Line Map indicator is an addons for   Trend Screener Indicator . It's working as a scanner for all signals generated by Trend screener ( Trend Line Signals ) . It's a Trend Line Scanner based on Trend Screener Indicator.  If you don't have Trend Screener Pro Indicator,   the Trend Line Map Pro will not work.     LIMITED TIME OFFER : Trend Line Map Indicator is available for only 50 $ and lifetime. ( Original price 125$ ) By accessing to our MQL5 Blog,  you can find all our premium indica
TrendLine PRO MT5
Evgenii Aksenov
4.78 (49)
The Trend Line PRO indicator is an independent trading strategy. It shows the trend change, the entry point to the transaction, as well as automatically calculates three levels of Take Profit and Stop Loss protection Trend Line PRO is perfect for all Meta Trader symbols: currencies, metals, cryptocurrencies, stocks and indices Advantages of Trend Line PRO Never redraws its signals The possibility of using it as an independent strategy It has three automatic levels Take Profit and Stop Loss lev
TPSpro TRENDPRO  - is a trend indicator that automatically analyzes the market and provides information about the trend and each of its changes, as well as giving signals for entering trades without redrawing! The indicator uses each candle, analyzing them separately. referring to different impulses - up or down impulse. Exact entry points into transactions for currencies, crypto, metals, stocks, indices!  -  Version MT4                  DETAILED DESCRIPTION        /       TRADING SETUPS       
Gartley Hunter Multi
Siarhei Vashchylka
5 (5)
Gartley Hunter Multi - An indicator for searching for harmonic patterns simultaneously on dozens of trading instruments and on all classic timeframes: (m1, m5, m15, m30, H1, H4, D1, Wk, Mn). Manual (Be sure to read before purchasing) | Version for MT4 Advantages 1. Patterns: Gartley, Butterfly, Shark, Crab. Bat, Alternate Bat, Deep Crab, Cypher 2. Simultaneous search for patterns on dozens of trading instruments and on all classic timeframes 3. Search for patterns of all possible sizes. Fr
Black Dragon indicator mt5
Ramil Minniakhmetov
4.82 (56)
L'indicateur de détection de tendance complétera n'importe quelle stratégie et peut également être utilisé comme un outil indépendant. IMPORTANT! Contactez-moi immédiatement après l'achat pour obtenir des instructions et un bonus !   Avantages Facile à utiliser; ne surcharge pas le graphique avec des informations inutiles. La possibilité d'utiliser comme filtre pour n'importe quelle stratégie. Contient des niveaux dynamiques de cupport et de resistange, qui peuvent être utilisés à la fois
Golden Spikes Detector
Batsirayi L Marango
5 (1)
Golden Spikes Detector Cet indicateur est basé sur une stratégie avancée principalement pour les pics de trading sur les indices Boom et Crash. Des algorithmes complexes ont été mis en œuvre pour détecter uniquement les entrées à forte probabilité. Il alerte sur les entrées potentielles d’achat et de vente. Pour échanger des pics sur le courtier Deriv ou Binary, prenez uniquement les alertes Buy Boom et Sell Cash. Il a été optimisé pour être chargé sur une période de 5 minutes, bien qu'une analy
Matrix Arrow Indicator MT5
Juvenille Emperor Limited
5 (14)
Matrix Arrow Indicator MT5   est une tendance unique 10 en 1 suivant un indicateur multi-période   100% non repeint   qui peut être utilisé sur tous les symboles/instruments:   forex ,   matières premières ,   crypto-monnaies ,   indices ,  actions .  Matrix Arrow Indicator MT5  déterminera la tendance actuelle à ses débuts, en rassemblant des informations et des données à partir d'un maximum de 10 indicateurs standard, qui sont: Indice de mouvement directionnel moyen (ADX) Indice de canal de m
Smart Peak Bottom
Xiaoyu Huang
5 (2)
Il s'agit d'un indicateur clair pour juger des hauts et des bas, et cela fonctionne bien pour le marché oscillant. Prix promotionnel 49$ → 59$ caractéristiques bon pour juger des hauts et des bas Pas de redessin, pas de dérive Calcul rapide, pas de décalage Mode de rappel riche Plusieurs paramètres et couleurs peuvent être ajustés paramètre "======== Principal ========" HighLowPeriod1 = 9 HighLowPeriod2 = 60 HighLowPeriod3 = 34 HighLowEMAPeriod = 4 MASignalPeriod = 5 "======== Notifier ==
IX Power MT5
Daniel Stein
5 (2)
IX Power   apporte enfin la précision imbattable de FX Power aux symboles non-Forex. Il détermine avec précision l'intensité des tendances à court, moyen et long terme de vos indices, actions, matières premières, ETF et même crypto-monnaies préférés. Vous pouvez   analyser tout ce que   votre terminal a à offrir. Essayez-le et découvrez comment   votre timing s'améliore considérablement   lors de vos transactions. Caractéristiques principales d'IX Power Résultats de calcul précis à 100 %,
Account Graph MT5
Kyra Nickaline Watson-gordon
5 (1)
An indicator to draw a graph of account current and historical state such as Balance, Equity, Margin, Free Margin, Margin Level, Drawdown, Account Profit, Deposit and Withdrawals. Indicator Inputs : Draw Balance Graph Draw Equity Graph Draw Margin Graph Draw Free Margin Graph Draw Margin Level Graph Draw Drawdown Graph Draw Account Profit Graph Hide Data on Chart and Buffers Connect Gaps by Lines Sign of DDs on Profit Sign of DDs on Loss Tips : The Indicator will draw historical balance gra
Golden Gate Algo MT5
James David Lane
4 (6)
40% DE RÉDUCTION POUR NOËL ! AUGMENTATION DES PRIX À 250 $ LE 1er JANVIER ! Présentation de GoldenGate Entries : une solution de trading de pointe ! Découvrez une approche révolutionnaire du trading avec GoldenGate Entries (GGE), un indicateur avancé conçu pour améliorer votre expérience de trading. GGE offre un ensemble complet de fonctionnalités pour donner aux utilisateurs la précision et la confiance nécessaires dans leurs décisions de trading. Paires : Toutes (FX - Matières premières
Plus de l'auteur
Cet indicateur montre la force relative de huit principales devises (USD, EUR, GBP, AUD, NZD, CAD, CHF, JPY). Les valeurs de force sont normalisées dans la plage de 0 à 100. Une valeur supérieure à 60 signifie fort. Un nombre inférieur à 40 indique une faiblesse. Vous pouvez essayer notre guide gratuit (Pair Power Index) avant d’acheter. Le conseiller propose une valorisation de 28 paires, un trading manuel, un trading en réseau automatisé, une gestion des ordres avec trailing stop et une protec
OrderManager Pro
Ziheng Zhuang
4.25 (8)
This Expert Advisor is designed to manage orders. It offers the following functions: Set a stop loss for an order having none. Set a take profit for an order having none. Close the last order if the total orders of a symbol are over the setting. Close the order if its lots are over the setting. Close the order if its profit in pips is over the setting. Close the order if its loss in pips is over the setting. Close the order if its profit in amount is over the setting. Close the order if its loss
FREE
montre. Ce conseil concerne uniquement la couverture de compte. Version MetaTrader 4       Quick Panel Pro caractéristiques Les calculs par lots sont rapides et faciles. Lorsque vous déplacez la ligne d'arrêt, les calculs s'effectuent immédiatement. La plupart des transactions commerciales peuvent être effectuées rapidement en cliquant simplement sur ce panneau. Vous pouvez rapidement basculer entre les panneaux en cliquant simplement sur les boutons verts. EA peut être exécuté dans Strateg
Slippage Monitor
Ziheng Zhuang
5 (2)
This EA is designed to monitor the slippage of opening and closing orders, and save the records in files. It is useful to record the slippage and evaluate brokers. The record files are saved in the folder  MT4_Data_Folder\MQL4\Files.  Go to "File " --> "Open Data Folder" . Warning : Do NOT open the files directly, otherwise it will affect the exectution of EA, just copy them to another folder and open them. Usage: Open a chart and load the EA on it, just need only one EA to run, it monitors a
FREE
Slippage Monitor MT5
Ziheng Zhuang
4.8 (5)
This EA is designed to monitor the slippage of opening and closing orders, and save the records in csv file. It is useful to record the slippage and evaluate brokers. The record files are saved in the folder  MT5_Data_Folder\MQL5\Files.  Go to   "File " --> "Open Data Folder"   . Warning :   Do NOT open the files directly, otherwise it will affect the exectution of EA, just copy them to another folder and open them. Usage: Open a chart and load the EA on it, just need only one EA to run, it m
FREE
Cette EA a les caractéristiques : Il fournit une puissance de paire triée de       les 28 paires majeures   ,           Facilite le trading pour choisir les paires les plus fortes ou les plus faibles. La puissance de la paire est calculée avec l'indicateur       Force relative de la devise   qui est construite dans EA, les entrées par défaut sont D1,90,0 Il peut échanger n’importe quel symbole ou paire, sans se limiter aux 28 principales paires de devises. Il comprend 6 balises :       PPI, comm
FREE
Account Summary MT5
Ziheng Zhuang
4.67 (3)
This is a MetaTrader 5 script. It helps to summarize all trades into every symbol. Input Select Period: This is 7-option input. It includes Last Month, This Month, Last Week, This Week, Today, All History, and Date Specified. Specify Starting Date: Enter a date if you selected Date Specified in "Select Period" input. Specify Ending Date: Enter a date if you selected Date Specified in "Select Period" input. The summary is saved into a file in MQL5\Files folder. MT4 Version:   https://www.mql5.c
FREE
Account Summary
Ziheng Zhuang
5 (1)
This is a MetaTrader 4 script. It helps to summarize all trades into every symbol. Input Select Period: This is 7-option input. It includes Last Month, This Month, Last Week, This Week, Today, All History, and Date Specified. Specify Starting Date: Enter a date if you selected Date Specified in "Select Period" input. Specify Ending Date: Enter a date if you selected Date Specified in "Select Period" input. The summary is saved into a file in MQL4\Files folder. Also, there is pop-up window for
FREE
Account Export
Ziheng Zhuang
5 (2)
This is a MetaTrader 4 script. It helps to export all trades into a CSV file as per Symbol and selected periods. Input Select Symbol: This is 2-option input. Select current symbol or all symbols to export its orders. Select Period: This is 7-option input. It includes Last Month, This Month, Last Week, This Week, Today, All History, and Date Specified. Specify Starting Date: Enter a date if you selected Date Specified in "Select Period" input. Specify Ending Date: Enter a date if you selected D
FREE
Ce conseiller offre les fonctionnalités suivantes : Position ouverte : ouvrez un ordre long ou court lorsque le prix franchit la ligne de tendance. Liquidation : Liquidez les positions longues ou courtes lorsque le prix franchit la ligne de tendance. Trailing Stop Loss – L'EA suit la ligne de tendance et continue d'augmenter le stop loss pour les ordres à long terme ou de réduire le stop loss pour les ordres à court terme. La ligne peut être une ligne de tendance ou une ligne horizontale.      
The indicator includes two parts. Part I: Color Candles Show the Major Trend Color candles is to identify the market state by color candlesticks. As shown in the screenshots, if the color is Aqua, the market is in a state when you should place long orders or exit short orders. If the color is Tomato, it is the time to place short orders or exit long orders. If the color is changing, it is better to wait for its completion (until the current bar is closed). Part II: Draw bands The inner bands is
Ce panel est composé de conseillers experts et propose six groupes de panels de trading. Version MT5 :   cache panneau rapide caractéristiques La plupart des opérations de trading peuvent être effectuées rapidement en cliquant sur les boutons de ce panneau. Changer de panneau est aussi simple que de cliquer sur le bouton vert. EA peut être exécuté sur les graphiques visuels de Strategy Tester et fournit un moyen simple de s'entraîner au trading sur la base de données historiques. Affichez le p
Quick Panel Pro
Ziheng Zhuang
5 (1)
Cet EA est un outil de trading professionnel qui intègre une gestion flexible des risques et 6 ensembles de panneaux de trading. Version MT5 :  Quick Panel Pro Hedging caractéristiques Les calculs par lots sont rapides et faciles. Lorsque vous déplacez la ligne d'arrêt, les calculs s'effectuent immédiatement. La plupart des transactions commerciales peuvent être effectuées rapidement en cliquant simplement sur ce panneau. Vous pouvez rapidement basculer entre les panneaux en cliquant simplement
This indicator shows the main trend on the current chart. Features This indicator includes two bands, one is the inner white bands, another is the outer blue bands. If the white dotted line crosses down the white solid line, this means that the trend has changed to be bearish. If the white dotted line crosses up the white solid line, this means that the trend has changed to be bullish. Once the crossing happened, it will not repaint. Settings ShowColorCandle: if 'true', it will show the colo
This indicator shows main trend, entry zone and exit zone. This is a muti-timeframe indicator, so it is always repainting in the current period of the higher timeframe. Features Colorful Histogram: it indicates the main trend, the tomato means the market is bearish,and the sky blue means the market is bullish. Inner Blue Bands: it is entry zone for entry market, the market is relatively safe for entry. Outer Yellow Bands: it is exit zone for exit market, the market is oversold or overbought.
This indicator shows the relative strength of 8 major currencies: USD, EUR, GBP, AUD, NZD, CAD, CHF and JPY. The strength value is normalized to the range 0-100: The value above 60 means strong. The value below 40 means weak. Note: This indicator does not show strength lines, it just shows the digital result on chart. Another version with strength lines: Currency Relative Strength Inputs BarsToCalculate - Number of bars to calculate strength. MaPeriodsToSmoothLines - Moving Average periods f
Ce conseiller est un tableau de bord qui vous permet de trader plusieurs paires en un seul clic. Cliquez sur       ouvrir       Ce bouton ouvre une commande pour la paire sélectionnée. Cliquez sur       fermer       Ce bouton ferme la commande pour la paire sélectionnée. Le lot de commande est le numéro saisi par l'utilisateur. Les nombres positifs correspondent aux ordres d’achat, tandis que les nombres négatifs correspondent aux ordres de vente. Cliquez sur   le bouton Fermer   pour fermer la
This indcator shows the trend with the color histogram. It is simple and easy to use. Usage: If the histogram changes from the aqua to the fuchsia, which means the trend is up. If the histogram changes from the fuchsia to the aqua,which means the trend is down. Inputs: MaPeriods: the periods of moving average. f1: the multiplier of inner bands f2: the multiplier of outer bands Popup Window Alert Email Alert Mobile Push Alert Alerts When the trend changes from the long trend to the short trend or
Pair Power Matrix
Ziheng Zhuang
3.67 (3)
This indicator is designed to show the pair power of the major 28 paris with RSI,Stochostic,and CCI. The power value is sorted from the weak to the strong. The weaker pairs: the pairs occurs at least 2 times in the top 3 rows The stronger pairs:   the pairs occurs at least 2 times in the bottom 3 rows Users can add another symbol, so it can calculate 28+1 symbols. My advice: https://www.mql5.com/en/blogs/post/729880 A free EA with Pair Power Matrix  ---  https://www.mql5.com/en/blogs/post/732
The purpose of the inidcator is to identify the reversal point. The blue arrow is buy signal and the yellow star is its stop loss. The red arrow is sell signal and the yellow star is its stop loss. Alert feature: if there is a signal, the indicator will send alerts of  popup window,email or mobile push. Inputs: Popup Window Alert: it is false in default Email Alert : it is false in default Mobile Push Alert: it is false in default. MetaTrader 5 Version: Reversal Point Please note that the singa
Note: This EA only works on Hedging account. The MetaTrader 4 version Quick Panel This Panel is an Expert Advisor, which provides six groups of trading panel. Features Most trading operations can be quickly made by clicking the button on these panels. Changing panels is quick just by clicking the green button. The EA can run on visual chart on the strategy tester, which provides an easy method to practice trading on history data. Show the average price on a yellow-background panel and draw th
Gamma Bands   This indcator shows the trend with the color histogram. It is simple and easy to use. Usage: If the histogram changes from the aqua to the fuchsia, which means the trend is up. If the histogram changes from the fuchsia to the aqua,which means the trend is down. Inputs: MaPeriods: the periods of moving average. f1: the multiplier of inner bands f2: the multiplier of outer bands   Popup Window Alert Email Alert Mobile Push Alert Alerts When the trend changes for the long trend to the
The purpose of the inidcator is to identify the reversal point. The blue arrow is buy signal and the yellow star is its stop loss. The red arrow is sell signal and the yellow star is its stop loss. Please note that the singal is against trend,it could be continual fail. Alert feature: if there is a signal, the indicator will send alerts of  popup window,email or mobile push. Inputs: Popup Window Alert: it is false in default Email Alert : it is false in default Mobile Push Alert: it is false in
Ce conseiller offre les fonctionnalités suivantes : Position ouverte : ouvrez un ordre long ou court lorsque le prix franchit la ligne de tendance. Liquidation : Liquidez les positions longues ou courtes lorsque le prix franchit la ligne de tendance. Trailing Stop Loss – L'EA suit la ligne de tendance et continue d'augmenter le stop loss pour les ordres à long terme ou de réduire le stop loss pour les ordres à court terme. La ligne peut être une ligne de tendance ou une ligne horizontale.      
Filtrer:
Edgar Duttweiler
639
Edgar Duttweiler 2018.08.21 14:47 
 

For my strategy a great EA-indicator !!!!

Répondre à l'avis
Version 4.20 2020.03.23
Nothing changed. Recompile with the latest compiler as request from MQL5 community.
This version will increase the performance.
Version 4.10 2016.10.18
The old v4.0 has a repaint bug,this repaint bug is also found in the MT4 indicator.
MT4 indicator has been modified, the MT5 indicator also need to be modified.
The new v 4.1 has no repaint bug.
Sorry for this trouble.
Version 4.0 2016.10.05
Add a bands to this indicator.
Now the new version 4.0 is the same as my MT4 indicator. https://www.mql5.com/en/market/product/10455
Thank you!
Version 3.0 2015.07.06
Added alert and email function