Alım-satım robotlarını ücretsiz olarak nasıl indirebileceğinizi izleyin
Bizi Telegram üzerinde bulun!
Fan sayfamıza katılın
Fan sayfamıza katılın
Komut dosyasını ilginç mi buldunuz?
Öyleyse bir link gönderin -
başkalarının da faydalanmasını sağlayın
Öyleyse bir link gönderin -
başkalarının da faydalanmasını sağlayın
Komut dosyasını beğendiniz mi? MetaTrader 5 terminalinde deneyin
- Görüntülemeler:
- 12064
- Derecelendirme:
- Yayınlandı:
- Güncellendi:
-
Bu koda dayalı bir robota veya göstergeye mi ihtiyacınız var? Freelance üzerinden sipariş edin Freelance'e git
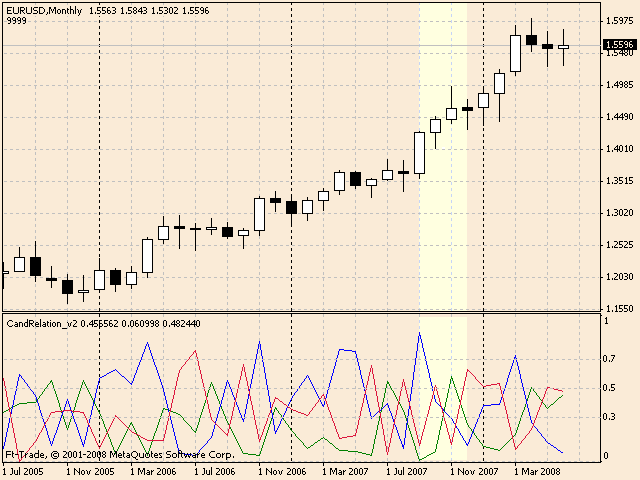
The blue line - a part of the total length of the candle
The green line - a part of the upper shadow of the candle length
The red line - a part of the lower shadow of the candle
The future correlations between these lines, if the corresponding figures of japanese analysis are used, are represented on the pointed region.

MetaQuotes Ltd tarafından Rusçadan çevrilmiştir.
Orijinal kod: https://www.mql5.com/ru/code/8209
 TrendLineRange
The indicator informs about that the price is approaching to support/resistance line in 3 positions.
 Waddah Attar Win Expert
Sell when Up >>> Buy when Down
 gpfTCPivotLimit
A TS based on the kickback from intraday levels calculated by indicator Pivot is implemented.
 The MasterMind 2 (Version2.0)
10K Flipped to 666K Under 3 Months, 60.04 Profit Factor...Have Fun! Code Pushes 3 Lots(Maximum) at a Time.