 MetaTrader 5
 Uzmanlar
 Göstergeler
 Komut dosyaları
 Kütüphaneler
 Depo
Alım-satım robotlarını ücretsiz olarak nasıl indirebileceğinizi izleyin
Bizi Facebook üzerinde bulun!
Fan sayfamıza katılın
Fan sayfamıza katılın
Kodu beğendiniz mi? MetaTrader 5 terminalinde deneyin

RSI DeMarker Super Position - MetaTrader 4 için gösterge

- Görüntülemeler:
- 41091
- Derecelendirme:
- Yayınlandı:
- Güncellendi:
-
 Alım-satım fırsatlarını kaçırıyorsunuz:
- Ücretsiz alım-satım uygulamaları
- İşlem kopyalama için 8.000'den fazla sinyal
- Finansal piyasaları keşfetmek için ekonomik haberler
Kayıt Giriş yapWeb sitesi politikasını ve kullanım şartlarını kabul edersiniz
Hesabınız yoksa, lütfen kaydolun -
 Bu koda dayalı bir robota veya göstergeye mi ihtiyacınız var? Freelance üzerinden sipariş edin
Freelance'e git
As a rule it takes a lot of time to switch between periods and indicator parameters for comparing their behavior and detecting a true indicator development dynamics.
The indicator was developed after the working area was filled by a set of standard indicators with different parameters.
What is calculated:
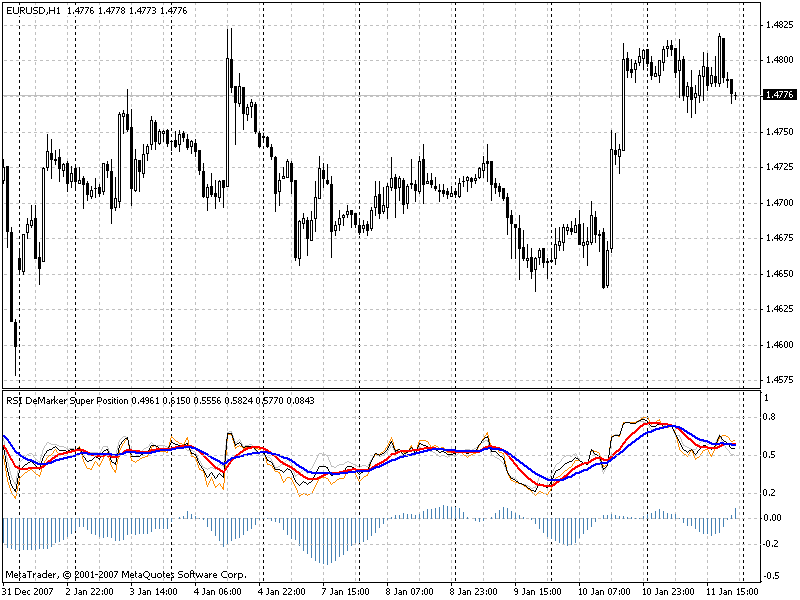
- four RSI lines with different periods (the period change step is specified in the indicator parameters) constitute a weighted average of the indicator upon RSI;
- four DeMarker lines with different periods (the period change step is specified in the indicator parameters) constitute a weighted average of the indicator upon DeMarker;
- because of the difference of RSI and DeMarker dimensions, the values of averages are reduced to a common way of displaying;
- the moving average upon RSI and DeMarker constitute a super position upon two indicators;
- two MA lines are attached to the super position line for an easier interpretation of values;
- for a better visualization, a histogram of difference between RSI and DeMarker weighted averages is shown.
The result is: one indicator contains two values of different periods and different dynamics.
RSI and DeMarker behave differently not only in different situations on a chart, abut also towards themselves with different indicator periods. I think, it is useful to see this difference.
In addition to this, a smoothing of the superposition line can be introduced.
MetaQuotes Ltd tarafından Rusçadan çevrilmiştir.
Orijinal kod: https://www.mql5.com/ru/code/7741
Impulse MACD
Impulse MACD. The method of its construction is not traditional. This indicator is the result of laziness and absence of a working area on a chart.
 Equivolume Bars Builder
Another version.
3_Level_ZZ_Semafor
This indicator places semaphore points on the maximum and minimum of a higher, medium and lower period. Similar to Advanced Get, but without waves numeration.
DeMark Trendline Trader
DeMark Trendline Trader indicator.