Fan sayfamıza katılın

RSI Experiment - MetaTrader 5 için gösterge

- Görüntülemeler:
- 10990
- Derecelendirme:
- Yayınlandı:
-
 Alım-satım fırsatlarını kaçırıyorsunuz:
- Ücretsiz alım-satım uygulamaları
- İşlem kopyalama için 8.000'den fazla sinyal
- Finansal piyasaları keşfetmek için ekonomik haberler
Kayıt Giriş yapWeb sitesi politikasını ve kullanım şartlarını kabul edersiniz
Hesabınız yoksa, lütfen kaydolun -
 Bu koda dayalı bir robota veya göstergeye mi ihtiyacınız var? Freelance üzerinden sipariş edin
Freelance'e git
Bu koda dayalı bir robota veya göstergeye mi ihtiyacınız var? Freelance üzerinden sipariş edin
Freelance'e git
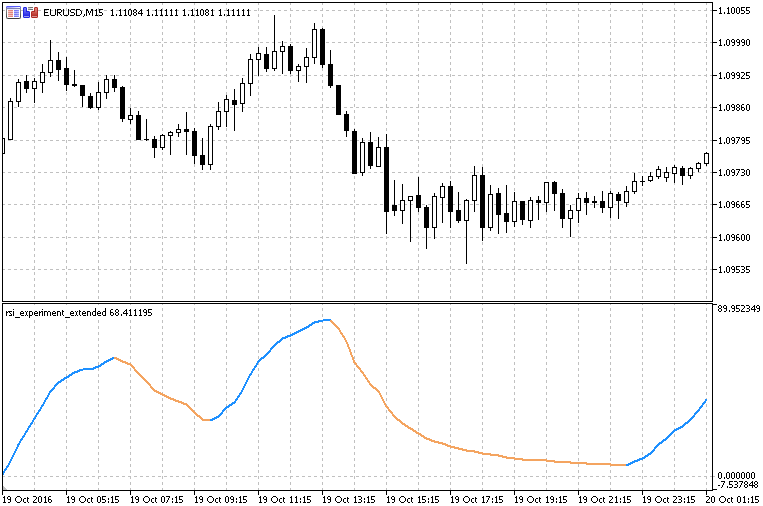
This version of RSI is "experimenting" with different ways how internally the RSI is calculated. Welles Wilder used what is frequentlyy called "Wilders EMA" which is, in fact, exactly the same as smoothe MA (SMMA).
So, in this version, we can chose which one of the 4 basic averages can be used for RSI calculation, and that way we can get 3 completely new types odf RSI.
Additionaly, price can be smoothed prior to RSI calculation in which case we are getting what is usually regered to as RSI of MA (rsioma) and even then we are getting completely new versions of RSI of MA. With this "experiment" — with a simple average type change in the calculation we are having completely new types of rsi / rsioma.
T3 Velocity on Chart
T3 velocity, now on chart version too.
T3 Velocity V.2.0
T3 velocity is a completely new indicator that uses T3 to calculate velocity.
RSI Experiment with Floating Levels
RSI experiment with floating levels.
RSI Exp with Filled Areas
RSI experiment with a simple addition of filled areas when floating levels are crossed.