 MetaTrader 5
 Uzmanlar
 Göstergeler
 Komut dosyaları
 Kütüphaneler
 Depo
Alım-satım robotlarını ücretsiz olarak nasıl indirebileceğinizi izleyin
Bizi Facebook üzerinde bulun!
Fan sayfamıza katılın
Fan sayfamıza katılın
Kodu beğendiniz mi? MetaTrader 5 terminalinde deneyin

Three Line Break - MetaTrader 5 için gösterge

- Görüntülemeler:
- 15912
- Derecelendirme:
- Yayınlandı:
- Güncellendi:
-
 Alım-satım fırsatlarını kaçırıyorsunuz:
- Ücretsiz alım-satım uygulamaları
- İşlem kopyalama için 8.000'den fazla sinyal
- Finansal piyasaları keşfetmek için ekonomik haberler
Kayıt Giriş yapWeb sitesi politikasını ve kullanım şartlarını kabul edersiniz
Hesabınız yoksa, lütfen kaydolun -
 Bu koda dayalı bir robota veya göstergeye mi ihtiyacınız var? Freelance üzerinden sipariş edin
Freelance'e git
The charts of linear reversal represent a series of vertical boxes (lines) which direction and size are determined by dynamics of prices. This type of charts is drawn on close prices and considers neither timeframe, nor volume.
The main advantage is lack of a freely defined reversal value as far as it is signaled by the market behavior. The chart sensitivity of the three linear breakthrough can be regulated by changing number of lines that market should break to design the reversal.
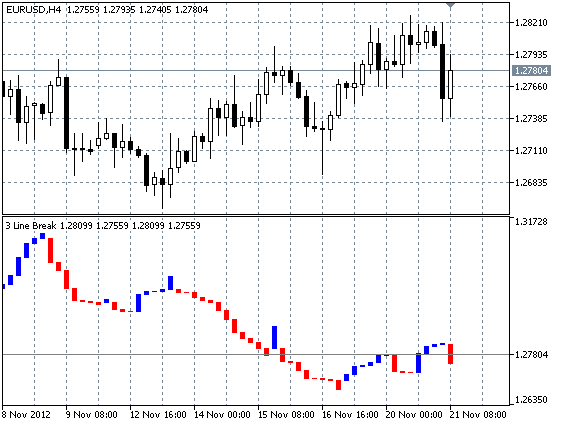
Recommendations:
- The general recommendation is a buy after appearance of a blue box after a series of red boxes, and a sell after appearance of a red box after a series of blue boxes. However, as in many cases, brute force solution of task will be optimal. Therefore, in my opinion it is better to use a linear breakthrough in combination with other instruments and find their own patterns (in TLB charts).
MetaQuotes Ltd tarafından Rusçadan çevrilmiştir.
Orijinal kod: https://www.mql5.com/ru/code/1298
 Exp_ColorNonLagDotMACD
The Exp_ColorNonLagDotMACD Expert Advisor drawn on the basis of the signals taken from the ColorNonLagDotMACD histogram
Exp_AML
Trading system using the AML trend Moving Average
Kagi
The Kagi chart drawn in a separate subwindow
Exp_ColorMETRO
Trading system using the ColorMETRO indicator