Fan sayfamıza katılın
Öyleyse bir link gönderin -
başkalarının da faydalanmasını sağlayın
- Yayınlayan:
- Nikolay Kositsin
- Görüntülemeler:
- 10839
- Derecelendirme:
- Yayınlandı:
- Güncellendi:
-
Bu koda dayalı bir robota veya göstergeye mi ihtiyacınız var? Freelance üzerinden sipariş edin Freelance'e git
Original author:
Evgeniy Gutorov
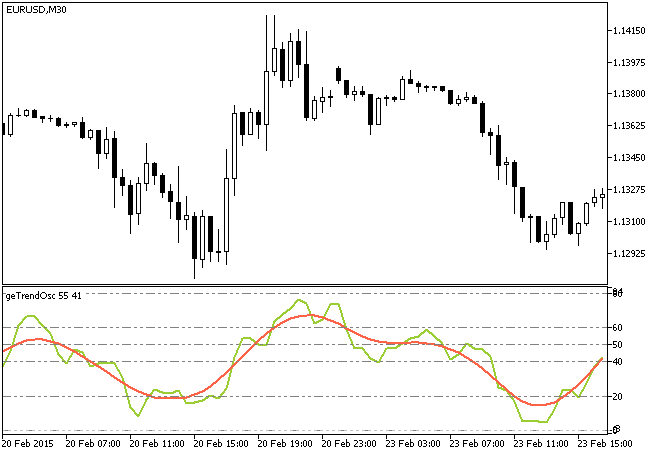
A trend oscillator indicator. The main algorithm for getting the source signals using the formula:
InputSeries[bar] = (Close[bar] - Open[bar]) / (High[bar] - Low[bar])
To calculate the oscillator signal generated by the green line we use the following formula:
Osc=Sum(Period) / Sum(Abs(Period)) * 100
where:
- Sum(Period) - a sum of source signal values for a period;
- Sum(Abs(Period)) - a sum of absolute source signal values for a period.
The red line is the Hodrick-Prescott filter which redraws if the redraw period in the beginning bars is big. For that reason it's better to use the period of 2 to get more reliable results.
Originally this indicator has been written in MQL4 and was first published in the Code Base on 15.08.2009.

Fig. 1 The geTrendOsc trend oscillator
MetaQuotes Ltd tarafından Rusçadan çevrilmiştir.
Orijinal kod: https://www.mql5.com/ru/code/12521
 MAMA_HTF
The MAMA indicator with the timeframe selection option available in the input parameters.
 Notches
The indicator draws lines by ascending series of maximums and descending series of minimums.
 Exp_Ozymandias
Trading system using the Ozymandias indicator.
 Background_FiboCandles_HTF
The indicator draws candlesticks of a larger timeframe as color filled rectangles based on the FiboCandles indicator.