
Patterns available when trading currency baskets. Part III
Introduction
This is the third and most probably the last article on this topic. We have examined and analyzed the main and secondary patterns, as well as their application tactics. The list of our objectives has not included description of complex and ambiguous techniques, like wave analysis or VSA, but I believe, the provided material is already quite sufficient for the initial acquaintance with trading currency pair baskets. In this article, we will try to bring closure to studying the patterns occurring when applying combined oscillators and trend-following indicators. Here we will talk about the combined trend-following indicators.
Basket currency index as a source data
In the comments to one of the previous articles, I have stumbled upon a promising idea: instead of receiving the indicator values for each currency pair of the basket and defining the average value, we should apply the technical indicator equation to the data of the combined indicator — basket currency index. Let me clarify this. For example, we received the values of the WPR standard technical indicator for each currency pair of the basket to calculate the combined WPR data. Using the obtained values, we calculated the arithmetic mean (generally, we can apply the geometric mean as well). This resulted in a combined WPR showing behavior of a single currency — "currency pairs basket".
Here, I propose an alternative method of obtaining the same data. Previously, we have already discussed what the basket currency index is and how to calculate it. As you may remember, it is a geometric mean of all basket pairs' prices, the "cleared price" of the basket currency. So, it is suggested to obtain the combined WPR values by applying the standard WPR calculation equation to the basket currency index chart. Accordingly, in order to obtain the values of the combined RSI or STOCH, you should use their calculation equations. The idea seems to be interesting. Let's check it out. If the assumption is correct, we are to obtain the values of the combined indicators similar to the ones received after using the method described in the previous articles.
For a start, we need two indicators with their codes available in the attached wpr.zip file:
- testWPR provided in one of the previous article. Use the set of currency pairs for the USD basket: EURUSD, GBPUSD, AUDUSD, NZDUSD, USDCAD, USDCHF and USDJPY. We will use it as a reference for comparison.
- WPR technical indicator code. It can be found in the CodeBase. We use its fragments in the new indicator to illustrate the method we are interested in.
We obtain the following test indicator as a result:
//+------------------------------------------------------------------+
//|                                                testIndex+WPR.mq5 |
//|                                   2016 MetaQuotes Software Corp. |
//|                                             https://www.mql5.com |
//+------------------------------------------------------------------+
#property copyright "Copyright 2016, MetaQuotes Software Corp."
#property link      "https://www.mql5.com"
#property version   "1.00"
#property indicator_separate_window

#property indicator_buffers 2
#property indicator_plots   1


input color   clrWPR = clrGreen;
input int wprperiod  = 14;

double ind[],ma[];
//+------------------------------------------------------------------+
//| Custom indicator initialization function                         |
//+------------------------------------------------------------------+

int OnInit()
  {
//--- indicator buffers mapping

  IndicatorSetDouble(INDICATOR_MINIMUM,-100);
  IndicatorSetDouble(INDICATOR_MAXIMUM, 0);

   ArraySetAsSeries(ma,true);
   SetIndexBuffer(0,ma);
   PlotIndexSetInteger(0, PLOT_DRAW_TYPE, DRAW_LINE           );
   PlotIndexSetInteger(0, PLOT_LINE_STYLE, STYLE_SOLID            );
   PlotIndexSetInteger(0, PLOT_LINE_WIDTH, 1            );
   PlotIndexSetInteger(0, PLOT_LINE_COLOR, clrWPR            );
   PlotIndexSetString (0, PLOT_LABEL, "_tstdistance_MA" );

   ArraySetAsSeries(ind,true);
   SetIndexBuffer(1,ind , INDICATOR_CALCULATIONS);
//---
   return(INIT_SUCCEEDED);
  }

string pair[]={"EURUSD","GBPUSD","AUDUSD","NZDUSD","USDCAD","USDCHF","USDJPY"};
bool bDirect[]={false,false,false,false,true,true,true};
int iCount=7;

//Calc. index
double GetIndex(int shift)
  {
   double res=1.0,t;
   double dBuf[1];
   for(int i=0; i<iCount; i++)
     {
      t=CopyClose(pair[i],PERIOD_CURRENT,shift,1,dBuf);
      if(!bDirect[i]) dBuf[0]=1/dBuf[0];
      res*=dBuf[0];
     }//end for (int i = 0; i < iCount; i++)
   return (NormalizeDouble(MathPow (res, 1/(double)iCount), _Digits) );
  }
//+------------------------------------------------------------------+
//| Custom indicator iteration function                              |
//+------------------------------------------------------------------+
double HH,LL;

int OnCalculate(const int rates_total,
                const int prev_calculated,
                const datetime &time[],
                const double &open[],
                const double &high[],
                const double &low[],
                const double &close[],
                const long &tick_volume[],
                const long &volume[],
                const int &spread[])
  {

   if(prev_calculated==0 || rates_total>prev_calculated+1)
     {
      int rt=rates_total;
      for(int i=1; i<rt; i++)
        {
         ind[i]= GetIndex(i);
        }
      rt -= wprperiod;
      for (int i = 1; i< rt; i++)
        {
         ma[i] = GetMA(ind, i, wprperiod, _Digits);
        }
     }
   else
     {
         ind[0] = GetIndex(0);
         ma[0]  = GetMA(ind, 0, wprperiod, _Digits);
     }
   return(rates_total);
  }

//Calc. WPR
double GetMA(const double& arr[], int index , int period, int digit) {
   double m = 0;
   HH = arr[ArrayMaximum(arr, index, period)];
   LL = arr[ArrayMinimum(arr, index, period)];
   m = -100 * (HH - arr[index]) / (HH - LL);
   return (NormalizeDouble((m + 50) * 2, _Digits));
}
Let's apply it to EURUSD pair together with the testWPRusd reference indicator. The result is as follows:
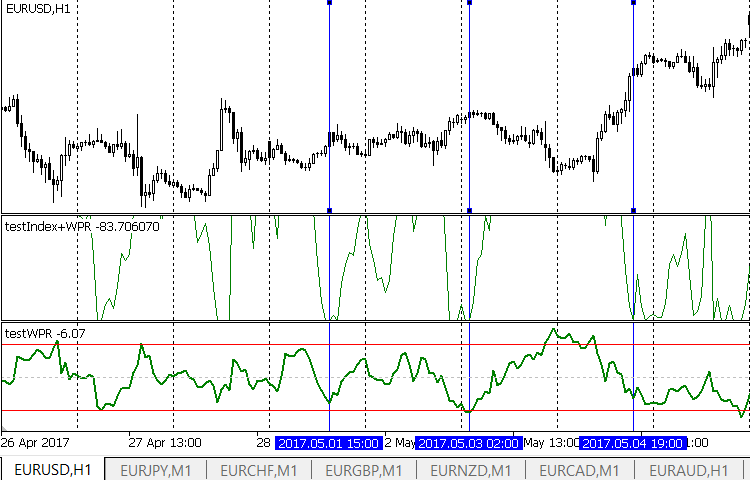
The first subwindow displays the curve of our test indicator, while the second one — the curve of the reference indicator. The result is unexpectedly disappointing. Anyway, we have to analyze the obtained results. It quickly becomes obvious that the test indicator is not suitable for work. It constantly reaches the maximum possible values. At the same time, nothing special happens on the market, and the price moves calmly. As a consequence, the gradients of the indicator readings are unreasonably high. Besides, extreme value positions in the test and reference indicators match one another quite well. Why do we get a good match in terms of extremes, but such strange values? The answer is simple. The reason lies in the WPR indicator calculation equation:
R% = - ((H – C)/(H – L)) x 100;
where:
- C: Close price;
- L: Low price for a certain period;
- H: High price for a certain period.
But we do not have values of High and Low prices. The test indicator calculates its values using basket currency index values, while the index in turn is calculated by Close prices. Due to this purely technical reason, we receive test indicator extreme values so frequently. Therefore, we cannot say confidently that the method itself is wrong or highly inaccurate. On the contrary, the match of extreme value positions suggests the opposite. Is it possible to eliminate unexpected obstacles?
Plotting the combined basket currency index indicator as candles
Of course, it is possible. To achieve this, we should obtain the source data (i.e. basket currency index) not as a curve based on Closes but as Japanese candlesticks. In this case, we will get all necessary arrays and will be able to perform both WPR and other calculations. In fact, the currency basket index chart looks similar to a conventional price chart, although this is a chart of a single currency rather than a pair. We may very cautiously assume that this is the price chart of the basket currency relative to all currencies forming the basket.Technically, we can obtain such a chart easily. The conventional "USD index" is often displayed as candles rather than a single Close line. How can a developer obtain a similar result? The already available test indicator performs calculations using the candle close price values on the current timeframe. If we supplement the indicator with exactly the same calculation using the candle Open price of the current timeframe, the developer obtains two values defining the body of the necessary candle. However, there are also bad news. It is impossible to define the Low and High of the basket currency index candle using the same method. If we simply calculate the average or geometric mean of the basket currency pairs candles' Low and High, the resulting value will not provide an accurate value of the basket currency candle's Low and High. The reason is obvious: the Low and High of individual currency pairs within the basket may not necessarily occur at the same time. It is possible of course, but it is by no means guaranteed. Developers may apply this technique at their own risk. They will obtain all the values necessary to plot a candle but the margin of error cannot be estimated beforehand. To get a guaranteed true value, we should still use the calculations by ticks or at least by minutes. Such calculations heavily load the terminal, so it is better to put them into a separate application.
Anyway, we are not going to do anything like that. I will explain the reasons later. In the meantime, we have to conclude that the discussed technique is not suitable for the combined WPR-based indicators as well as for other combined indicators that use Open and Close, as well as Low and High arrays for calculations. For other indicator types, this method is still of interest. We will dwell on that below.
Tools based on the currency basket index
We have already analyzed examples of such an application of the basket curency index in the previous articles. I mean applying the moving average to the basket currency index chart. The moving average is a reliable tool. Its application has provided us a pattern — a crossing point of the moving average with the basket currency index chart. We described it earlier. Let's see what other instruments we can use if we use the basket currency index as a source data. Of course, we cannot cover all available tools due to the article limitations but we still can outline the prospects.
We should remember that the basket currency index chart is a price chart. Let's try to determine whether the main trader tools (support and resistance levels, channels and Fibo levels) are able to work with it. Also, there are a number of articles stating the ability to apply such tools to the indicator charts. Let's try to apply them, too. To do this, we will place two combined indicators of USD and EUR basket currency index (index.zip) and perform some standard arrangements:
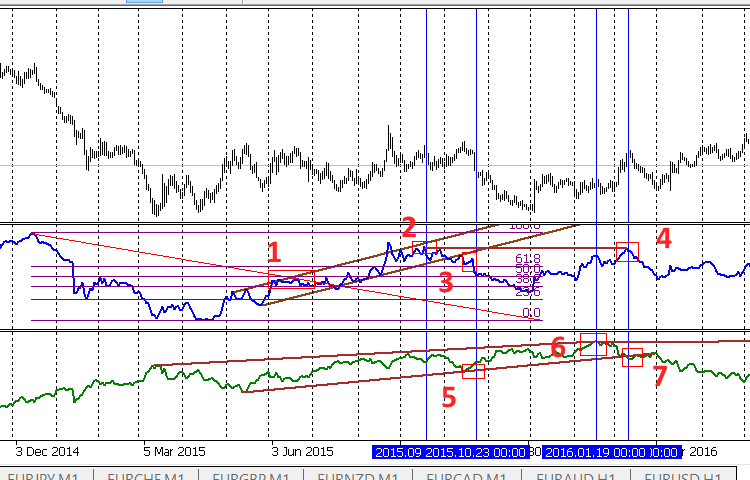
We have placed the standard graphical tools on both charts. This option is not the only possible one, but it is quite real:
- Fibo, ascending channel and horizontal level on EUR
- Two lines forming a wedge and horizontal level on USD
Let's mark interesting points using rectangles and vertical lines and see how EURUSD price behaves near them.
- Roll-back from the upper channel border and Fibo level on EUR index. Nothing special happens to USD — just a slight decrease. We can expect a movement towards the sell area on the main chart, and it actually happens.
- Another roll-back from the EUR channel upper border. We can expect a further movement towards the sell area, but this does not happen since the USD index moves near the wedge's upper border. In fact, there is a flat movement with a slight buy trend.
- However, as the point 2 continues, the EUR index channel is broken downwards combining with the point 5 rolling back from the lower wedge border by USD. There is quite a logical move in the sell direction on the main chart.
- Roll-back from the horizontal EUR level matches the USD index wedge breakout in point 7. In the beginning, the EUR roll-back is more intense and the price goes into sell direction, but then the wedge breakout "outweighs" and the movement changes to a buy.
We can draw some preliminary conclusions. We have considered only a single episode of a complex currency pair here, so our findings should not be perceived as an ultimate truth. To make them more reliable, we should conduct long-term observations on different timeframes and currency pairs. However, the results are somewhat reassuring. We can apply common graphical constructions on the combined indicator chart of the currency pair index. Patterns obtained during such constructions follow the well-known rule:
- Any signal should be confirmed by other signals.
- Handling the obtained patterns by the price is more inertial compared to the standard application.
- Final conclusion. Patterns obtained in this way are of secondary nature. They can be used when searching for entry points and probably when setting stop losses. In other words, the patterns are useful but play a secondary role.
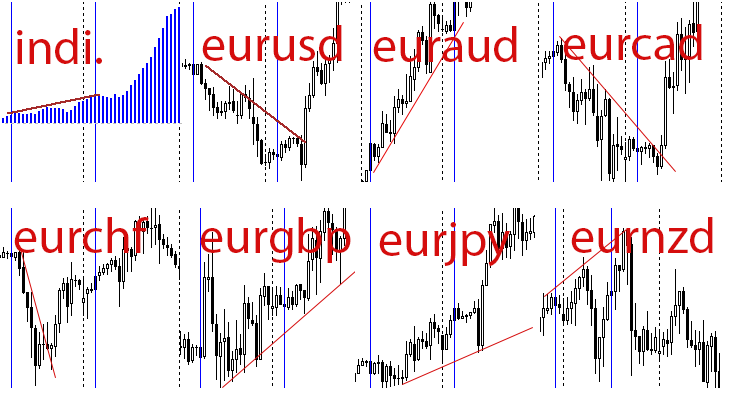
Let's analyze the entire picture from another perspective. As you may remember, the basket currency index shows the state of all currency pairs relative to the currency basket. Therefore, the EUR index chart points are related not only to EURUSD but also to other currency pairs forming the EUR basket. We have drawn conclusions only on one of them. Perhaps, the reason for the "secondary nature" of the obtained patterns is that traders want to get rid of the second currency influence (here it is USD) using currency pair baskets? We can easily check our assumption by analyzing other currency pairs within the basket. For example, let's take the point 2, 2015.09.18 00:00. At this point, we assume the general sell trend after the price rolls back from the channel's upper border, as well as the channel bullish breakthrough afterwards. The point of interest has been found on the EUR index chart, so let's take all currency pairs included into the EUR basket and see what happened to the price at that time:
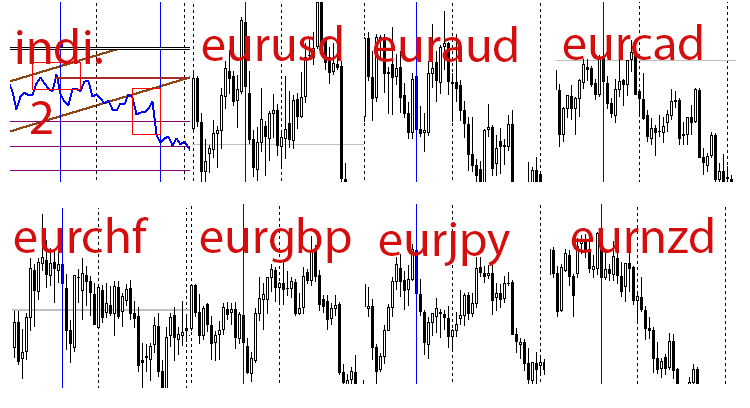
The result is very interesting and encouraging! The time marker we are interested in is highlighted by the blue vertical line. Our forecasts are justified on most pairs. If a trader had entered the market using the current (rather weak) pattern, they would have received a profit. A stop loss on some pairs is possible as well. I mean EURAUD and EURGBP here, as well as (to a lesser extent) EURUSD. On other pairs, the trader would have received a profit. The main principle of working with currency pair baskets has turned out to be correct here: a trader receives an entry signal for the basket currency entering at all pairs forming the basket at once. This ends up in a loss on some pairs and with a profit on the majority of them. We have already described this principle in details in the previous articles of the series. Please keep in mind that all our conclusions are of a probabilistic nature.
Since the analysis of a single point cannot serve as a basis for any assumptions, we do not make the final conclusions. However, the obtained result may inspire a trader to perform an in-depth study involving the arrangement of an experiment, gathering statistics and publishing results.
Going back to the beginning of the article, we can now outline the reasons not to develop a combined indicator of a basket currency index with the candle chart:
- For a single currency pair, the patterns examined are of auxiliary nature.
- This is not the case for all currency pairs of the basket. However, the analysis on history is required.
Simple trend indicator
To confirm our conclusions, let's develop a simple combined indicator working according to the following principle:
- The difference between the two moving averages ("fast" and "slow" ones) is calculated and displayed for the source data array (here it is an array of the EUR basket currency index). As we can easily see, the operation principle is similar to that of the MACD indicator. Let's hope the indicator is able to detect a divergence.
The indicator code (included in testIndexMACD.zip):
//+------------------------------------------------------------------+
//|                                                testIndexMACD.mq5 |
//|                                   2016 MetaQuotes Software Corp. |
//|                                             https://www.mql5.com |
//+------------------------------------------------------------------+
#property copyright "Copyright 2016, MetaQuotes Software Corp."
#property link      "https://www.mql5.com"
#property version   "1.00"
#property indicator_separate_window

#property indicator_buffers 2
#property indicator_plots   1


input color   clr = clrBlue;
input int InpFastEMA = 12;   // Fast EMA Period
input int InpSlowEMA = 26;   // Slow EMA Period

double ind[],ma[];
//+------------------------------------------------------------------+
//| Custom indicator initialization function                         |
//+------------------------------------------------------------------+
//int h,h1;
int OnInit()
  {
//--- indicator buffers mapping
   ArraySetAsSeries(ind,true);
   SetIndexBuffer(0,ind);

   IndicatorSetString(INDICATOR_SHORTNAME,"testIndexMACD");
   IndicatorSetInteger(INDICATOR_DIGITS,2);
   PlotIndexSetInteger(0,PLOT_DRAW_TYPE,DRAW_HISTOGRAM/*DRAW_LINE*/);
   PlotIndexSetInteger(0,PLOT_LINE_STYLE,STYLE_SOLID);
   PlotIndexSetInteger(0,PLOT_LINE_WIDTH,2);
   PlotIndexSetInteger(0,PLOT_LINE_COLOR,clr);
   PlotIndexSetString(0,PLOT_LABEL,"_tstMACD_");


   ArraySetAsSeries(ma,true);
   SetIndexBuffer(1,ma , INDICATOR_CALCULATIONS);

//---
   return(INIT_SUCCEEDED);
  }

string pair[]={"EURUSD","EURJPY","EURCHF","EURGBP","EURNZD","EURCAD","EURAUD"};
bool bDirect[]={true,true,true,true,true,true,true};
int iCount=7;

double GetValue(int shift)
  {
   double res=1.0,d;
   double dBuf[1];
   for(int i=0; i<iCount; i++)
     {
      d=CopyClose(pair[i],PERIOD_CURRENT,shift,1,dBuf);
      if(!bDirect[i]) dBuf[0]=1/dBuf[0];
      res*=dBuf[0];
     }//end for (int i = 0; i < iCount; i++)
   return (NormalizeDouble(MathPow (res, 1/(double)iCount), _Digits) );
  }
//+------------------------------------------------------------------+
//| Custom indicator iteration function                              |
//+------------------------------------------------------------------+
double t;
int OnCalculate(const int rates_total,
                const int prev_calculated,
                const datetime &time[],
                const double &open[],
                const double &high[],
                const double &low[],
                const double &close[],
                const long &tick_volume[],
                const long &volume[],
                const int &spread[])
  {
   if(prev_calculated==0 || rates_total>prev_calculated+1)
     {
      int rt=rates_total;
      for(int i=1; i<rt; i++)
        {
         ma[i]= GetValue(i);
        }
      rt=rates_total - InpSlowEMA;
      for(int i=1; i<rt; i++)
        {
         ind[i] = GetMA(ma, i, InpFastEMA, _Digits) - GetMA(ma, i, InpSlowEMA, _Digits);
        }
     }
   else
     {
         ma[0]= GetValue(0);
         ind[0] = GetMA(ma, 0, InpFastEMA, _Digits) - GetMA(ma, 0, InpSlowEMA, _Digits);
     }
//--- return value of prev_calculated for next call
   return(rates_total);
  }

//+------------------------------------------------------------------+

double GetMA(const double& arr[], int index , int period, int digit) {
   double m = 0;
   for (int j = 0; j < period; j++)  m += arr[index + j];
   m /= period;
   return (NormalizeDouble(m,digit));
}
By placing the indicator on the chart, we will see the following when using the combined EUR index as a source one:
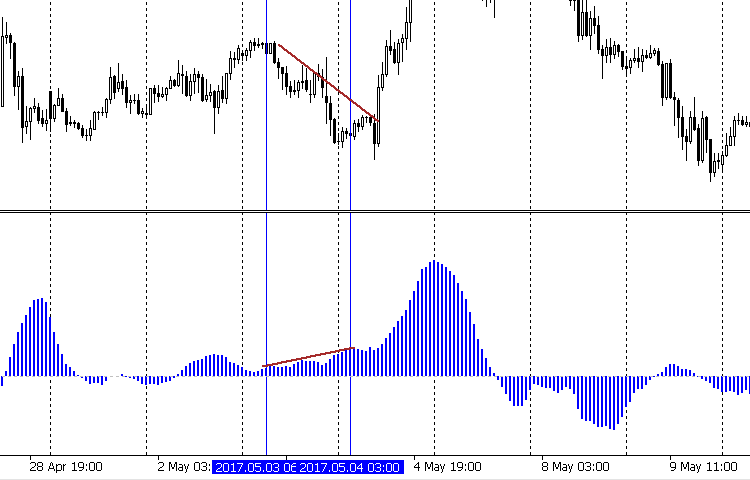
... and detect a divergence on one of the segments. The resistance lines on the price chart indicate the downward trend, however the change dynamics of our indicator warns of a trend weakening or coming to an end. Indeed, we can see a trend reversal further on. The behavior of other currency pairs' prices confirm our conclusions:
This particular situation confirms our previous conclusions that the patterns considered in this article should be applied to an individual pair with caution. At the same time, we can use the patterns with more confidence when applying them to the entire basket of currency pairs.
Conclusion
We have completed the analysis of the patterns that arise when trading currency pair baskets. Let's summarize the general trading rules concerning the application of all described patterns.
- The high accuracy of the pattern occurring when oversold/overbought levels are crossed by the chart of the combined indicator defining a difference between the combined oscillator indicator (WPR, STOCH) readings for a base currency and a quote currency. We can enter the market after the candle closes, which confirms the oversold/overbought line breakout and a possible new trend. The entry is performed on a single currency pair — the one your indicator is launched at. We can exit the market after the indicator reaches the area near zero or an opposite border of the indicator range:
In the latter case, open orders should be moved to breakeven when approaching the zone near zero. Pay attention to a false Buy signal. This was discussed here. A stop loss can also be placed according to the indicator. It can be triggered if the indicator does not move towards zero after the overbought/oversold lines are broken. Instead, it reverses, crosses the overbought/oversold line again, consolidates and starts moving after the range border.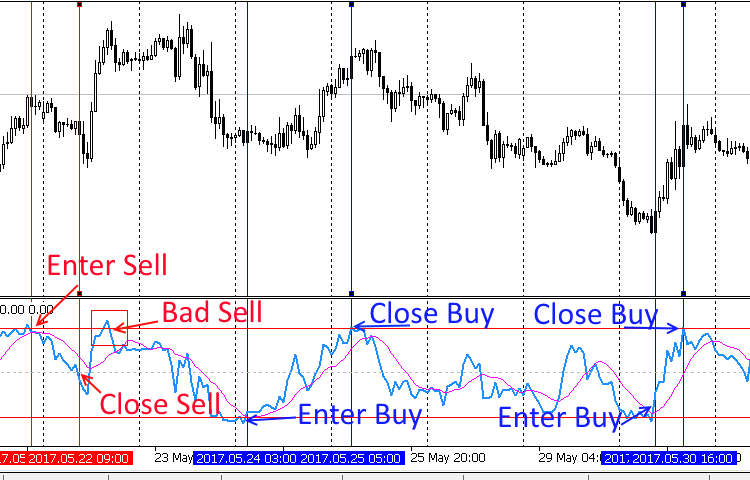
- The same pattern exists for the combined oscillator indicators (WPR, STOCH) displaying the basket currency state. Below is the chart of the combined WPR for EUR:
The entry and exit rules remain the same, although the entry is performed on all basket currencies instead of one. Pay attention to the point where a stop loss is possible. Here it is provided for illustrative purposes only. A trader does not necessarily fix a loss there. The indicators used here and in the previous paragraph can be found in the attached wpr2.zip archive.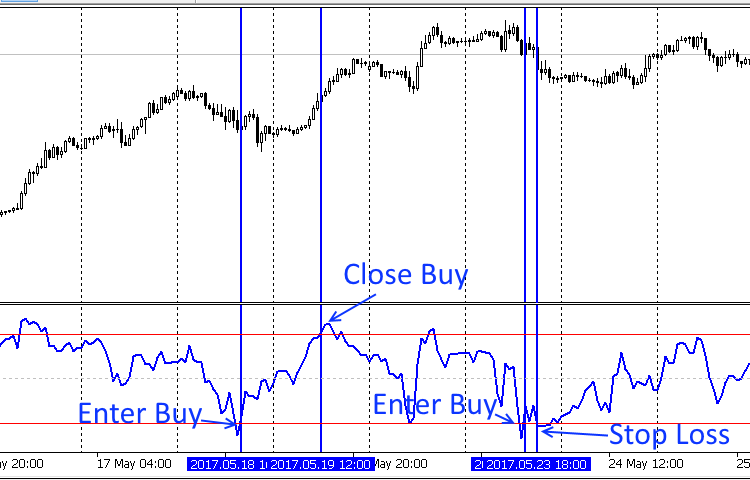
- The intersection of the MA charts can serve as an auxiliary pattern in addition to the two ones above. If this occurs near the overbought/oversold lines breakthrough, this strengthens the both patterns.
- Patterns formed when applying combined trend indicators are also of an auxiliary nature. There are no reasons to recommend entering the market after their detection yet but they can be used with the first two patterns as additional signals.
At this stage, it is impossible to give accurate trade recommendations with figures and meaningful statistics. The absence of historical research is a serious drawback of all the described patterns. We will address that issue in the future articles.
Programs used in the article:
| # | Name |
Type |
Description |
|---|---|---|---|
| 1 | wpr.zip | Archive |
Contains the reference testWPRusd indicator (code and executable module) and the WPR technical indicator code - wpr.mq5 |
| 2 |
testIndex+WPR.mq5 | Indicator | Test combined indicator plotting WPR values obtained after applying the WPR calculation equation to the basket currency index values. |
| 3 |
index.zip | Archive | Two combined USD and EUR basket currency index indicators |
| 4 | testIndexMACD.zip | Archive | Simple trend indicator based on MACD |
| 5 |
wpr2.zip | Archive | Indicators for illustrating the market entries and exits |
Translated from Russian by MetaQuotes Ltd.
Original article: https://www.mql5.com/ru/articles/3266
Warning: All rights to these materials are reserved by MetaQuotes Ltd. Copying or reprinting of these materials in whole or in part is prohibited.
This article was written by a user of the site and reflects their personal views. MetaQuotes Ltd is not responsible for the accuracy of the information presented, nor for any consequences resulting from the use of the solutions, strategies or recommendations described.


 Graphical Interfaces XI: Rendered controls (build 14.2)
- Free trading apps
- Over 8,000 signals for copying
- Economic news for exploring financial markets
You agree to website policy and terms of use