• Обзор
  • Отзывы
  • Обсуждение (2)

POWR Long Short Zones

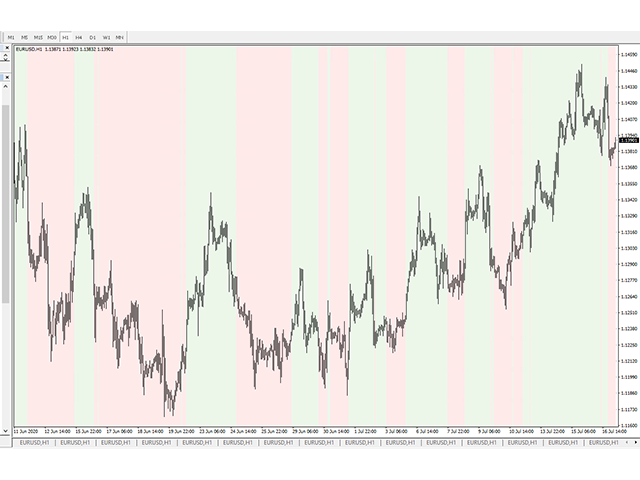
Wouldn’t you love a heads up alert when the market is switching from bullish to bearish momentum? When the background turns green, there is your signal to place a long trade to increase your profitability. Also, when the background turns red, guess what? It’s time to go short for profits.

HOW TO USE

1. When the background turns green, this is the best place to take long trades. This also represents a bull market.

2. When the background turns red, this is the best place to take short trades. This also represents a bear market.

BONUS FEATURES

This indicator NEVER repaints. Once a candle closes the background color is permanent. We have also coded in the ability for you to receive alerts when the background turns green and when the background turns red. The alerts will only go off for the first color change. After a color change has been triggered, reset the alert for future alerts.
Рекомендуем также
This indicator displays the histogram and arrows on chart. When Simple The Best Pro are placed on a chart, they identify the trend.  The color of may be blue or red. The blue color stands for upside moves and the red color stands for downside trends. The indicator offers to set Stop Loss (SL) and  Take Profit (TP)  setting. The default value is ATR. Indicator has automatic optimization. The STB is a unique indicator that shows the tendency (button Bars) of a particular signals. The STB tells us
Технический индикатор рассчитывающий свои показания на объемах торгов. В виде гистограммы показывает накопление силы движения торгового инструмента. Имеет независимые системы расчета для бычьего и медвежьего направления. Работает на любых торговых инструментах и тайм-фреймах. Может дополнить любую торговую систему. Индикатор не перерисовывает своих значений, сигналы появляются на текущей свече. Прост в использовании и не загружает график, не  требует производить дополнительные расчеты параметр
BoxChart MT4
Evgeny Shevtsov
4.57 (7)
Рынок несправедлив, хотя бы потому, что всего лишь 10% игроков управляют 90% капитала. У рядового трейдера мало шансов, чтобы противостоять этим «хищникам». Но выход есть, необходимо всего лишь перейти на другую сторону, необходимо находиться в числе этих 10% «акул», научиться распознавать их намерения и двигаться вместе с ними. Объем - это единственный опережающий фактор, который безупречно работает на любом периоде и любом торговом инструменте. Сначала зарождается и накапливается объем, и толь
Профиль Рынка (Market Profile) определяет ряд типов дней, которые помогают трейдеру распознать поведение рынка. Ключевая особенность - это область значений (Value Area), представляющая диапазон ценового действия, в котором произошло 70% торговли. Понимание области значений может помочь трейдерам вникнуть в направление рынка и установить торговлю с более высокими шансами на успех. Это отличное дополнение к любой системе, которую вы возможно используете. Blahtech Limited представляет сообществу Me
Descption: The Volume Profile displays detailed informations of historical trading activities at certain price levels (Market Profile). So you can locate the areas with the best prices in the market and get an advantage about other market participants. Support: Please do not hesitate to contact me via the MQL5 Platform. I am very grateful about any Bug report, so that i can constantly improve the indicator. I also appreciate any public review for this product.  Features: Customizable Volume
Displays the local time with the time difference you set. (It does not correspond to the time difference in 30-minute increments.) It also displays a price line with a good price, such as 100.000 .100 or .200. The standard gridlines are displayed with the time and price by MT4, but they are very confusing as they become the broker's time and are displayed at the halfway point along with the price. It hides them and displays gridlines at user-defined time differences and prices in easy-to-und
The Volume by Price Indicator for MetaTrader 4 features Volume Profile and Market Profile TPO (Time Price Opportunity). Get valuable insights out of currencies, equities and commodities data. Gain an edge trading financial markets. Volume and TPO histogram bar and line charts. Volume Footprint charts. TPO letter and block marker charts including split structures. Versatile segmentation and compositing methods. Static, dynamic and flexible ranges with relative and/or absolute visualizations. Lay
Индикатор Supply Demand использует предыдущее ценовое действие для выявления потенциального дисбаланса между покупателями и продавцами. Ключевым является определение зон с лучшими возможностями, а не просто вероятностей. Индикатор Blahtech Supply Demand обеспечивает функционал, не доступный ни в одной платформе. Этот индикатор 4 в 1 не только выделяет зоны с более высокой вероятностью на основе механизма оценки силы по множественным критериям, но также комбинирует его с мульти-таймфреймовым анал
Market Profile Heat indicator  — is a classic Market Profile implementation that can show the price density over time, outlining the most important price levels, value area, and control value of a given trading session. This indicator can be attached to timeframes between M1 and D1 and will show the Market Profile for daily, weekly, monthly, or even intraday sessions. Lower timeframes offer higher precision. Higher timeframes are recommended for better visibility. It is also possible to use a f
Индикатор строит текущие котировки, которые можно сравнить с историческими и на этом основании сделать прогноз ценового движения. Индикатор имеет текстовое поле для быстрой навигации к нужной дате. Параметры : Symbol - выбор символа, который будет отображать индикатор; SymbolPeriod - выбор периода, с которого индикатор будет брать данные; IndicatorColor - цвет индикатора; Inverse - true переворачивает котировки, false - исходный вид; Далее идут настройки текстового поля, в которое можн
Уникальность данного индикатора заключается в алгоритме учёта объёмов: накопление происходит непосредственно за выбранный период  без привязки к началу дня. Последние бары можно исключить из расчёта, тогда текущие данные будут меньше влиять на  значимые уровни (объёмы), образованные ранее. Для более точного расчёта по умолчанию используются данные с графика М1. Шаг распределения ценовых объёмов регулируется. По умолчанию правая граница отображения установлена на бар, соответствующий началу испол
The indicator allows you to trade binary options. The recommended time frame is М1 and the expiration time is 1,2,3 minutes. The indicator suitable for auto and manual trading. A possible signal is specified as a arrows above/under a candle. You should wait until the candle closes! Arrows are not re-painted Trade sessions: TOKYO section (Half-end) Currency pairs: USD/JPY Working time frame: M1 Expiration time: 1,2,3 minutes. The indicator also shows good results when using the martingale strateg
FREE
The Chaikin Oscillator is a technical indicator developed by Marc Chaikin that combines price and volume data to measure the accumulation and distribution of a financial instrument. It aims to identify potential buying and selling opportunities in the market. The Chaikin Oscillator is calculated by subtracting a 10-day exponential moving average of the Accumulation Distribution Line (ADL) from a 3-day exponential moving average of the ADL. Here's how to use the Chaikin Oscillator indicator in tr
Индикатор VR Calculate Martingale это мощный калькулятор ордеров и позиций для расчета прибыли или убытка. С помощью калькулятора ордеров и позиций трейдер может рассчитать среднюю цену любых форекс валют, биржевых акций или крипто валют. Уже сейчас Вы можете подключить индикатор и запустить функцию наложения виртуальных ордеров на Ваши реальные ордера и позиции. Создавая дополнительные виртуальные позиции, Вы сможете просчитать любое развитие событий. В индикатор встроен калькулятор лотов, каль
Master scalping M1 -инновационный индикатор, использующий алгоритм для быстрого и точного определения тренда.Индикатор рассчитывает время открытия и закрытия позиций, алгоритмы индикатора позволяют находить идеальные моменты для входа в сделку (покупки или продажи актива), повышающие успешность сделок у большинства трейдеров. Преимущества индикатора: Прост в использовании, не перегружает график не нужной информацией. Возможность использования  как фильтр для любой стратегии. Работает на рынке
The Market Profile Indicator for MT4 displays the price levels and zones where increased trading activity happens. These zones with substantial forex trading activity provide the forex traders with the best entry levels, support, and resistance levels. Moreover, price levels indicate the best reversal zones. As a result, forex traders can identify BULLISH and BEARISH market trends and BUY and SELL entry points as well as the best reversal points. The indicator works well in all intraday timefram
Horizontal tick volumes (HTV) Горизонтальные тиковые объемы - легкий и удобный индикатор горизонтального профиля рынка в выбранном пользователем интервале времени. Имеет быструю динамику отображения горизонтальных тиковых объемов на графике. Производит наглядное изображение сильных торговых уровней по максимальным пикам прошедших объемов и направления торговли по цвету (продажи или покупки), а также позволяет обнаружить более мелкие торговые уровни с помощью дифференциации прошедших объемов. В р
Time Bubble ***Specialized for GBPJPY 1H time frame*** (tested for two years with success rates about 82%) Time Circle's smart algorithm detects the price circles with time . give strong signals at the right time as result of combine the price and time. our team spent months to develop this indicator specially for GBPJPY ..with high success rates about 82% win trades over two years .tested from December 2016 to November 2018. *** in last two years total signals 1012 with 829 Wins and
Daily Candle Predictor - это индикатор, который предсказывает цену закрытия свечи. Прежде всего индикатор предназначен для использования на графиках D1. Данный индикатор подходит как для традиционной форекс торговли, так и для торговли бинарными опционами. Индикатор может использоваться как самостоятельная торговая система, так может выступать в качестве дополнения к вашей уже имеющейся торговой системе. Данный индикатор производит анализ текущей свечи, рассчитывая определенные факторы силы внут
Intraday Volume Profile - Это инструмент визуализации, для понимания зоны высокой активности и зоны низкой активности, в рамках старшего таймфрейма D1 . Профиль объема дает превосходный визуальный образ спроса / предложения по каждой цене за выбранный таймфрейм. Представляя точку POC - Point of Control, которая указывает цену, по которой был продан максимальный объем, а также Value Area - область, где торгуется 68% активов инструмента. POC  - профиля может быть использованы в качестве поддержки
Market Profile Shows where the price has spent more time, highlighting important levels that can be used in trading. It is a powerful tool which is designed to take the fundamental components which comprise every market; price/volume/time, and visually display their relationship in real-time as the market develops for a pre-determined time period. Very powerful tool!
Представленный индикатор разработан на основе идеи, заложенной в достаточно популярный среди трейдеров индикатор Trend Trigger Factor (TTF). Индикатор определяет направление движения цены, сравнивая минимум и максимум цены текущей свечи с минимумом и максимумом цены за больший период. Параметры: Long_TTF_Bars - количество свечей, используемых для расчета направления движения цены за больший период времени (не может быть менее 2) Short_TTF_Bars - количество свечей, используемых для расчета направ
Forex Volume MT4
KEENBASE SOFTWARE SOLUTIONS
KT Forex Volume shows the buying and selling volume of a currency pair in the form of a colored histogram. The volume is made of buying and selling transactions in an asset. In FX market: If the buying volume gets bigger than the selling volume, the price of a currency pair would go up. If the selling volume gets bigger than the buying volume, the price of a currency pair would go down. Features Avoid the bad trades by confirming them using the tick volume data. It helps you to stay on the si
A tall upper shadow occurs when the price moves during the period, but goes back down, which is a bearish signal. A tall lower shadow forms when bears push the price down, but bulls pull it back up, which leaves a long line or shadow. This is considered a bullish signal. Some technical analysts believe a tall or long shadow means the stock will turn or reverse. Some believe a short or lower shadow means a price rise is coming. In other words, a tall upper shadow means a downturn is coming, whil
"Профиль объема" - это расширенный индикатор, отображающий общий объем торгов на каждом ценовом уровне за указанный пользователем период времени. Основными составляющими профиля объемов являются POC ( Point Of Control - уровень цены, при котором за выбранный период было исполнено максимальное количество контрактов), VAH ( Value Area High - самая высокая цена в области Value Area) и VAL ( Value Area Low - самая низкая цена в Value Area). Когда мы остановились на исходном индикаторе, мы долго с
Market Profile 3
Hussien Abdeltwab Hussien Ryad
4 (4)
Market Profile 3 MetaTrader 4 indicator  — is a classic Market Profile implementation that can show the price density over time, outlining the most important price levels, value area, and control value of a given trading session. This indicator can be attached to timeframes between M1 and D1 and will show the Market Profile for daily, weekly, monthly, or even intraday sessions. Lower timeframes offer higher precision. Higher timeframes are recommended for better visibility. It is also possible t
FREE
1. What is this         Rising volatility and falling volatility are not the same, whether it is academic research or actual testing has shown this point.         The original ATR indicator is calculated by putting up and down fluctuations together. This indicator is to calculate separately the upward volatility and the downward volatility, which can better help you study the market. 2. Indicator description          There are two modes for the calculation of this indicator, as shown in the f
AQ XFifteen Pro
HIT HYPERTECH INNOVATIONS LTD
Χ15 indicator is a MetaTrader 4 tool that allows you to  BUILD & BACKTEST ON REAL TIME  your own strategies quickly, easily and efficiently. It contains  15 of the most popular technical analysis indicators  that you can use, each one in a different way. Choose the indicators that you want to use, select how you will use them and you will see on the chart BUY (green) and SELL (red) arrows implementing your strategy. Choose Take Profit and Stop Loss and you will see the results of your strategy w
TWO PAIRS SQUARE HEDGE METER INDICATOR Try this brilliant 2 pairs square indicator It draws a square wave of the relation between your two inputs symbols when square wave indicates -1 then it is very great opportunity to SELL pair1 and BUY Pair2 when square wave indicates +1 then it is very great opportunity to BUY pair1 and SELL Pair2 the inputs are : 2 pairs of symbols         then index value : i use 20 for M30 charts ( you can try other values : 40/50 for M15 , : 30 for M30 , : 10 for H1 ,
To get access to MT5 version please click here . This is the exact conversion from TradingView: "[SHK] Schaff Trend Cycle (STC)" by "shayankm". This is a light-load processing indicator. This is a non-repaint indicator. Buffers are available for processing in EAs. All input fields are available. You can message in private chat for further changes you need. Thanks for downloading
С этим продуктом покупают
Прежде всего стоит подчеркнуть, что этот торговый индикатор не перерисовывается, не перерисовывает и не отставает, что делает его идеальным как для ручной, так и для роботизированной торговли. Атомный аналитик - это индикатор ценового действия PA, который использует силу и импульс цены, чтобы найти лучший край на рынке. Оборудованный расширенными фильтрами, которые помогают убирать шумы и ложные сигналы, и повышают торговый потенциал. Используя несколько слоев сложных индикаторов, Атомный анали
В настоящее время скидка 20%! Лучшее решение для новичка или трейдера-эксперта! Эта приборная панель работает на 28 валютных парах. Он основан на 2 наших основных индикаторах (Advanced Currency Strength 28 и Advanced Currency Impulse). Он дает отличный обзор всего рынка Forex. Он показывает значения Advanced Currency Strength, скорость движения валюты и сигналы для 28 пар Forex на всех (9) таймфреймах. Представьте, как улучшится ваша торговля, когда вы сможете наблюдать за всем рынком с пом
Step into the realm of Forex trading with confidence and precision using XQ, a cutting-edge Forex indicator designed to elevate your trading game to unprecedented heights. Whether you're a seasoned trader or just stepping into the world of currency exchange,   XQ Forex Indicator   empowers you with the insights and signals needed to make informed trading decisions. The signal conditions are a combination of three indicators, and XQ Forex Indicator only display  medium and long-term trends . The
TrendMaestro
Stefano Frisetti
5 (2)
note: this indicator is for METATRADER4, if you want the version for METATRADER5 this is the link: TRENDMAESTRO recognizes a new TREND in the bud, he never makes mistakes. The certainty of identifying a new TREND is priceless. DESCRIPTION TRENDMAESTRO identifies a new TREND in the bud, this indicator examines the volatility, volumes and momentum to identify the moment in which there is an explosion of one or more of these data and therefore the moment in which prices have strong probability of f
Представляем удивительный форекс-индикатор "Miraculous": раскройте силу точного трейдинга Вы устали от бесконечного поиска лучшего форекс-индикатора, который действительно доставляет исключительные результаты на всех таймфреймах? Не ищите дальше! Представляем вам форекс-индикатор "Miraculous", который пришел, чтобы изменить ваш опыт трейдинга и поднять ваши прибыли на новый уровень. Основанный на передовых технологиях и годам тщательной разработки, форекс-индикатор "Miraculous" является вершиной
TakePropips Donchian Trend Pro
Eric John Pajarillaga Aldana
4.82 (17)
TakePropips Donchian Trend Pro   (MT4) — это мощный и эффективный инструмент, который автоматически определяет направление тренда с помощью канала Дончиана и предоставляет вам торговые сигналы для входа и выхода! Этот многофункциональный индикатор включает в себя сканер тренда, торговые сигналы, статистическую панель, скринер, торговые сессии и панель истории предупреждений. Он разработан, чтобы предоставить вам торговые сигналы и сэкономить время на анализе графиков! Вы можете скачать руководст
FX Volume
Daniel Stein
4.6 (35)
Получайте ежедневную информацию о рынке с подробностями и скриншотами в нашем утреннем брифинге здесь, на mql5 , и в Telegram ! FX Volume - это ПЕРВЫЙ и ЕДИНСТВЕННЫЙ индикатор объема, который дает РЕАЛЬНОЕ представление о настроении рынка с точки зрения брокера. Он дает потрясающее представление о том, как институциональные участники рынка, такие как брокеры, позиционируют себя на рынке Forex, гораздо быстрее, чем отчеты COT. Видеть эту информацию прямо на своем графике - это настоящий геймчей
Cycle Sniper
Elmira Memish
4.41 (34)
NEW YEAR SALE PRICE FOR LIMITED TIME!!! Please contact us after your purchase and we will send you the complimentary indicators to complete the system Cycle Sniper is not a holy grail but when you use it in a system which is explained in the videos, you will feel the difference. If you are not willing to focus on the charts designed with Cycle Sniper and other free tools we provide, we recommend not buying this indicator. We recommend watching the videos about the indiactor and system before pu
Индикатор обнаруживает гармонические паттерны, которые строятся на графике с помощью ручных и автоматических методов. Руководство пользователя доступно по этой ссылке: Add Your review And contact us to get it Это бесплатная версия продукта. Вы можете использовать его для обнаружения паттернов Gartley и Nenstar: https://www.mql5.com/ru/market/product/30181 Примечания Если вы используете Windows 10, нажмите на иконку MetaTrader правой кнопкой мыши > "Совместимость" > "Переопределите режим масш
Представляем ON Trade Waves Patterns Harmonic Elliot Wolfe, передовой индикатор, разработанный для обнаружения разнообразных рыночных паттернов с использованием как ручных, так и автоматизированных методов. Вот как это работает: Гармонические паттерны: Этот индикатор может определять гармонические паттерны, появляющиеся на вашем графике. Эти паттерны важны для трейдеров, практикующих теорию гармонической торговли, как это описано в книге Скотта Карни "Гармоническая Торговля том 1 и 2". Независи
Ultimate Sniper Dashboard
Hispraise Chinedum Abraham
4.84 (25)
Скидка $299! Цены могут вырасти в будущем! Читайте описание ниже! Лучшая система ввода для Ultimate Sniper Dashboard: ПРЕДЕЛЬНЫЕ ДИНАМИЧЕСКИЕ УРОВНИ. (Пожалуйста, проверьте мои продукты) Ultimate Sniper Dashboard работает ТОЛЬКО на реальных рынках из-за ограничений мультивалютного тестирования MT4. Представляем вам Ultimate-Sniper Dashboard! Наша самая лучшая панель, которая содержит HA-Sniper, MA-Sniper и множество специальных режимов. Ultimate Sniper Dashboard - это абсолютный зверь!
Представляем индикатор астрономии для MT4: Ваш незаменимый небесный товарищ в торговле Готовы ли вы поднять свой опыт торговли до небесных высот? Не ищите дальше, чем наш революционный индикатор астрономии для MT4. Этот инновационный инструмент выходит за рамки традиционных торговых индикаторов, используя сложные алгоритмы для предоставления вам беспрецедентных астрономических понимания и точных расчетов. Вселенская информация под рукой: Взгляните на обширную панель, раскрывающую сокровищницу ас
В настоящее время скидка 20%! Эта приборная панель - очень мощное программное обеспечение, работающее на нескольких символах и до 9 таймфреймов. Он основан на нашем основном индикаторе (Лучшие отзывы: Advanced Supply Demand ).   Приборная панель дает отличный обзор. Она показывает:  Отфильтрованные значения спроса и предложения, включая рейтинг силы зон, расстояния между пунктами в зонах и внутри зон, Выделяются вложенные зоны, Выдает 4 вида предупреждений для выбранных символов на всех (9)
Данный индикатор предназначен для работы на любом ТФ. Программа на основе авторских алгоритмов и математике W.D.Ganna позволяет рассчитать целевые уровни движения цены по трем точкам с высочайшей степенью достоверности. Является прекрасным инструментом для биржевой торговли. Индикатор оснащен тремя кнопками NEW - вызвать треугольник для расчета. DEL - удалить выбранный треугольник. DELS - полностью удалить все построения. Вероятность достижения целей более 80%. Так же индикатор оснащен сигналом
Please send me Direct message on MQL5 CHAT after purchasing the Indicator for Training and Installation Support There are some additional files that is important to use with the Indicator . So be sure to contact me after purchasing the Indicator So that I can add you for training and support . If you find any difficulty with installation then send me Direct message here So that I can connect with you via Anydesk or Teamview for the product installation. " Smart Order Block Indicator " to find
The breakout algorithm is a technique based on price, price features, to shape a breakout strategy. The strategy in this indicator will not be redrawn (none-repaint indicator), it is suitable for short or long term traders In the screenshot is the EURUSD pair, these currency pairs, commodities or stocks, it have similar strength *Non-Repainting (not redrawn) *For Metatrader4 Only *Great For Scalping *Great For Swing Trading *Arrow Entry, Green is Long, Red is Short *Works On Any Timeframe *Work
Indicator : RealValueIndicator Description : RealValueIndicator is a powerful tool designed specifically for trading on the EURUSD pair. This indicator analyzes all EUR and USD pairs, calculates their real currency strength values, and displays them as a single realistic value to give you a head start on price. This indicator will tell you moves before they happen if you use it right. RealValueIndicator allows you to get a quick and accurate overview of the EURUSD currency pair tops and bottoms,
Gann Signal - очень простой на первый взгляд индикатор, но внутри скрыт многолетний опыт изучения методов W.D.Ganna. Индикатор дает точные BUY/SELL сигналы, без перерисовки. Индикатор очень прост в применении. Вам нужно лишь прикрепить его на график и следовать его рекомендациям. Индикатор постоянно ведет анализ рынка на предмет возможностей для входа. Когда такая возможность появляется, индикатор дает сигнал в виде стрелки. Повторяюсь, все сигналы НЕ ПЕРЕРИСОВЫВАЮТСЯ! Индикатор предназначен для
IA Trendx3 PRO
Marco Aurelio Santos Costa
Что если бы Бог создал торговую систему? Без чудес... Просто посмотрите, как математика может быть эффективной на рынке. Нам удалось объединить технический анализ / ценовое движение в индикаторы, создав лучшую настройку для торговли, будь то на рынке Forex, индексах или акциях. Нам понадобилось 2 года, чтобы создать что-то, что действительно работает, и теперь пришло время вам это открыть. TrendX3 - это революция в анализе трендов. На основе передовых алгоритмов и данных в реальном времени он пр
Excessive Momentum Indicator – один из немногих индикаторов, измеряющий чрезмерный импульс на финансовом рынке с использованием ценового поведения. Индикатор полностью разработан Янгом Хо Сео (Young Ho Seo). Этот показатель демонстрирует концепцию и практическое применение Равновесной фрактальной волны (Equilibrium Fractal Wave). Чрезмерный импульс на рынке может рассказать о психологии толпы и помочь спрогнозировать направление цены. Таким образом, вы можете основывать свои торговые решения на
Данный индикатор основан на математике великого трейдера W.D.Ganna.  С помощью его мы с легкостью найдете сильные уровни анализируя свинг для поиска оптимальной точки входа. Индикатор работает на всех инструментах и всех тайм фреймах. Индикатор полностью ручной и оснащен кнопками управления. Все что вам нужно это нажать на кнопку NEW, появится отрезок, данный отрезок вы размещаете на любое движение, свинг или даже 1 свечу, которую хотите проанализировать. Разместив отрезок нажимаете кнопку ОК. П
А. Что такое A2SR?   * Это опережающий технический индикатор (без перерисовки, без запаздывания) . -- Учебники : -- на https://www.mql5.com/ru/blogs/post/734748/page4#comment_16532516   -- и https://www.mql5.com/ru/users/yohana/blog A2SR имеет особую технику определения уровней Поддержки (спроса) и Сопротивления (предложения). В отличие от обычного способа, который мы видели в сети, A2SR имеет оригинальную концепцию определения фактических уровней SR. Оригинальная техника не была взята из Инт
SMCpro VIP MT4  Original Price  $620   ---  Currently Price 20% OFF ( for unlimited use )   BONUS  AUX VIP Club 2024 : Include  EA Airbag  and  Load Data History  to enhance the performance of this tool to its maximum potential  Click Here to Download Files   ( for users only )   Hello World! Introducing.. SMCpro VIP tool and Indicator for MetaTrader 4, designed to revolutionize your trading experience with the ICT Smart Money Concept. This system is meticulously crafted to empower trad
Candle Power Pro
Thushara Dissanayake
4.33 (6)
Раскройте всю мощь информации о реальных объемах с помощью индикатора   Candle Power Pro   . Этот динамический инструмент фиксирует фактические данные об объеме для каждой свечи и представляет их в процентах от общего объема. Таким образом, вы сможете увидеть непрекращающуюся борьбу между покупателями и продавцами на рынке. Candle Power Pro отображает битву между покупателями и продавцами в процентах от общего объема, что дает вам ценную информацию о динамике рынка. Вы можете легко подтвердить
Features for software Main functions: Accurate entry signals WITHOUT REPAINTING! Once a signal appears, it remains valid! This is a significant distinction from repainting indicators that might provide a signal and then alter it, potentially leading to deposit losses. Now, you can enter the market with higher probability and precision. There's also a function to colour candles after an arrow appears until the target (take profit) is reached or a reversal signal appears . Display of STOP LOSS
Weis Wave with Alert
Trade The Volume Waves Single Member P.C.
4.79 (19)
Индикатор волны Вайса основан на теории Ричарда Вайкоффа. Работает на всех таймфреймах, флетовых и тиковых графиках. Может применяться к любому рынку. Индикатор добавляет объемы соответствующих ценовых волн и рисует кумулятивную гистограмму. Каждая ценовая волна движется в определенном направлении вверх или вниз, пока не изменится. Чтобы индикаторная волна развернулась, цена должна превышать количество точек (пипсы * 10), установленных в параметрах индикатора. Поэтому последняя волна перерисовыв
Martingale Arrow — это индикатор mt4 типа стрелки, предназначенный для торговли бинарными опционами по мартингейлу. Эта стрелка печатается на открытом/внутри баре и выдает предупреждение. КАК ИСПОЛЬЗОВАТЬ: откройте сделку, когда появится стрелка момента. Если сделка выиграла, дождитесь следующего сигнала и торгуйте тем же лотом. Если сделка теряет двойной лот по следующему сигналу и продолжаете делать это до тех пор, пока сигнал не выиграет, затем выполните сброс и торгуйте первым лотом. РЕКОМЕ
Индикатор Full STO (включает в себя все версии трех индикаторов STO: Premium, Gold, Silver) - STABLE TRADE OPTION предназначен для автоматической торговли бинарными опционами.  ЧИТАЕМ ВНИМАТЕЛЬНО!!!!! ВАЖНО В одном терминале создаем два шаблона с разными экспирациями, шаблон на 18:01, 18:02 с экспирацией от 1 до 15 минут и шаблон 22:00 c экспирацией от 10 до 20 минут. Winrate: 71% over the past 5 years Money management: 0.3% from the deposit Данная версия индикатора настроена только на
Full Forex Market View Dashboard
Opengates Success International
5 (2)
ПОЛНЫЙ ОБЗОР РЫНКА FOREX Индикатор приборной панели Это пользовательский индикатор, созданный, чтобы дать трейдерам полное представление о том, что происходит на рынке. Он использует данные в режиме реального времени для доступа к рынку и отображения каждого бита информации, необходимой для успешной торговли. МОНТАЖ: Прежде чем прикреплять этот индикатор к оконному графику, перейдите на панель «Обзор рынка» вашего MT4 и СКРЫТЬ все валютные пары, которые вам не нужны или которыми вы торг
Gold Channel is a volatility-based indicator, developed with a specific timing algorithm for the XAUUSD pair, which consists of finding possible corrections in the market. This indicator shows two outer lines, an inner line (retracement line) and an arrow sign, where the theory of the channel is to help identify overbought and oversold conditions in the market. The market price will generally fall between the boundaries of the channel. If prices touch or move outside the channel it is a tra
Другие продукты этого автора
You’ll love how you can receive alerts to your email and SMS when the candles turn green or red signifying the best buy and sell times in correlation to confirmed uptrends and downtrends. TO USE 1. Buy when green candles appear - this represents an uptrend. 2. Sell when red candles appear - this represents a downtrend. EXTRA FEATURE This indicator NEVER repaints so when a candle closes, that color is final. Also, the blue trend lines in the photos are not included, this is to demonstrate the pri
This indicator is SO SIMPLE… when the green Rise Coming arrow appears, a price drop may be on the way! Plain and easy profits! As you receive more than one 'Rise Coming' text signal in a downtrend, it means momentum is building larger for a bull run. HOW TO USE 1. When the green "Rise Coming" text appears, a price jump may be on the way! This indicator Never Repaints! To get the best setting it's a matter of tweaking the indicator until it gives you the best results. Our recommendation, and what
Profits are on the way! This indicator is SO SIMPLE… when the red Drop Coming arrow appears, a price drop may be on the way! When more than one "Drop Coming" signal appears on a bull run, that means the drop is getting closer. HOW TO USE 1. When the red "Drop Coming" arrow appears, a price drop may be on the way! To get the best setting it's a matter of tweaking the indicator until it gives you the best results. Our recommendation, and what our traders do is open their chart and move the input n
You’re going to love this! We have coded in the ability for you to be alerted by email or SMS when the Green Buy Line crosses below the Red Stop-loss line signaling a sell. And to take it one step further to increase your profits, we coded in the ability for you to be notified with the Price crosses down below the Green Buy Line or below the Red Stop-loss Line to give you earlier exit opportunities. HOW TO USE 1. Buy when the green buy line crosses above the blue trend line. You can also buy whe
This algorithm is created for you to receive alerts as to when the green stochastic line has crossed above the red stochastic line to launch a long trade and vice-a-versa for short trades. This indicator is a work horse for your profit picture! HOW TO USE 1. When the green stochastic line has crossed above the red stochastic line with a green background, this is an ideal place for a long entry. 2. When the green stochastic line has crossed below the red stochastic line with a red background, thi
Our most popular indicator in our fleet of indicators. The POWR Trend Trader is the highest grossing manual strategy for trading on the market today. This indicator is upgraded with more Profit Points and also introduces Re-Entry alerts. The POWR Trend Trader (PTT) is our premier indicator! What this indicator can do for your profits is staggering! HOW TO USE The POWR Trend Trader has a Master Trend Meter at the bottom of the chart. We actually re-coded the main indicator that turns your candle
For sure, this indicator has become very popular amongst traders. Through coding this indicator will give you the most accurate levels possible for your trading analysis. We have also added in the ability for you to receive alerts when the price breaks above or below a Support or Resistance lines! HOW TO USE The red rectangles represent your resistance/supply zone. The green rectangles represent your support/demand zone.  BONUS FEATURES We coded this indicator with the ability to switch between
Don’t overlook the power of this indicator. We took the time to find the best algorithm to pull the best momentum lines in the industry. We also coded in the orange stream to give you a quick glance at where the overall trend is heading. This indicator works incredibly well for Stocks, Forex and Crypto! HOW TO USE When the orange stream is heading down, this means you are in a strong downtrend. When the orange stream is heading up, this means you are in a strong uptrend. When the red lines start
For trading, the support and resistance lines for current price are everything. With the ability to adjust sensitivity, this indicator delivers just that! HOW TO USE The blue lines represent the most relevant support and resistance for the current price. You can adjust the sensitivity of the support and resistance lines by adjusting the input value under the indicator settings to show more or less support lines. 
Фильтр:
Нет отзывов
Ответ на отзыв