Ultra Confluence

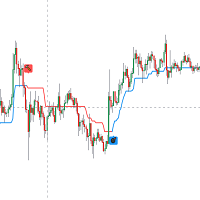
Ultra Confluence is a trend indicator for MetaTrader 5 built around a trailing stop that picks its own width. A normal SuperTrend uses one ATR multiplier forever. This one runs nine of them side by side (1.0 to 5.0 in steps of 0.5), keeps score of how each has been doing, sorts them into three groups with k-means clustering on every bar, and trails price with the average multiplier of the best group. Around it sit an ATR-based Ichimoku cloud, a liquidity and sentiment volume profile, volume-coloured candles and swing labels with the candle pattern at each pivot.

On 10,001 hourly gold bars (March 2025 to November 2026) the multiplier it chose went all the way from 1.0 to 5.0, with a median of 2.75. So it really does move, and it moves on its own.

What's different from a plain SuperTrend

What you want What a fixed SuperTrend does What Ultra Confluence does
A stop width that suits the current market One multiplier you guessed once Picks it every bar from the best-performing group of nine
Know how much to trust a flip Every arrow looks the same Prints a 0-10 score next to each flip
Room for a pullback Tightens every bar, so pullbacks stop you out Only tightens while the previous close is on the trend side of the Tenkan line
Context around the line Nothing Cloud, volume profile, liquidity zones, swing labels

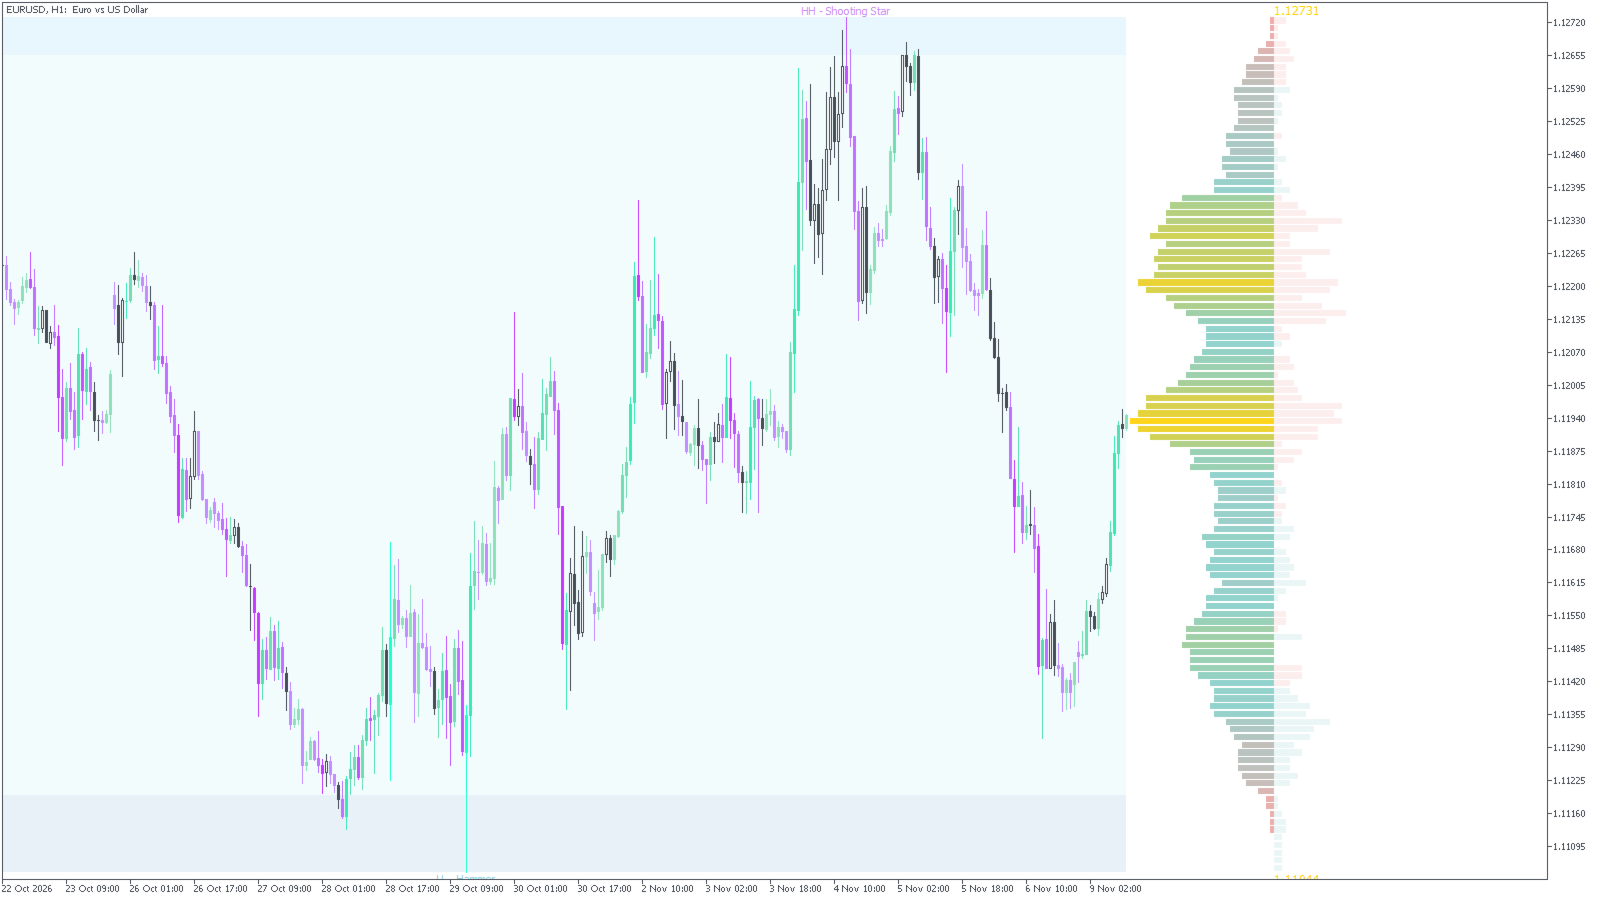
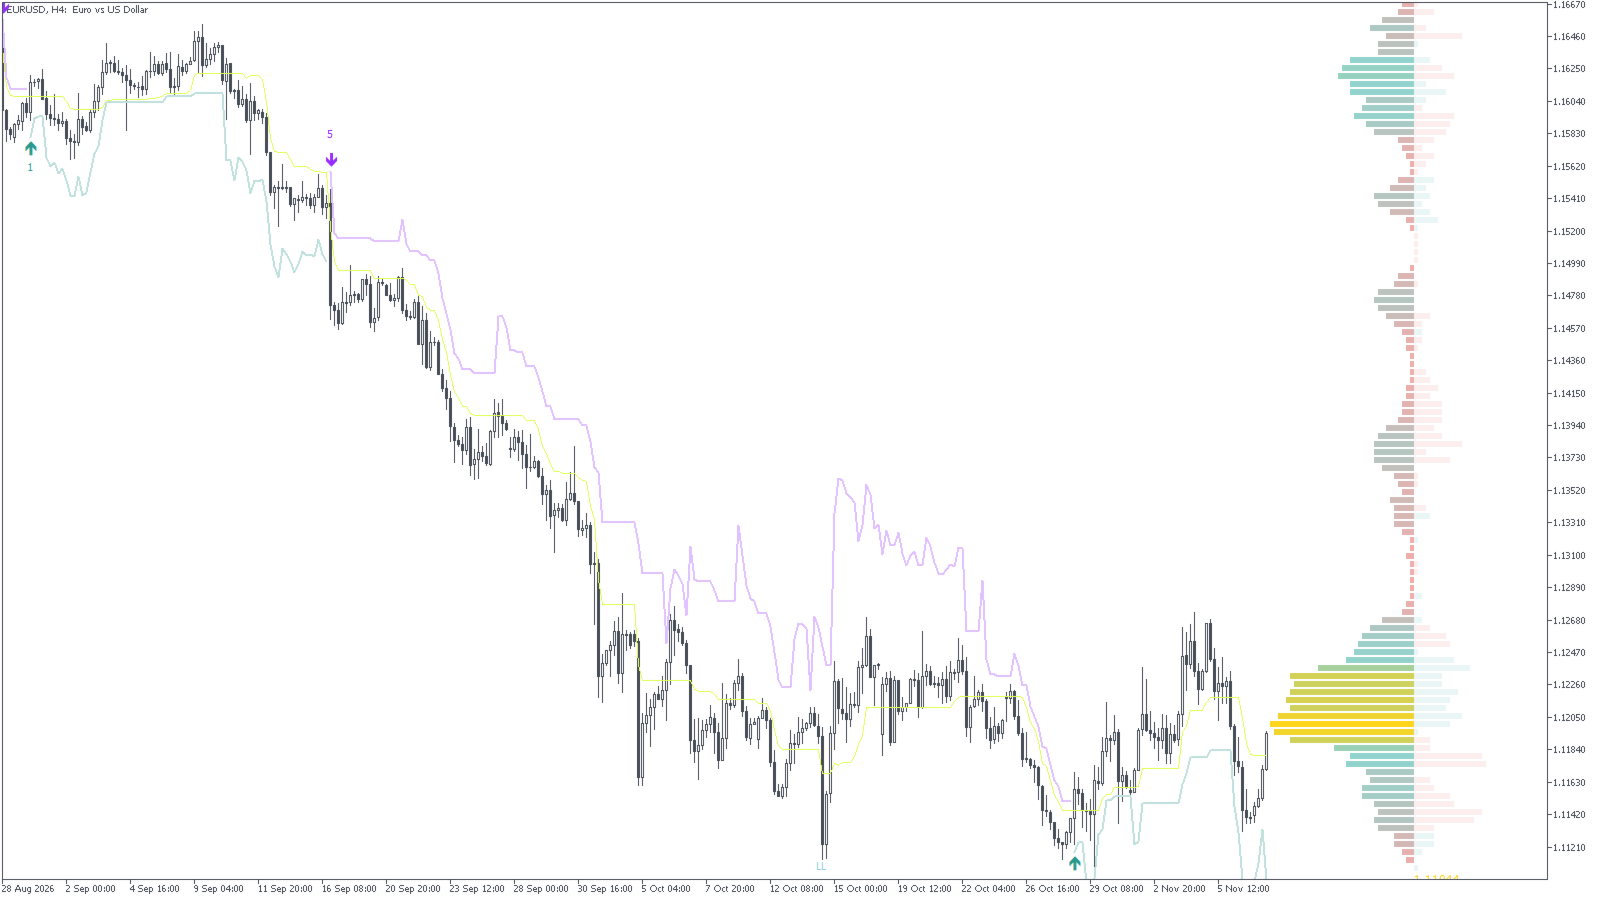
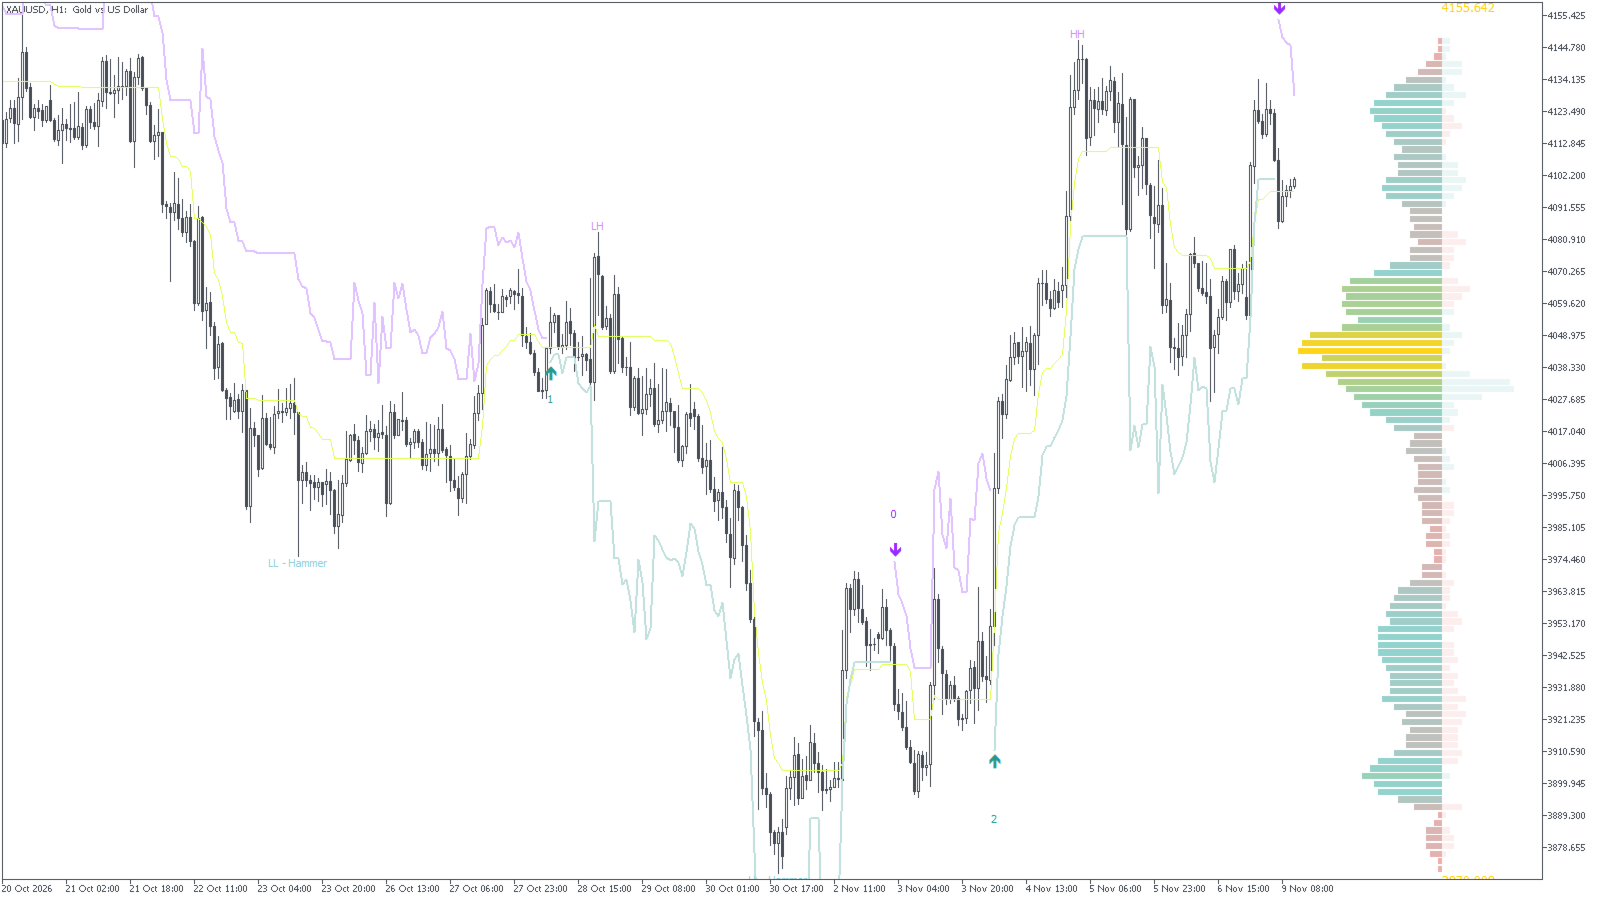
The third row is the one nobody tells you about, so here's what it means in practice. In a downtrend the stop only steps down while the previous close sits below the Tenkan. Once price closes back above it, the stop is rebuilt from scratch and can jump up, away from price. On EURUSD H4 it did exactly that on 14-15 October 2026, going from 1.12223 to 1.13595 in a day, 137 pips looser. On gold H1 the stop backed away on 2,490 of the 9,892 bars that were inside a trend, about one bar in four.

That's good if you want to stay in a trend through a pullback. If you were planning to use the line as a hard stop loss, you need to know it can move against you.

What it draws

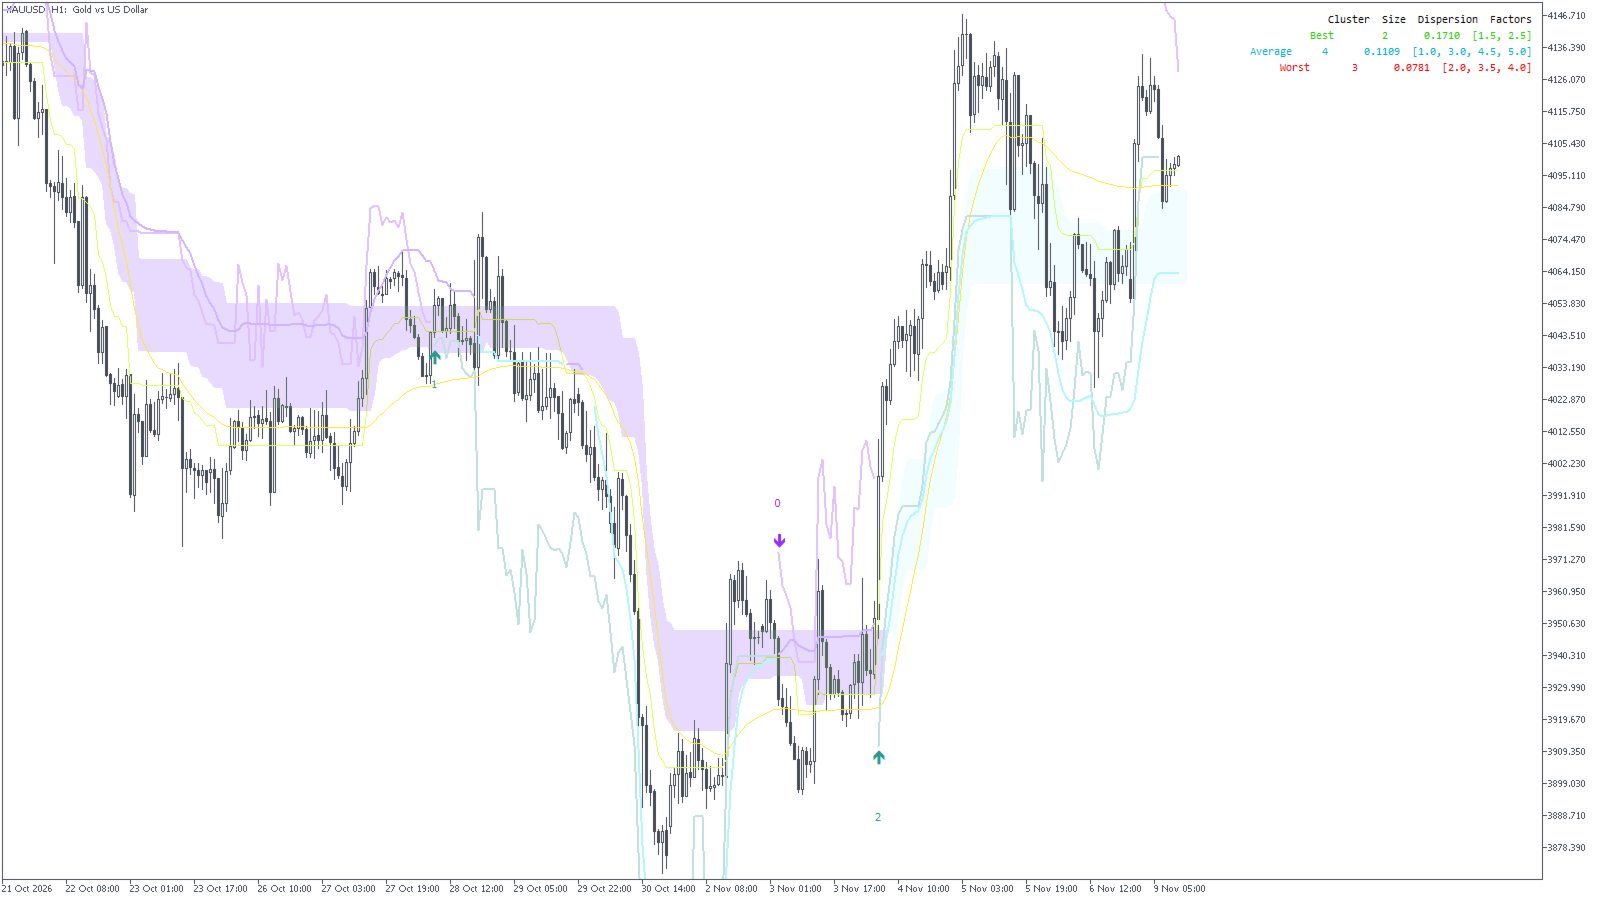
Adaptive trailing stop + signals (on). The line, an arrow when it flips, and a score next to it. Two extra lines are off by default: a smoothed copy of the stop coloured by whether the Tenkan is above or below it, and an adaptive moving average (TRAMA, 52) that speeds up when price makes new 52-bar highs or lows.

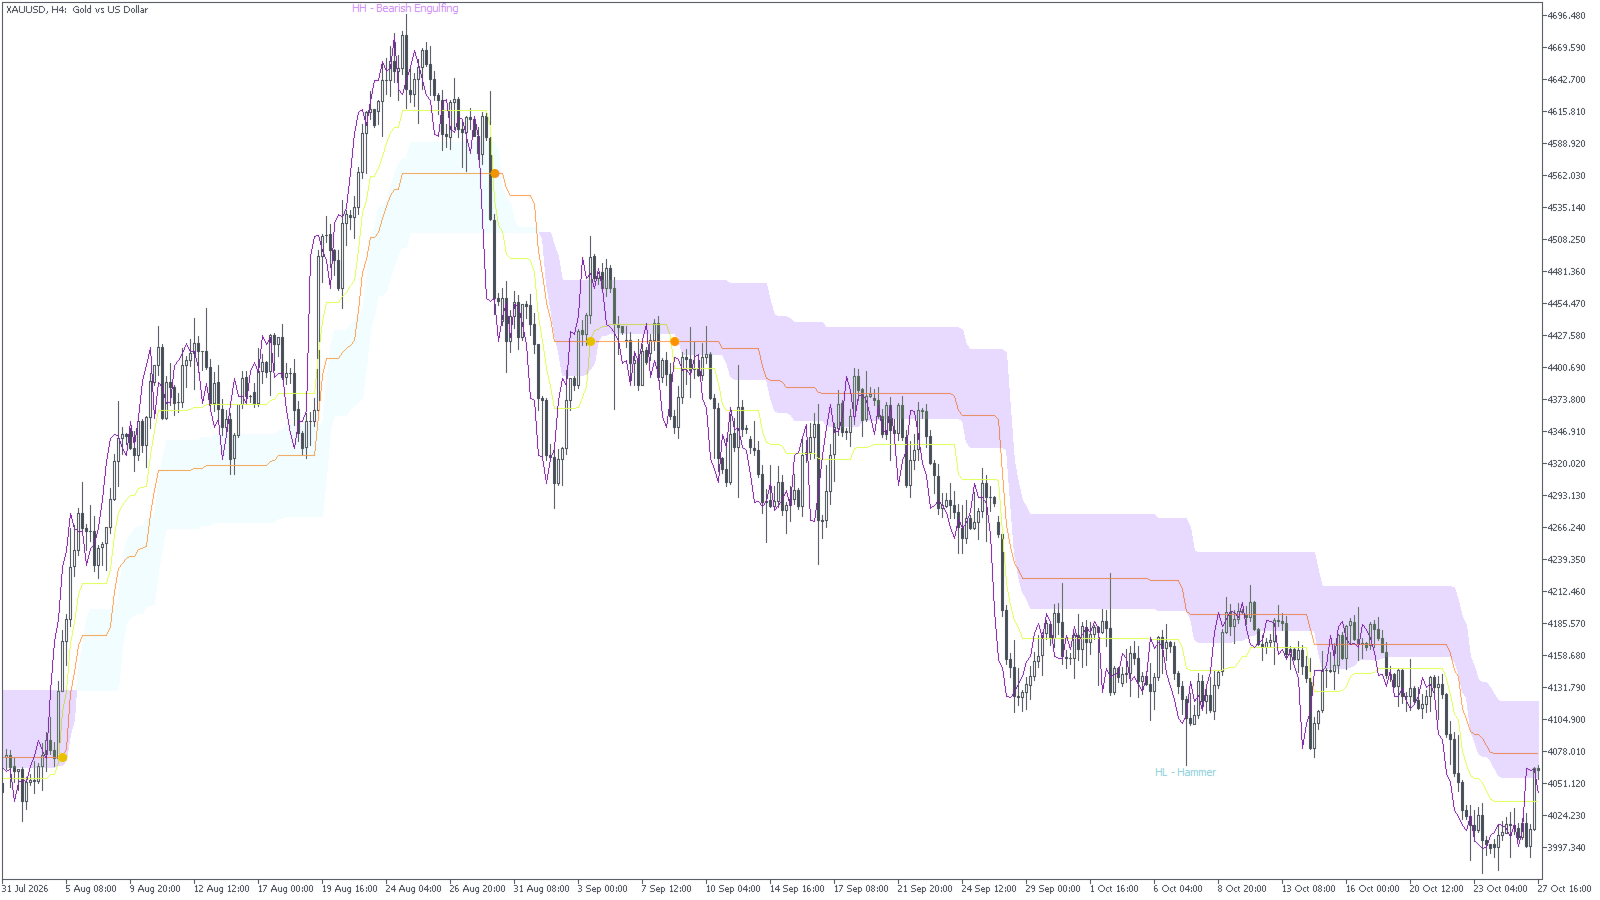
ATR Ichimoku (Tenkan on, the rest off). Tenkan, Kijun and Span B aren't midpoints of high/low here. Each is the middle of the range an ATR trailing stop has covered (9 x 3, 26 x 6, 52 x 9 ATR), so they step instead of wobbling. Only the Tenkan is shown by default, because it decides when the stop may tighten. Kijun with the cross dots, the cloud (2 bars forward) and the Chikou (2 bars back) each have their own switch.

Liquidity sentiment profile (on). On the last 333 bars by default: a volume profile and a buy-minus-sell profile next to it. Switch on the liquidity zones and the thin-volume rows get shaded across the range as buyside (above the busiest row) or sellside (below it) liquidity.

Volume candles (MT5, off). Candles are shaded by tick volume against its own 9-bar volume-weighted average, six shades per direction. The wicks turn teal or purple depending on whether today's running volume is rising or falling versus the last three days at the same hour.

Swing labels (on). HH, LH, HL, LL on 52/52 pivots, plus the candle pattern at that pivot when there is one (hammer, inverted hammer, engulfing, hanging man, shooting star). Hover a label for a one-line description.

Retracement fans (off). Highest and lowest close of the last 900 bars with levels at .163, .333, .432, .639 and .963. Those aren't Fibonacci ratios. I've kept them because they're part of the tool, but I've got no evidence they work better than the usual ones, so treat them as rough zones.

It doesn't draw order blocks or fair value gaps, it doesn't give TP levels, and it doesn't place trades.

Reading the score

The number next to each flip is the best group's recent performance divided by the average bar move, times ten. It isn't a probability. On gold H1 the 108 flips scored like this: 46 got a 0, 26 a 1, 12 a 2, 15 a 3, and only 9 scored 4 or more (the highest was 6). A 0 means even the best multipliers weren't making progress, which is pretty much what a range looks like. The EURUSD H4 sell on 16 September 2026 scored 5 and was followed by a 359-pip fall, but one example proves nothing, so I'd use the score to skip the 0s, not to size up on the 5s.

Settings

Out of the box you get the stop with its scores, the Tenkan, the volume profile and the swing labels. Everything else is one switch in the inputs: Kijun, cloud, Chikou, liquidity zones, volume candles, TRAMA, the smoothed stop, the retracement fans and the cluster table.

Setting Default What it does When to change it
Factor Range 1 to 5 Lowest and highest ATR multiplier tried Narrow it if the stop is too loose or too tight overall
Step 0.5 Gap between multipliers (9 lines at default) Smaller = more lines, slower
Performance Memory 33 How many bars each line's score remembers Lower reacts faster
From Cluster Best Which group drives the stop Average gives a calmer line
Historical Bars Calculation 10000 Bars the clustering runs on Lower if loading is slow
Anchor Period Fixed Range (333) Window of the volume profile Day / Week / Swing High for session profiles
Swing length 52 Pivot size for the HH/LL labels 10-20 for intraday swings

Alerts for flips and Tenkan/Kijun crosses go to popup, phone, email and on MT5 Telegram. They're off by default and wait for the bar to close.

What this version can't do

The profile and the fans are drawn to the right of the last bar, so switch on chart shift or you'll only see their edge (MT4 especially). Swing labels show up 52 bars after the pivot, because that's how long the pivot needs to be confirmed. There's no stop before the last 10,000 bars. MT4 can't colour candles, so the volume candles and wicks are MT5 only; the MT4 cloud is drawn with thin vertical lines.

You won't find a win rate table here, and I'd be careful with any indicator listing that has one.

Questions you'll have

Does Ultra Confluence repaint? Closed bars don't change. The stop and the arrow are calculated on the forming bar too, so a flip can appear and disappear before the close, like any trailing stop. Alerts wait for the close by default, and swing labels are only drawn from closed bars.

Why did the trailing stop move away from price? The previous close went to the wrong side of the Tenkan line, so the stop was rebuilt at today's distance instead of tightening. It happens on about a quarter of trend bars on gold H1.

What does the number next to the arrow mean? It's the best group's performance against the average bar move, times ten. 0 means nothing was trending. It's not a win probability.

What are the best settings for Ultra Confluence? I've only looked at the defaults on gold H1, gold H4, EURUSD H1 and EURUSD H4, so I'd start there and change Factor Range and From Cluster first.

Is there an MT4 version? Yes, listed separately as Ultra Confluence MT4. It calculates the same values bar for bar. This MT5 version adds the volume candles, the coloured wicks, a filled cloud and Telegram alerts.

Can an EA read the signals? Yes. Buy and sell arrows, direction, the score and the chosen multiplier all have their own buffers: 28, 29, 30, 31 and 32 on MT5, 12, 13, 14, 15 and 16 on MT4.

Support

Send me a private message here on MQL5 with a screenshot, the symbol and the timeframe. Updates are free.

Analysis tool. It places no trades and makes no profitability claim. Past price behaviour is not a guide to future price behaviour.
Рекомендуем также
RSI Divergence Risk Target Signals RSI Divergence Risk Target Signals is a MetaTrader 5 indicator that detects confirmed bullish and bearish RSI divergence and combines the signals with optional trend filters, ATR-based Stop Loss levels, three Take Profit targets, alerts and an internal trade statistics dashboard. The indicator compares confirmed RSI pivot structure with corresponding price highs and lows. It is designed to help traders identify momentum divergence while providing a structure
META TREND PRO   — это трендовый инструмент, который убирает догадки из торговли и показывает, где рынок уже принял решение. Индикатор выявляет ключевые точки, в которых происходит смена тенденции, тренда и структуры, а также подсвечивает зоны, куда возвращается цена для набора позиций крупными игроками. Вы видите не просто движение — вы понимаете логику, стоящую за ним. Все сигналы фиксируются после закрытия свечи, не перерисовываются и сохраняются на графике, позволяя уверенно анализировать си
TapeResilience — Volume Flow and Price Impact Analysis Volume Analysis | Order Flow | Price Impact | Market Response TapeResilience is a market activity analysis indicator for MetaTrader 5, designed to help traders study the relationship between trading volume, directional pressure, price impact, and subsequent market reactions. Instead of relying on traditional Buy/Sell signals alone, TapeResilience evaluates unusual market activity and observes how prices respond after significant directional
MercariaPattern1-2-3 відстежує рух ціни, знаходить трьоххвильові структури 1-2-3 та підсвічує момент, коли сценарій підтверджується пробоєм ключового рівня. MercariaPattern1-2-3 tracks price movement, detects three-leg 1-2-3 structures and highlights the moment when the scenario is confirmed by a key level breakout. Індикатор збирає локальні свінги в компактну фігуру 0–1–2–3 , чекає підтвердженого пробою та будує стрілку входу з готовими рівнями SL/TP. The indicator combines local swings into a
CRT Candle Range Theory HTF MT5 - Ultimate CRT Indicator: Передовые концепции ICT и торговая система Malaysian SnR Освойте следы маркетмейкеров с помощью самого передового индикатора Candle Range Theory. Раскройте истинную силу Smart Money Concepts (SMC) и торгуйте точно так же, как институциональные участники, с помощью Ultimate CRT Indicator. Созданный исключительно для серьезных трейдеров, этот индикатор автоматизирует высокоэффективную теорию CRT (Candle Range Theory), являющуюся основой кон
The   Fibonacci Confluence Toolkit   is a technical analysis tool designed to help traders identify potential price reversal zones by combining key market signals and patterns. It highlights areas of interest where significant price action or reactions are anticipated, automatically applies Fibonacci retracement levels to outline potential pullback zones, and detects engulfing candle patterns. Its unique strength lies in its reliance solely on price patterns, eliminating the need for user-define
Overview Harmonic Patterns MT5 is a technical analysis indicator designed for the MetaTrader 5 platform. It identifies and displays harmonic price patterns, such as Butterfly, Cypher, Crab, Bat, Shark, and Gartley, in both bullish and bearish directions. The indicator calculates key price levels, including entry, stop loss, and three take-profit levels, to assist traders in analyzing market movements. Visual elements and customizable alerts enhance usability on the chart. Features Detects six ha
RBreaker Gold Indicators — это краткосрочная внутридневная торговая стратегия для фьючерсов на золото, которая сочетает в себе два подхода: трендовое следование и внутридневные развороты. Она позволяет не только получать прибыль при трендовом движении, но и своевременно фиксировать прибыль при развороте рынка, открывая позиции в новом направлении. Данная стратегия на протяжении 15 лет подряд входила в десятку самых прибыльных торговых стратегий по версии американского журнала Futures Truth. Она
"Impulses and Corrections 5" создан для того, чтобы помочь трейдерам ориентироваться в рыночной ситуации. Индикатор показывает мультитаймфреймовые восходящие и нисходящие импульсы ценовых движений. Эти импульсы служат основой для определения "Базы" , состоящей из зон "Коррекции" ценовых движений, а также имеет "Потенциальные" зоны для возможных сценариев движения цены. Восходящие и нисходящие импульсы определяются на основе модифицированной формулы индикатора "Фракталы" Билла Вильямса. Последни
Это, пожалуй, самый полный индикатор автоматического распознавания гармонического ценообразования, который вы можете найти для платформы MetaTrader. Он обнаруживает 19 различных паттернов, воспринимает проекции Фибоначчи так же серьезно, как и вы, отображает зону потенциального разворота (PRZ) и находит подходящие уровни стоп-лосс и тейк-профит. [ Руководство по установке | Руководство по обновлению | Устранение неполадок | FAQ | Все продукты ] Он обнаруживает 19 различных гармонических ценов
##   ONLY GOLD ##   Тiльки Золото ## **Mercaria Professional Trading Zones - Complete Guide** ## **Mercaria Professional Trading Zones - Повний посібник** ### **How Mercaria Zones Work / Як працюють зони Mercaria** **English:** Mercaria Zones is an advanced trading indicator that identifies high-probability support and resistance areas using ZigZag extremes combined with mathematical zone calculations. The indicator works on multiple timeframes simultaneously, providing a comprehensive view
Structure King AI Signal Structure King AI Signal is a professional MetaTrader 5 trading indicator designed to help traders analyze market structure, trend direction, multi-timeframe confirmation and trade management from one clean dashboard. Key Features • Market Structure & Trend Analysis • BUY / SELL Signals • Multi-Timeframe (HTF) Confirmation • Entry Price Levels • Dynamic Stop Loss (SL) • TP1 / TP2 / TP3 Levels • ATR Volatility Analysis • ADX Trend Strength Filter • Adaptive Market Filter
Heiken_Ashi_Bars - Усовершенствованный визуализатор тренда для MT5 Обзор Heiken_Ashi_Bars — это мощный, визуально интуитивный пользовательский индикатор, разработанный для фильтрации рыночного шума и выделения истинного базового тренда. Традиционные свечные графики часто бывают хаотичными, что приводит к ложным сигналам и преждевременным выходам. Усредняя ценовые данные, этот индикатор сглаживает движение цены, что значительно облегчает обнаружение продолжения тренда, разворотов и прибыльных зо
CosmiCLab SMC FIBO CosmiCLab SMC FIBO — это профессиональный торговый индикатор, основанный на концепциях Smart Money Concepts (SMC), анализе структуры рынка и уровнях Fibonacci. Индикатор автоматически определяет свинги рынка и строит уровни Fibonacci по последнему импульсному движению. Также индикатор определяет ключевые изменения структуры рынка: BOS — Break Of Structure CHOCH — Change Of Character Дополнительно отображаются сигнальные стрелки BUY / SELL при пробое структуры. Индикатор подход
PatternScope — Multi-Pattern Recognition for MT5 PatternScope is a multi-pattern recognition indicator for MetaTrader 5. It scans price action for classic chart patterns, confirms breakouts, and draws clear   Entry, Stop Loss and Take Profit   levels. A compact dashboard shows the latest pattern, bias and Risk:Reward. Patterns:   Double Top/Bottom, Triple Top/Bottom, Head and Shoulders (and inverted), Bullish & Bearish Flag, Pennant, Rising & Falling Wedge, Triangle, Rectangle, Cup and Handle —
Royal Aurum Confluence - это индикатор для MetaTrader 5, созданный для трейдеров, которым надоело гадать, где входить в рынок, где выходить и на какое движение золота можно рассчитывать. Стартовая цена: $49 . После каждых 20 покупок цена будет повышаться на $10, пока не достигнет окончательной цены $199 . Следующая цена: $59 . Royal Aurum Companion предоставляется бесплатно. Это инструмент для ручного исполнения сделок и управления позициями, предназначенный для совместной работы с Royal Aurum C
NQX Smooth Trend Flip Weekly Bias — сигнальный индикатор для MetaTrader 5: сигналы смены сглаженного тренда (сигналы подаются только в направлении недельного смещения рынка). Собственная логика NQX, которая обнаруживает смену цвета сглаженных свечей после движения. Сигналы подаются только в направлении недельного смещения рынка. Индикатор отображает предлагаемую точку входа, короткий стоп и дальние цели (3:1, 5:1, 10:1, до 20:1 на свинге); решение принимаете вы. Что отображается на графике - Стр
Premium level - это уникальный индикатор с точностью правильных прогнозов  более 80%!  Данный индикатор тестировался более двух месяцев лучшими Специалистами в области Трейдинга!  Индикатор авторский такого вы больше не где не найдете!  По скриншотах можете сами увидеть точностью данного инструмента!  1 отлично подходит для торговли бинарными опционами со временем экспирации на 1 свечу. 2 работает на всех валютных парах, акциях, сырье, криптовалютах Инструкция: Как только появляется красная стре
# DRAWDOWN INDICATOR V4.0 - The Essential Tool to Master Your Trading ## Transform Your Trading with a Complete Real-Time Performance Overview In the demanding world of Forex and CFD trading, **knowing your real-time performance** isn't a luxury—it's an **absolute necessity**. The **Drawdown Indicator V4.0** is much more than a simple indicator: it's your **professional dashboard** that gives you a clear, precise, and instant view of your trading account status. --- ## Why This Indicator
Elliott Wave Hunter - SMC Edition Elliott Wave Hunter identifies Elliott Wave 2 and Wave 5 setups and combines them with Smart Money Concepts to filter entries to high-probability zones only. Wave 2 signals mark continuation entries in the direction of the dominant Wave 1 impulse. The indicator waits for the retracement to confirm, locates an Order Block, Fair Value Gap or Liquidity Sweep zone within the impulse, then triggers only when price returns to retest that zone with a qualifying revers
The RSI Divergence + FVG Signal indicator combines Relative Strength Index (RSI) Divergence with Fair Value Gap (FVG) detection to generate high-probability buy and sell signals based on both momentum shifts and institutional imbalance zones. Core Features: RSI Divergence Detection : Identifies both regular and hidden bullish/bearish divergences between price and RSI. Divergences indicate potential trend reversals or continuation. FVG Zone Recognition : Detects Fair Value Gaps (imbalances caused
Harmonic Pattern Hunter Harmonic Pattern Hunter is a technical indicator for MetaTrader 5 that automatically identifies and draws high-probability harmonic patterns directly on the chart. It is designed to assist traders who use harmonic analysis as part of their trading methodology. How It Works The indicator scans historical and live price data for completed XABCD harmonic structures using Fibonacci ratio validation. When a valid pattern is detected, it draws the full pattern geometry, marks t
Reversal Master для MT5 Reversal Master для MT5 — это не перерисовывающийся (non-repaint) индикатор разворотов для MetaTrader 5. Он помогает находить потенциальные точки разворота рынка и показывает максимальное благоприятное движение цены после каждого исторического сигнала, чтобы лучше понимать, как цена вела себя в подобных ситуациях в прошлом. Версия для MT5 сохраняет привычную логику разворотных сигналов оригинального Reversal Master для MT4, но добавляет улучшенную визуализацию, историческ
Auto Optimized RSI   — это умный и простой в использовании стрелочный индикатор, созданный для точной торговли. Он автоматически определяет наиболее эффективные уровни покупки и продажи по RSI для выбранного символа и таймфрейма, используя симуляции на основе исторических данных. Индикатор может использоваться как самостоятельная торговая система, так и как часть вашей существующей стратегии. Особенно полезен для внутридневной торговли. В отличие от классических индикаторов RSI, которые использу
Confluence Edge Indicator — это комплексный инструмент технического анализа «всё в одном», разработанный для предоставления полного многотаймфреймового обзора рынка. Он устраняет необходимость перегружать графики множеством индикаторов, объединяя наиболее эффективные методы технического анализа в единую, удобную и интуитивно понятную панель. Индикатор не перерисовывается (non-repainting) и выполняет расчёты в режиме реального времени, основываясь исключительно на ценовом движении, объёме, импуль
Усовершенствованная Мультитаймфреймовая версия скользящей средней Хала (Hull Moving Average - HMA). Особенности Две линии индикатора Халла разных таймфреймов на одном графике. Линия HMA старшего таймфрейма определяет тренд, а линия HMA текущего таймфрейма - краткосрочные ценовые движения. Графическая панель с данными индикатора HMA на всех таймфреймах одновременно. Если на каком-либо таймфрейме HMA переключил свое направление, на панели отображается вопросительный или восклицательный знак с текс
Gfx Institutional Order Flow Pro MT5 v3.02   Live results:  https://www.mql5.com/en/ Advanced Institutional Order Flow Analytics — analyzes market structure, liquidity, order blocks, imbalances, and institutional trading conditions. Adaptive Institutional Intelligence — dynamically evaluates market conditions and setup quality using multi-factor institutional analytics. Multi-Timeframe Market Confirmation — combines structure and directional information across multiple timeframes for stronger
VibeFox WaveTrend — волны импульса, зоны перекупленности/перепроданности и точки входа VibeFox WaveTrend — это осциллятор WaveTrend реального времени для MetaTrader 5, построенный на хорошо известной логике LazyBear и VuManChu Cipher. Он рисует плавные волны wt1 и wt2 в отдельном подокне, подсвечивает моменты, когда цена выходит в экстремумы перекупленности и перепроданности, по желанию отрисовывает за ними Cipher money-flow и отмечает сигналы входа прямо на ценовом графике. Всё это собрано в од
Индикатор для точного определения точек разворота цены на всех таймфреймах и всех валютных парах. С помощью технического анализа рынка и математических моделей диагностирования, данный индикатор с большой эффективностью определяет точки разворота цены и текущее направление тренда. Данную информацию индикатор отображает на графике в виде стрелок и линий. Стрелки показывают точки разворота тренда, а линии показывают текущее направление тренда. Этот индикатор можно интегрировать в уже существующие
STRICTLY FOR BOOM INDEX ONLY!!!!! Here I bring the Maximum Trend Arrows OT1.0 MT5 indicator. This indicator is made up of a combination of different trend indicators for entries and exits, for entries an orange arrow will paint on the chart below the current market and a red flag for closing of trades and it produces buy arrows only. When the orange arrow appears, it will appear along with it's sound to notify you. The 1H timeframe is recommended, don't use it anywhere else than on the 1H timefr
С этим продуктом покупают
Trend Sniper X
Sarvarbek Abduvoxobov
4.86 (44)
Trend Sniper X — это трендовый индикатор для MetaTrader 5, работающий на нескольких таймфреймах, который помогает трейдерам точно и ясно определять направление тренда и потенциальные точки разворота. для MT4: https://www.mql5.com/en/market/product/193245 Информация о цене: Текущая цена является промо-ценой и может измениться по мере выхода предстоящих обновлений и новых функций. Бонусное предложение: Чтобы получить БЕСПЛАТНЫЙ авто-трейд советник Assistant EA для этого индикатора, пожалуйста, на
Новый король в городе — Индикатор + управление ордерами (TP1 + TP2 + TP3) + опциональный Telegram-сигнал-сендер ВКЛЮЧЁН (БЕСПЛАТНО) (ПОЛНОЦЕННАЯ ТОРГОВАЯ И СИГНАЛЬНАЯ СИСТЕМА) Gold Slayer EA Этот индикатор включает в себя продвинутую стратегию, торговую систему с настраиваемым управлением ордерами и систему mean reversion, которая сочетает расширения Envelope и поддерживается несколькими интеллектуальными фильтрами подтверждения, такими как RSI, для поиска высоковероятных точек разворота с сигн
Smart Trend Trading System — MetaTrader 5 После покупки напишите мне на MQL5, чтобы БЕСПЛАТНО получить Smart Universal Expert Advisor, а также доступ к онлайн-курсу, руководство в формате PDF и доступ к закрытой группе. STTS объединяет направление тренда, сигналы входа и выхода, зоны разворота и важные ценовые уровни прямо на графике. Торгуйте по системе вручную или подключите отдельный совместимый советник для автоматического исполнения с выбранными вами настройками. ОДНА СИСТЕМА. ЧЕТЫРЕ ТОРГОВ
Entry Points Pro показывает, где входить, где ставить стоп и каким лотом торговать — до того, как вы поставите ордер. ЦЕНА Сейчас 149 USD, и это последняя копия по этой цене. После неё цена вырастет до 199 USD, а финальная цена — 349 USD. Я зарабатываю торговлей на рынке и показываю это, поэтому мне не нужно продавать этот индикатор всем подряд. Это инструмент для трейдеров, которые думают своей головой, а не волшебная кнопка. Стрелка появляется на закрытии свечи и не перерисовывается. Две на
SuperScalp Pro
Van Minh Nguyen
4.54 (37)
SuperScalp Pro - Professional Multi-Layer Confluence Scalping System SuperScalp Pro — это продвинутый индикатор для скальпинга, который расширяет возможности классического Supertrend с помощью нескольких интеллектуальных фильтров подтверждения. Он помогает выявлять торговые возможности Buy/Sell с более высокой вероятностью успеха и значительно сокращать количество ложных сигналов. Чёткие стрелки Buy и Sell отображаются непосредственно на графике вместе с автоматически рассчитываемыми в реальном
Gann Made Easy   - это профессиональная, но при этом очень простая в применении Форекс система, основанная на лучших принципах торговли по методам господина У.Д. Ганна. Индикатор дает точные BUY/SELL сигналы, включающие в себя уровни Stop Loss и Take Profit. ПОЖАЛУЙСТА, СВЯЖИТЕСЬ СО МНОЙ ПОСЛЕ ПОКУПКИ, ЧТОБЫ ПОЛУЧИТЬ ТОРГОВЫЕ ИНСТРУКЦИИ И ОТЛИЧНЫЕ ДОПОЛНИТЕЛЬНЫЕ ИНДИКАТОРЫ БЕСПЛАТНО! Вероятно вы уже не раз слышали о торговли по методам Ганна. Как правило теория Ганна отпугивает от себя не только
ULTRA - это технический индикатор, который который работает по принципу “Все включено” - самостоятельно анализирует рынок, дает торговые сигналы, показывает уровни для установки стоп лосс, а также подсказывает когда нужно закрывать сделки, чтобы получить профит или минимизировать убыток. То есть, не важно, что ты не умеешь анализировать рынок, определять уровни - где поставить SL или плохо совладаешь с мани-менеджментом. ULTRA все это сделает вместо тебя! БОНУС ДЛЯ ПОКУПАТЕЛЯ : После покупки ULT
Boba Analysis Suite
Trade Ready Solutions LLC
5 (2)
Boba Analysis Suite Boba Analysis Suite — аналитический индикатор для MetaTrader 5. Он объединяет структуру рынка, значимые ценовые зоны и общий рыночный контекст в одном представлении на графике. Индикатор разработан на основе практического опыта трейдера и наставника по трейдингу. Он помогает выстроить последовательный процесс анализа: оценивать направление рынка, определять важные уровни и рассматривать несколько таймфреймов в совокупности. Анализ с учётом контекста Значение отдельных сигнало
Следующее обновление — версия 2.52 уже скоро! [НОВОЕ] Приготовьтесь к 4 новым важным функциям, призванным улучшить ваш анализ рынка и торговый процесс. Мы выводим анализ рынка на новый уровень с помощью 4 новых функций, разработанных с учётом ваших потребностей в трейдинге. Представляем: 1. TRADE OVERVIEW DASHBOARD 2. CONFLUENCE AT ZONE 3. STRONG & WEAK HIGH/LOW 4. OTE 1. TRADE OVERVIEW DASHBOARD Панель, которая помогает легче понимать общую картину рынка, предоставляя рекомендации для поддержк
M1 SNIPER   — это простая в использовании торговая система. Это стрелочный индикатор, разработанный для тайм фрейма M1. Индикатор можно использовать как отдельную систему для скальпинга на тайм фрейме M1, а также как часть вашей существующей торговой системы. Хотя эта торговая система была разработана специально для торговли на M1, ее можно использовать и с другими тайм фреймами. Первоначально я разработал этот метод для торговли XAUUSD и BTCUSD. Но я считаю этот метод полезным и для торговли на
FiboSniper Pro – Multi-Filter Fibonacci System with Auto SL/TP and Control Panel FiboSniper Pro — это технический индикатор, который объединяет динамические Fibonacci Envelopes с несколькими фильтрами подтверждения для формирования отборных сигналов Buy и Sell. Уровни Fibonacci рассчитываются на основе Moving Average и ATR, а затем фильтруются с помощью ADX, EMA, RSI, ATR, Volume, Time и структуры свечи. Индикатор отображает на графике автоматические уровни Stop Loss и Take Profit на основе ATR,
Auto Optimized SpeedAngle — это система векторизации импульса институционального уровня, которая исключает подгонку под исторические данные (curve-fitting) за счет непрерывной форвард-оптимизации (Walk-Forward Optimization, WFO). Вместо того чтобы полагаться на статические входные параметры, которые теряют эффективность при смене рыночных режимов, индикатор динамически перекалибрует свои настройки, используя валидацию на вневыборочных данных (Out-of-Sample, OOS). Это гарантирует, что отображаемы
Adaptive Price Action Engine Купи индикатор — получи советник (EA) к нему бесплатно Самооптимизирующийся мульти-таймфреймовый анализ тренда и свечных моделей Рынок постоянно меняется — и не каждая модель Price Action имеет одинаковую ценность в разных рыночных режимах. Adaptive Price Action Engine создан для адаптации к изменяющимся рыночным условиям, объединяя трендовую структуру, мульти-таймфреймовый анализ, свечные модели и статистическую оптимизацию в единой аналитической системе. Два адапти
Crystal Heikin Ashi Signals—Professional Trend & Signal Detection Indicator Advanced Heikin Ashi Visualization with Intelligent Signal System for Manual & Automated Trading Final Price: $149 ---------> Price goes up $10 after every 10 sales . Limited slots available — act fast . Overview User Guide PDF Crystal Heikin Ashi Signals is a professional-grade MetaTrader 5 indicator that combines pure Heikin Ashi candle visualization with an advanced momentum-shift detection system. Designed for both m
Scalper Vault — это мощная, полноценная торговая система, созданная для трейдеров, которые стремятся к стабильным результатам в внутридневной торговле. Этот высокоточный индикатор представляет собой комплексное, самостоятельное торговое решение, обеспечивающее аналитику профессионального (институционального) уровня как для торговли на рынке Forex, так и для работы с бинарными опционами. Пожалуйста, свяжитесь со мной после покупки, чтобы получить мои торговые советы, а также отличный бонус! Исклю
Trend Catcher   анализирует движения рыночных цен, используя комбинацию собственных и индивидуально разработанных адаптивных индикаторов анализа тренда. Он определяет истинное направление рынка, отфильтровывая краткосрочные шумы и фокусируясь на силе импульса, расширении волатильности и поведении ценовой структуры. Он также использует комбинацию сглаживающих и фильтрующих тренд индикаторов, таких как скользящие средние, RSI и фильтры волатильности. Мониторинг реальных операций, а также другие
SIO Oscillator: самооптимизирующийся осциллятор дисбаланса семивариаций Купите индикатор и получите советник (EA) на его основе БЕСПЛАТНО. Большинство осцилляторов воспринимают любое движение цены одинаково. SIO разделяет давление покупателей и продавцов и измеряет дисбаланс между ними, показывая, какая сторона действительно контролирует рынок. Когда дисбаланс достигает экстремума, SIO выдаёт чёткий сигнал с уровнями входа, Stop Loss и Take Profit. Главное отличие SIO в том, что он не полагается
Volatility Master for MetaTrader is a real-time dashboard tool that scans up to  50 symbols  to identify high-volatility , trending markets instantly. With bullish/bearish signals, customizable alerts, and a user-friendly interface, it helps you avoid range-bound conditions and focus on high-probability trades. Clarity leads to confidence. Trade confidently and protect your capital effectively with this powerful dashboard. We don't offer free or bonus indicators in exchange of reviews from you.
Мультивалютный индикатор силы и импульса MT5 Dynamic Forex28 Navigator — это развитие наших давних популярных индикаторов, объединяющее силу трёх в одном: Advanced Currency Strength28 Indicator (700 отзывов) Advanced Currency IMPULSE with ALERT (530 отзывов) CS28 Combo Signals (недавний бонус) Оба индикатора-предшественника вместе получили более 1,200 отзывов на MQL5 Market и с 2016 года являются неотъемлемой частью сообщества MT4. Dynamic Forex28 Navigator MT5 переносит ту же проверенную логику
AriFocus - Non-Repainting Buy/Sell Signals AriFocus - one clear signal. AriFocus marks buy and sell signals directly on the chart and suggests a stop-loss level for each one. Every signal is confirmed on bar close and never repaints. - Buy/sell arrows, confirmed on bar close - Suggested stop-loss level for every signal - Trend band and candle coloring to show direction at a glance - 10 ready-made presets, or your own settings (14 calculation methods) - Pop-up, push and email alerts with entr
Neuro Poseidon - новый индикатор от Дарьи Резуевой. Он сочетает точные торговые сигналы с адаптивными уровнями TP/SL , в результате создавая максимально выгодные сделки! TO SWITCH TO   ENG   PLEASE CHOOSE IT IN THE UPPER-RIGHT CORNER OF THE WEBSITE Напишите мне и получите  Neuro Poseidon Assistant  в подарок для автоматизации вашей торговли! Что отличает его от других индикаторов? 1. Доказанная прибыльность на всех активах и таймфреймах 2. На графике присутствуют только подтвержденные сигналы н
Свинг-трейдинг - это первый индикатор, предназначенный для обнаружения колебаний в направлении тренда и возможных разворотов. Он использует базовый подход свинговой торговли, широко описанный в торговой литературе. Индикатор изучает несколько векторов цен и времени для отслеживания направления совокупного тренда и выявляет ситуации, когда рынок перепродан или перекуплен и готов к исправлению. [ Руководство по установке | Руководство по обновлению | Устранение неполадок | FAQ | Все продукты ] П
Azimuth Pro
Ottaviano De Cicco
5 (7)
Azimuth Pro V2: Синтетический фрактальный структурный анализ и подтверждённые входы для MT5 Обзор Azimuth Pro — многоуровневый индикатор свинговой структуры от Merkava Labs . Четыре вложенных уровня свингов, привязанный к свингам VWAP, определение ABC-паттернов, трёхтаймфреймная структурная фильтрация и подтверждённые входы на закрытой свече — один график, один рабочий процесс от микро-свингов до макро-циклов. Это не слепой сигнальный продукт. Это рабочий процесс, основанный на структуре, для т
SkyHammer Signal Pro Профессиональный трендовый индикатор без перерисовки с фиксированными уровнями Entry, SL и TP SkyHammer Signal Pro — это структурированный индикатор тренда и momentum, созданный для трейдеров, которым нужны четкие, зафиксированные и проверяемые торговые сигналы. Лучше всего он работает на младших таймфреймах, таких как M1 и M5 . Индикатор не пытается предсказывать вершины или основания рынка. Вместо этого он ожидает подтвержденную рыночную структуру, направление тренда, силу
Станьте Breaker Trader и получайте прибыль от изменений структуры рынка по мере изменения цены. Индикатор выключателя блока ордеров определяет, когда тренд или движение цены приближаются к истощению и готовы развернуться. Он предупреждает вас об изменениях в структуре рынка, которые обычно происходят, когда произойдет разворот или серьезный откат. Индикатор использует собственный расчет, который определяет прорывы и ценовой импульс. Каждый раз, когда новый максимум формируется около возможной
Advance AI Scanner is a multi-symbol analysis indicator for MetaTrader 5. It scans Forex pairs, metals, energy, stock indices and cryptocurrencies at the same time and rates each instrument with its own self-training model. It explains in plain English what moved each market and why, and it estimates how far upcoming economic news usually moves each symbol, measured on your broker's own price history. $199 instead of $499. 10 copies left at this price. One time purchase  Installation and User
Break and Retest Hunter is a powerful MetaTrader 5 indicator designed to automatically identify support and resistance levels, breakout structures, and potential retest opportunities in real time. Bonus Indicator: After purchasing Break and Retest Hunter , contact me to receive Trade Indicator Assistant EA completely free as a bonus utility. $65 for the next 10 copies . Next price is $120.  Combining adaptive market analysis, clear BUY/SELL signals, Fibonacci-based profit targets, and a premiu
DayTrader PRO DayTrader PRO — это передовой торговый индикатор, сочетающий фильтр Лагерра (Laguerre Filter) Джона Элерса с мощным движком автоматической оптимизации. Вместо использования фиксированных параметров индикатор автоматически подбирает оптимальные настройки на основе недавних рыночных условий, что позволяет адаптироваться к изменяющейся волатильности без необходимости ручной корректировки. Индикатор генерирует четкие сигналы на ПОКУПКУ и ПРОДАЖУ, а также адаптивные уровни Stop Loss и T
Bill Williams Advanced предназначен для автоматического анализа графика по системе " Profitunity " Билла Уильямса. Индикатор анализирует сразу четыре таймфрейма. Инструкция/Мануал ( Обязательно читайте перед приобретением ) Преимущества 1. Анализирует график по системе "Profitunity" Билла Уильямса. Сигналы помещает в таблицу в углу экрана и на график цены. 2. Находит все известные сигналы АО и АС, а также сигналы зон. Оснащён трендовым фильтром по Аллигатору. 3. Находит "Дивергентный бар", а та
Apex Patterns PRO Купите индикатор — получите Expert Advisor на его основе БЕСПЛАТНО. Самооптимизирующаяся система анализа графических паттернов и пробоев Традиционные сканеры паттернов полагаются на фиксированные входные параметры, что часто приводит к снижению их эффективности при изменении рыночной волатильности и структуры. Apex Patterns PRO разработан для адаптации к меняющимся рыночным условиям, объединяя распознавание структурных графических паттернов, фильтрацию по моментуму и статистич
Другие продукты этого автора
This indicator presents an alternative approach to identify Market Structure. The logic used is derived from learning material created by   DaveTeaches (on X) Upgrade v1.10: add option to put protected high/low value to buffer (figure 11, 12) When quantifying Market Structure, it is common to use fractal highs and lows to identify "significant" swing pivots. When price closes through these pivots, we may identify a Market Structure Shift (MSS) for reversals or a Break of Structure (BOS) for co
This script automatically calculates and updates ICT's daily IPDA look back time intervals and their respective discount / equilibrium / premium, so you don't have to :) IPDA stands for Interbank Price Delivery Algorithm. Said algorithm appears to be referencing the past 20, 40, and 60 days intervals as points of reference to define ranges and related PD arrays. Intraday traders can find most value in the 20 Day Look Back box, by observing imbalances and points of interest. Longer term traders c
This is a Forex Scalping Trading Sytem based on the Bollinger Bands.  Pairs:Major Time frame: 1M or higher. Spread max:0,0001.  Indicators (just suggestion) Bollinger bands (20, 2); ADX (14 period); RSI   (7 period ). Y ou should only trade this system between 2am to 5am EST, 8am to 12am EST and 7.30pm to 10pm EST. Do not scalp 30 minutes before a orange or red news  report and not for a hour afterwards.   Setup: is for price to move above the lower or lower Bollinger Bands, RSI raise above the
FREE
This is addition of  Effective SV squeeze momentum  that add bolliger band and Keltner channel to chart window.  Squeeze momentum introduced by “John Carter”, the squeeze indicator for MT5 represents a volatility-based tool. Regardless, we can also consider the squeeze indicator as a momentum indicator, as many traders use it to identify the direction and strength of price moves. In fact, the Tradingview  squeeze indicator shows when a financial instrument is willing to change from a trending ma
FREE
All about Smart Money Concepts Strategy: Market struture: internal or swing BOS, CHoCH; Orderblock; Liquity equal; Fair Value Gap with Consequent encroachment, Balanced price range; Level with Previous month, week, day level or in day level (PMH, PWH, PDH, HOD); BuySell Stops Liquidity (BSL, SSL); Liquidity Void Long Wicks; Premium and Discount; Candle pattern ... "Smart Money Concepts" ( SMC ) is a fairly new yet widely used term amongst price action traders looking to more accurately navigate
The indicator   returning pivot point based trendlines with highlighted breakouts . Trendline caculated by pivot point and other clue are ATR, Stdev.   The indicator also includes integrated alerts for  trendlines  breakouts   and foward message to Telegram channel or group if you want. Settings ·            Lookback bar: Default 200 is number of bar caculate when init indicator. ·            Length:  Pivot points  period ·            Slope Calculation Method: Determines how this lope is calcula
This all-in-one indicator displays real-time market structure (internal & swing BOS / CHoCH), order blocks, premium & discount zones, equal highs & lows, and much more...allowing traders to automatically mark up their charts with widely used price action methodologies. Following the release of our Fair Value Gap script, we received numerous requests from our community to release more features in the same category. //------------------------------------// Version 1.x has missing functions + PDAr
The Breaker Blocks with Signals indicator aims to highlight a complete methodology based on breaker blocks. Breakout signals between the price and breaker blocks are highlighted and premium/discount swing levels are included to provide potential take profit/stop loss levels. This script also includes alerts for each signal highlighted.   SETTINGS   Breaker Blocks Length: Sensitivity of the detected swings used to construct breaker blocks. Higher values will return longer term break
The ICT Concepts indicator regroups core concepts highlighted by trader and educator "The Inner Circle Trader" (ICT) into an all-in-one toolkit. Features include Market Structure (MSS & BOS), Order Blocks, Imbalances, Buyside/Sellside Liquidity, Displacements, ICT Killzones, and New Week/Day Opening Gaps. It’s one kind of Smart money concepts.   USAGE:   Please read this   document  !      DETAILS Market Structure Market structure labels are constructed from price breaking a prior extreme
The FollowLine indicator is a trend following indicator. The blue/red lines are activated when the price closes above the upper Bollinger band or below the lower one. Once the trigger of the trend direction is made, the FollowLine will be placed at High or Low (depending of the trend). An ATR filter can be selected to place the line at a more distance level than the normal mode settled at candles Highs/Lows. Some features: + Trend detech + Reversal signal + Alert teminar / mobile app
The ICT Silver Bullet indicator is inspired from the lectures of "The Inner Circle Trader" (ICT) and highlights the Silver Bullet (SB) window which is a specific 1-hour interval where a Fair Value Gap (FVG) pattern can be formed. A detail document about ICT Silver Bullet here . There are 3 different Silver Bullet windows (New York local time): The London Open Silver Bullet (3 AM — 4 AM ~ 03:00 — 04:00) The AM Session Silver Bullet (10 AM — 11 AM ~ 10:00 — 11:00) The PM Session Silver Bullet (2
This indicator shows when user set sessions are active and returns various tools + metrics using the closing price within active sessions as an input. Users have the option to change up to 4 session times. The indicator will increasingly lack accuracy when the chart timeframe is higher than 1 hour. Settings Sessions Enable Session: Allows to enable or disable all associated elements with a specific user set session. Session Time: Opening and closing times of the user set session in the  
The liquidity swings indicator highlights swing areas with existent trading activity. The number of times price revisited a swing area is highlighted by a zone delimiting the swing areas. Additionally, the accumulated volume within swing areas is highlighted by labels on the chart. An option to filter out swing areas with volume/counts not reaching a user-set threshold is also included. This indicator by its very nature is not real-time and is meant for descriptive analysis alongside other com
The SuperTrend AI indicator is a novel take on bridging the gap between the K-means clustering machine learning method & technical indicators. In this case, we apply K-Means clustering to the famous SuperTrend indicator.   USAGE Users can interpret the SuperTrend AI trailing stop similarly to the regular SuperTrend indicator. Using higher minimum/maximum factors will return longer-term signals. (image 1) The displayed performance metrics displayed on each signal allow for a deeper interpretat
OVERVIEW A Lorentzian Distance Classifier (LDC) is a Machine Learning classification algorithm capable of categorizing historical data from a multi-dimensional feature space. This indicator demonstrates how Lorentzian Classification can also be used to predict the direction of future price movements when used as the distance metric for a novel implementation of an Approximate Nearest Neighbors (ANN) algorithm. This indicator provide signal as buffer, so very easy for create EA from this indi
An Implied Fair Value Gap (IFVG) is a three candles imbalance formation conceptualized by ICT that is based on detecting a larger candle body & then measuring the average between the two adjacent candle shadows. This indicator automatically detects this imbalance formation on your charts and can be extended by a user set number of bars. The IFVG average can also be extended until a new respective IFVG is detected, serving as a support/resistance line. Alerts for the detection of bullish/be
Consolidation is when price is moving inside a clear trading range. When prices are consolidated it shows the market maker placing orders on both sides of the market. This is mainly due to manipulate the un informed money. This indicator automatically identifies consolidation zones and plots them on the chart. The method of determining consolidation zones is based on pivot points and ATR, ensuring precise identification. The indicator also sends alert notifications to users when a new consolida
Wyckoff sweep and order block detector I got tired of marking the same structure by hand every morning, so I wrote this. It looks for one thing only: the Wyckoff sequence that ends with a liquidity sweep and a pullback into the order block that started the move. When all the pieces line up, it draws them and tells you. That's the whole job. It doesn't predict, it doesn't score setups out of ten, and it won't tell you how much to risk. It marks structure that's already there and saves you the ey
Created by imjesstwoone and mickey1984, this trade model attempts to capture the expansion from the 10:00-14:00 EST 4h candle using just 3 simple steps. All of the information presented in this description has been outlined by its creators, all I did was translate it to MQL4. All core settings of the trade model may be edited so that users can test several variations, however this description will cover its default, intended behavior using NQ 5m as an example. Step 1 is to identify our Price Ra
The Buyside & Sellside Liquidity indicator aims to detect & highlight the first and arguably most important concept within the ICT trading methodology,   Liquidity   levels. SETTINGS Liquidity Levels Detection Length: Lookback period Margin: Sets margin/sensitivity for a liquidity level detection Liquidity Zones Buyside Liquidity Zones: Enables display of the buyside liquidity zones. Margin: Sets margin/sensitivity for the liquidity zone boundaries. Color: Color option for buysid
The   Liquidation Estimates (Real-Time)   experimental indicator attempts to highlight real-time long and short liquidations on all timeframes. Here with liquidations, we refer to the process of forcibly closing a trader's position in the market. By analyzing liquidation data, traders can gauge market sentiment, identify potential support and resistance levels, identify potential trend reversals, and make informed decisions about entry and exit points. USAGE (Img 1)    Liquidation refers
The   ICT Unicorn Model   indicator highlights the presence of "unicorn" patterns on the user's chart which is derived from the lectures of   "The Inner Circle Trader" (ICT) . Detected patterns are followed by targets with a distance controlled by the user.   USAGE (image 2) At its core, the ICT Unicorn Model relies on two popular concepts, Fair Value Gaps and Breaker Blocks. This combination highlights a future area of support/resistance. A   Bullish Unicorn Pattern   consists out of:
The Inversion Fair Value Gaps (IFVG) indicator is based on the inversion FVG concept by ICT and provides support and resistance zones based on mitigated Fair Value Gaps (FVGs). Image 1   USAGE Once mitigation of an FVG occurs, we detect the zone as an "Inverted FVG". This would now be looked upon for potential support or resistance. Mitigation occurs when the price closes above or below the FVG area in the opposite direction of its bias. (Image 2) Inverted Bullish FVGs Turn into Potenti
Overview The   Volume SuperTrend AI   is an advanced technical indicator used to predict trends in price movements by utilizing a combination of traditional SuperTrend calculation and AI techniques, particularly the k-nearest neighbors (KNN) algorithm. The Volume SuperTrend AI is designed to provide traders with insights into potential market trends, using both volume-weighted moving averages (VWMA) and the k-nearest neighbors (KNN) algorithm. By combining these approaches, the indicator
OVERVIEW K-means is a clustering algorithm commonly used in machine learning to group data points into distinct clusters based on their similarities. While K-means is not typically used directly for identifying support and resistance levels in financial markets, it can serve as a tool in a broader analysis approach. Support and resistance levels are price levels in financial markets where the price tends to react or reverse. Support is a level where the price tends to stop falling and m
Introducing the Reversal and Breakout Signals   This innovative tool is crafted to enhance your chart analysis by identifying potential reversal and breakout opportunities directly on your charts. It's designed with both novice and experienced traders in mind, providing intuitive visual cues for better decision-making. Let's dive into the key features and how it operates: ###   Key Features:   Dynamic Period Settings:   Customize the sensitivity of the indicator with user-def
Introduction One of the patterns in "RTM" is the "QM" pattern, also known as "Quasimodo". Its name is derived from the appearance of "Hunchback of Notre-Dame" from Victor Hugo's novel. It is a type of "Head and Shoulders" pattern.   Formation Method   Upward Trend In an upward trend, the left shoulder is formed, and the price creates a new peak higher than the left shoulder peak . After a decline, it manages to break the previous low and move upward again. We expect the price to
MOST is applied on this RSI moving average with an extra default option added VAR/VIDYA (Variable Index Dynamic Moving Average) MOST added on RSI has a Moving Average of RSI and a trailing percent stop level of the Moving Average that can be adjusted by changing the length of the MA and %percent of the stop level. BUY SIGNAL when the Moving Average Line crosses above the MOST Line LONG CONDITION when the Moving Average is above the MOST SELL SIGNAL when Moving Average Line crosses below MOS
The indicator show Higher timeframe candles for ICT technical analisys Higher time frames reduce the 'noise' inherent in lower time frames, providing a clearer, more accurate picture of the market's movements. By examining higher time frames, you can better identify trends, reversals, and key areas of support and resistance. The Higher Time Frame Candles indicator overlays higher time frame data directly onto your current chart. You can easily specify the higher time frame candles you'd li
Introduction The Price Action, styled as the "Smart Money Concept" or "SMC," was introduced by Mr. David J. Crouch in 2000 and is one of the most modern technical styles in the financial world. In financial markets, Smart Money refers to capital controlled by major market players (central banks, funds, etc.), and these traders can accurately predict market trends and achieve the highest profits. In the "Smart Money" style, various types of "order blocks" can be traded. This indicator uses
Фильтр:
Нет отзывов
Ответ на отзыв