Harmonic Scanner MT5
- Индикаторы
-
Allan Aparece Ninal
 Я разрабатываю индикаторы и советники (Expert Advisors) для MetaTrader 5.
Как я работаю:
- Каждый индикатор проверяется на перерисовку: сигналы определяются только на закрытых барах, а тест на каждом тике подтверждает, что они потом не меняются. - Версия: 1.0
- Активации: 5
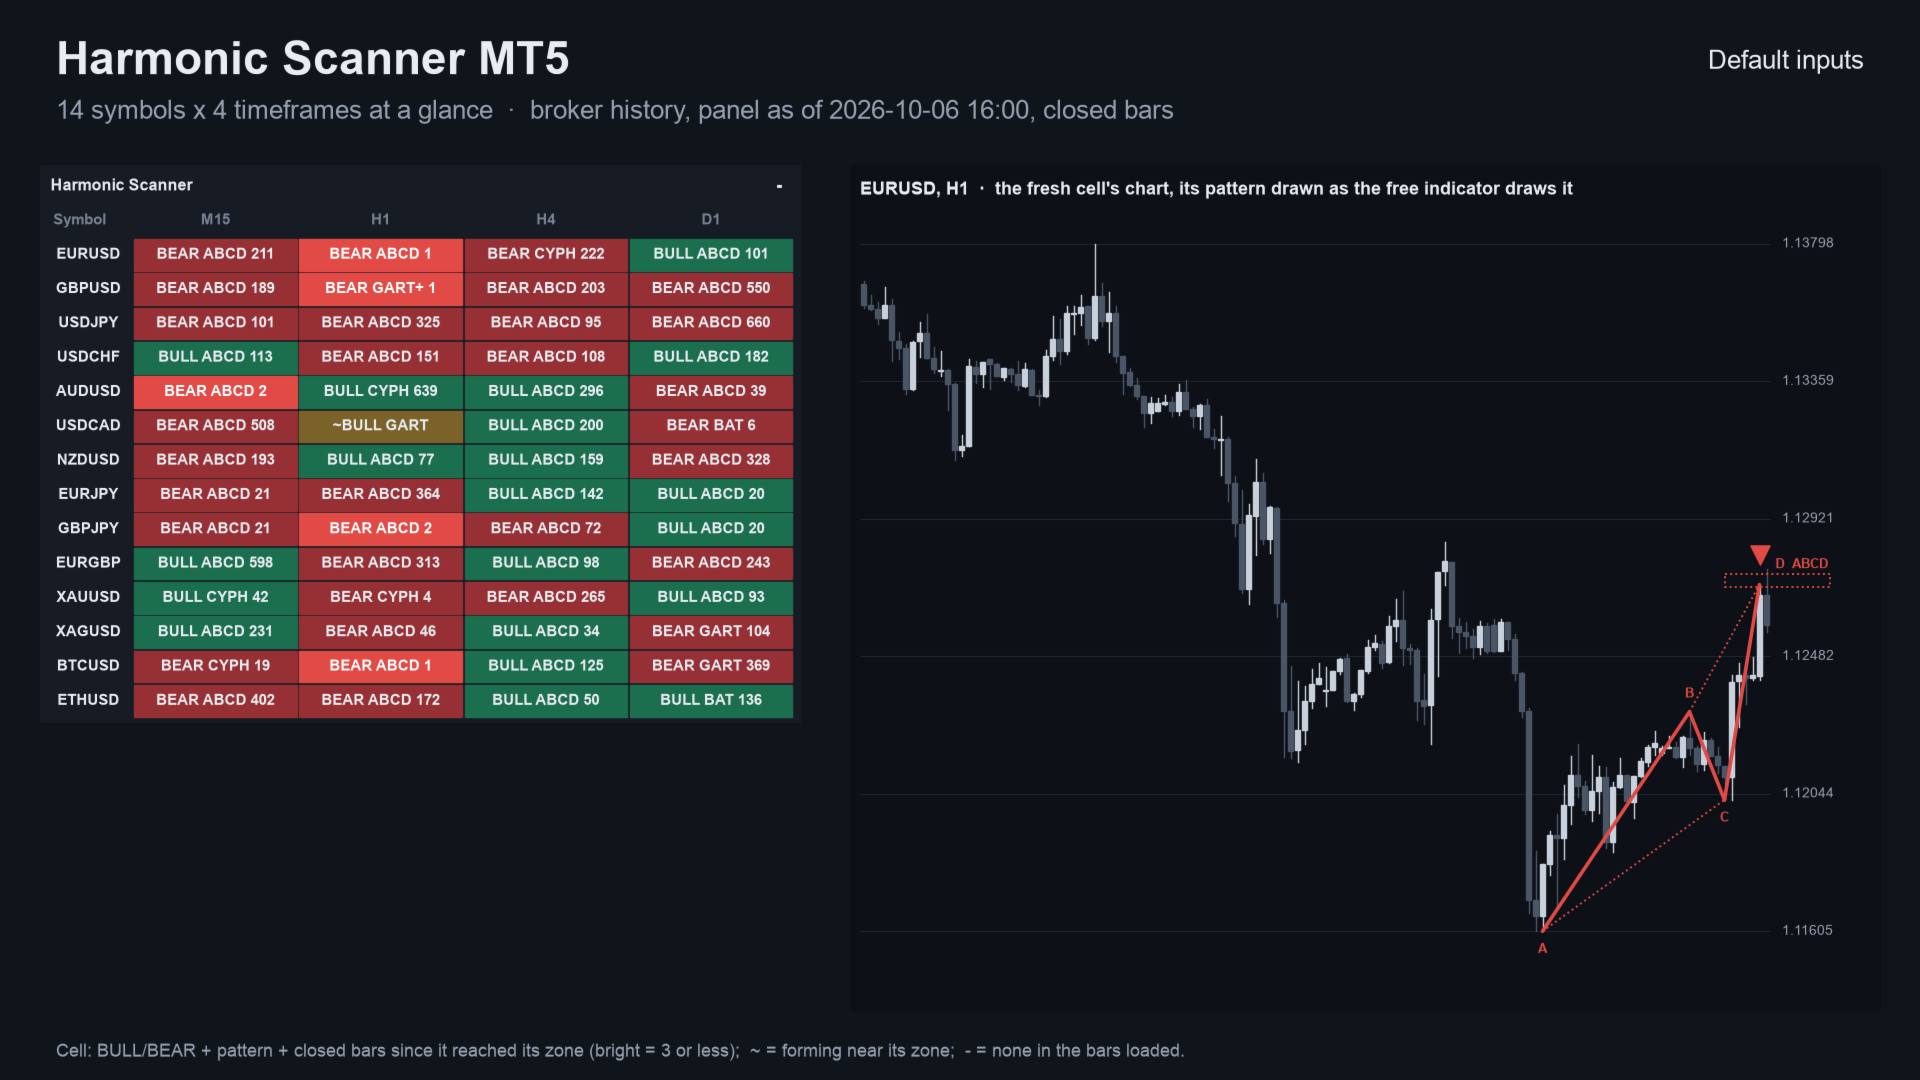
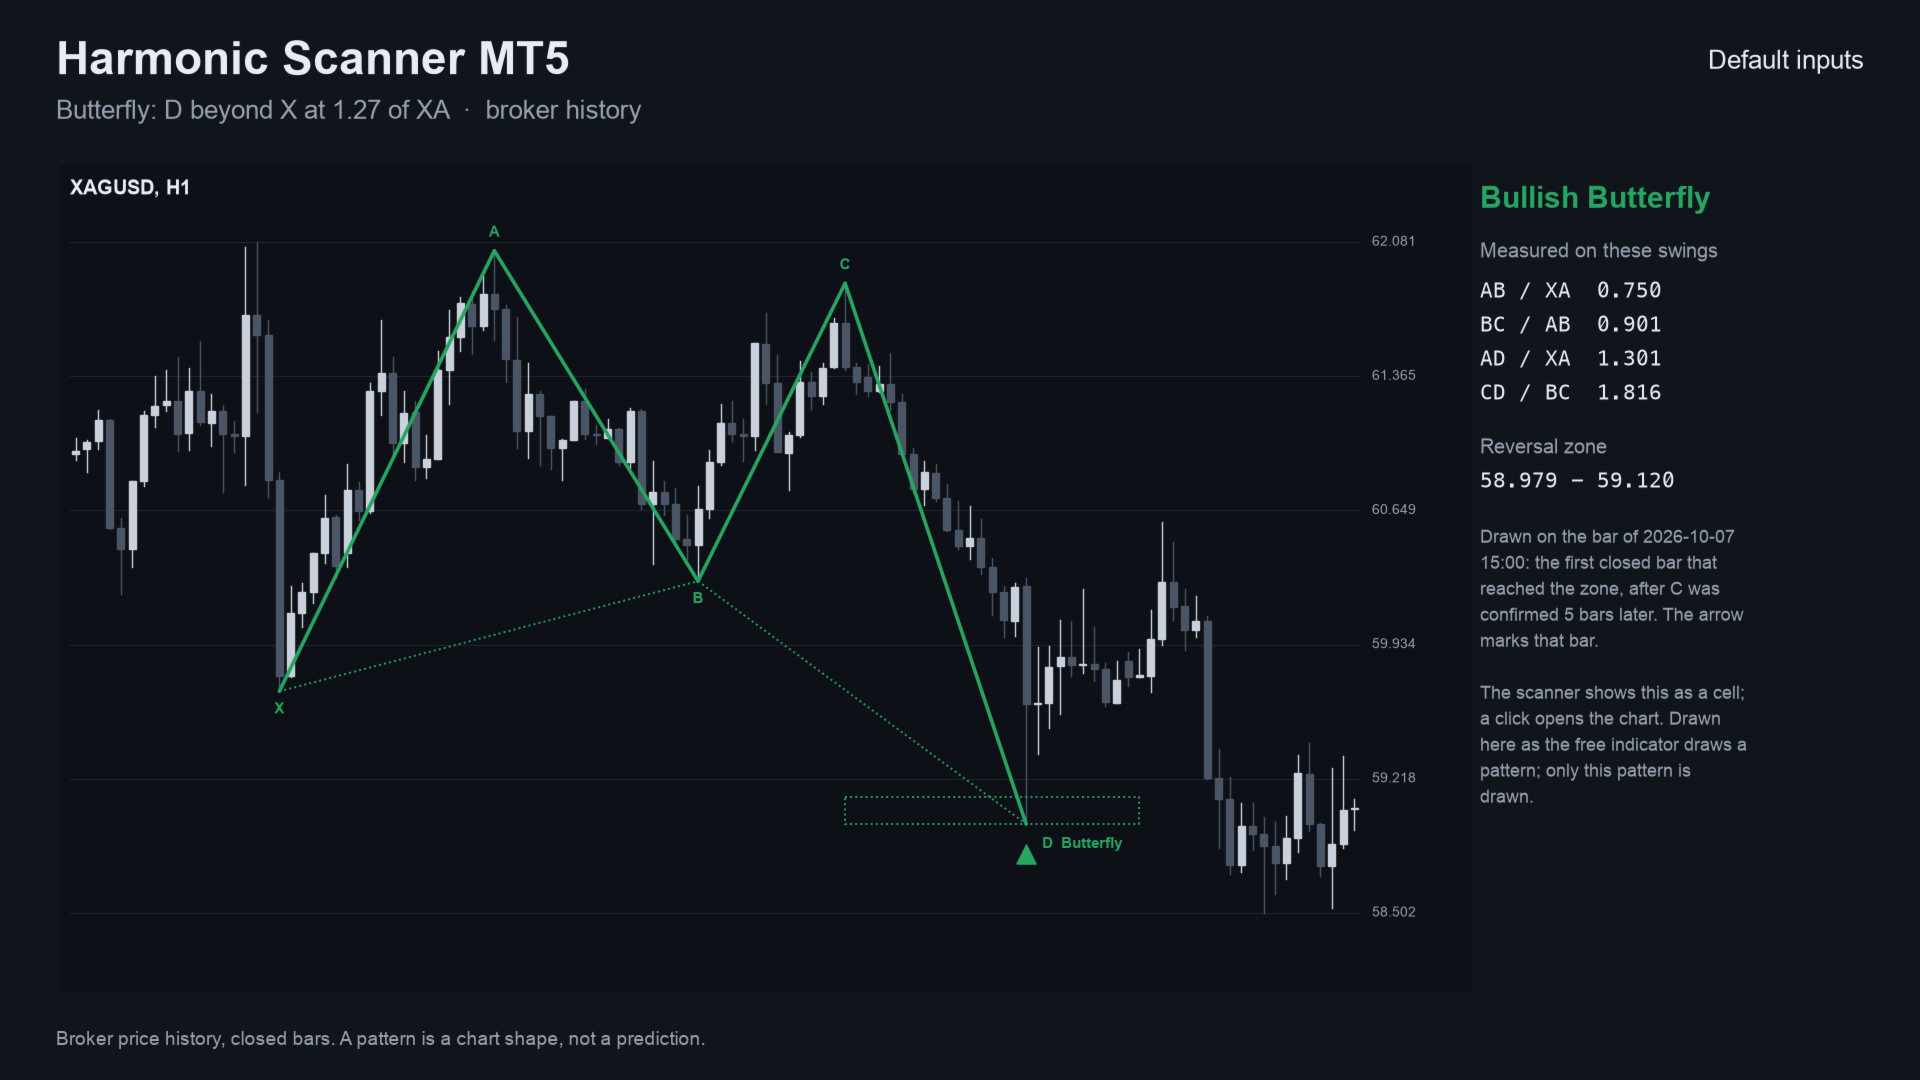
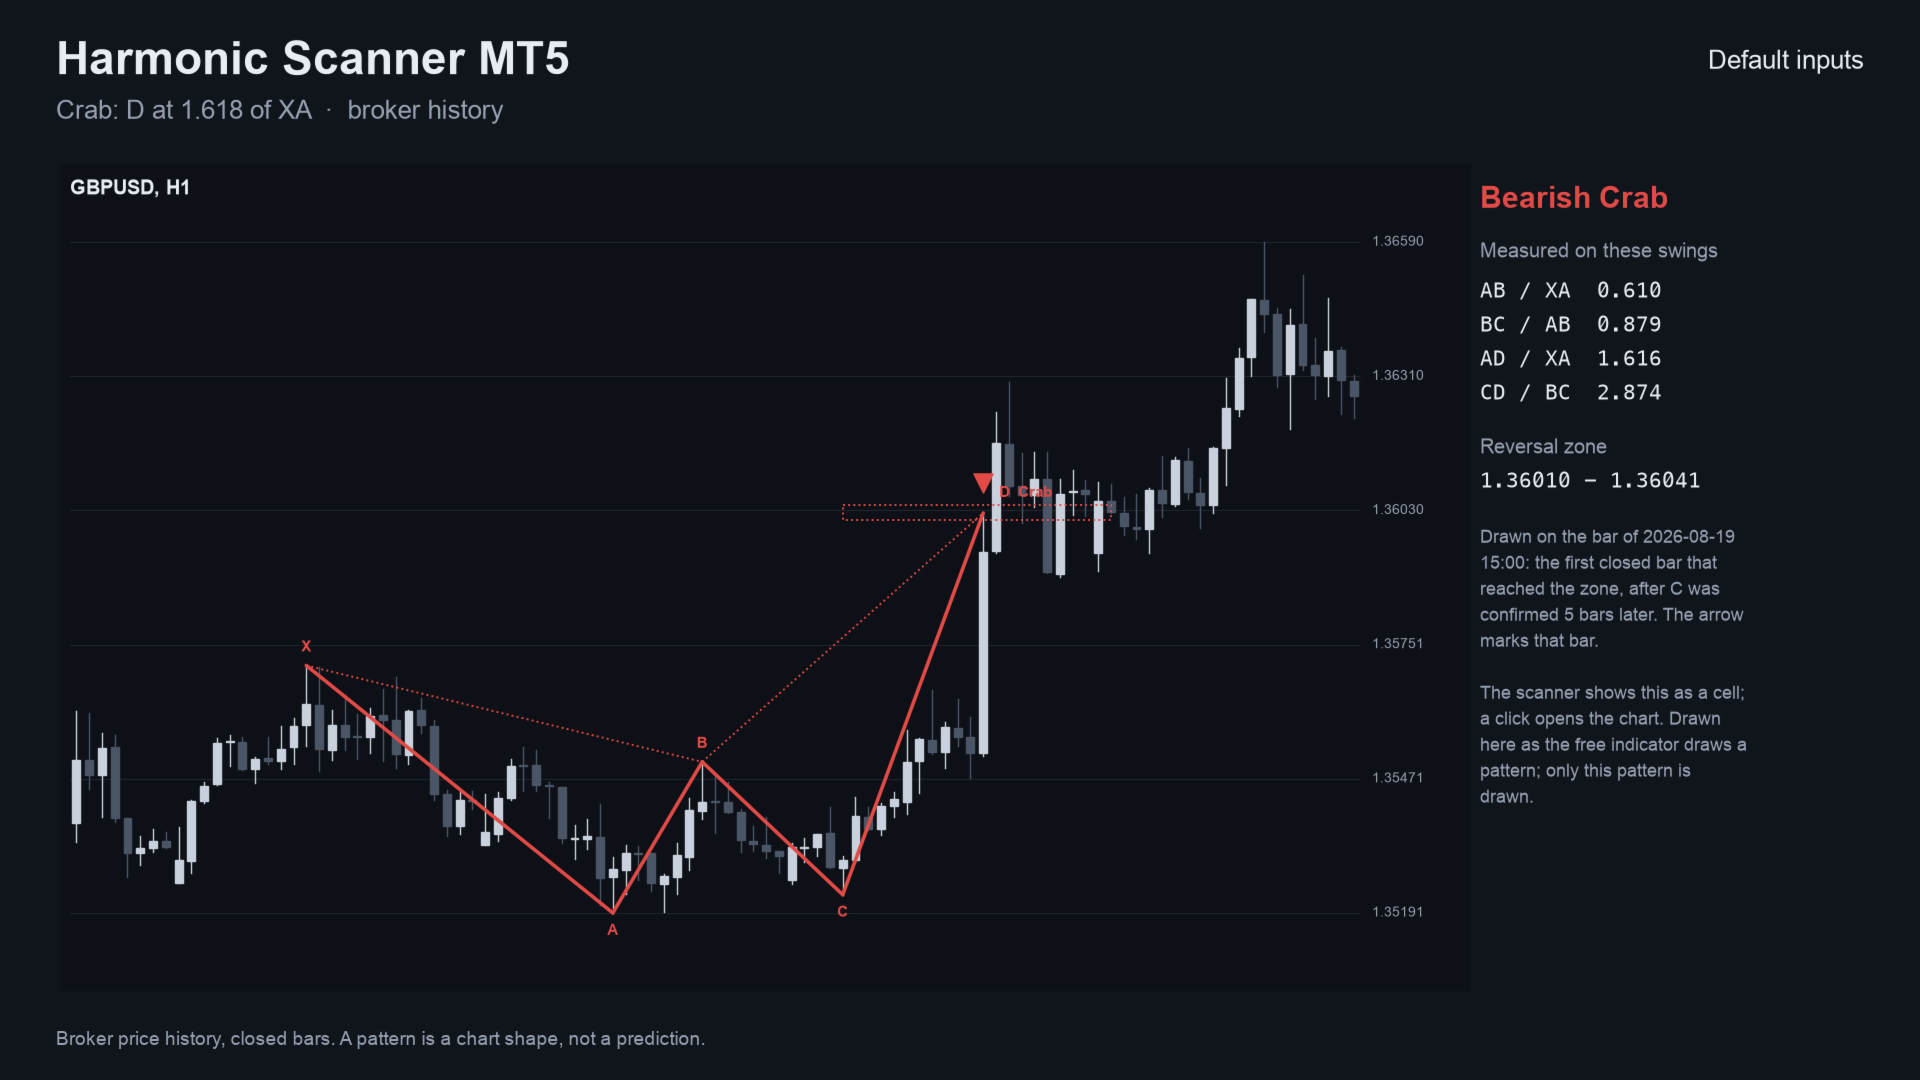
Harmonic Scanner MT5 watches many symbols and timeframes at once for eight harmonic patterns: ABCD, Gartley, Bat, Alternate Bat, Butterfly, Crab, Deep Crab and Cypher. One panel shows where a pattern has just reached its potential reversal zone. It also shows where one is forming close to its zone, and how long ago the last one completed.
It uses only confirmed swings and closed bars. A completed pattern in a cell never changes afterwards.
Quick start
- Attach the indicator to any chart. The panel appears in the corner you choose.
- Choose the symbols (Market Watch or your list) and the timeframes. The default is M15,H1,H4,D1.
- Keep "near the zone" at 20% of XA and both alerts on, or change them.
- Click a cell to open that symbol and timeframe. Set the outcome table's stop to the one you would use.
Standalone: everything is built in. You do not need to buy or install any other product named on this page.
What it does
- Panel of symbols (Market Watch or your list) by timeframes (M15, H1, H4 and D1 by default, or any you choose).
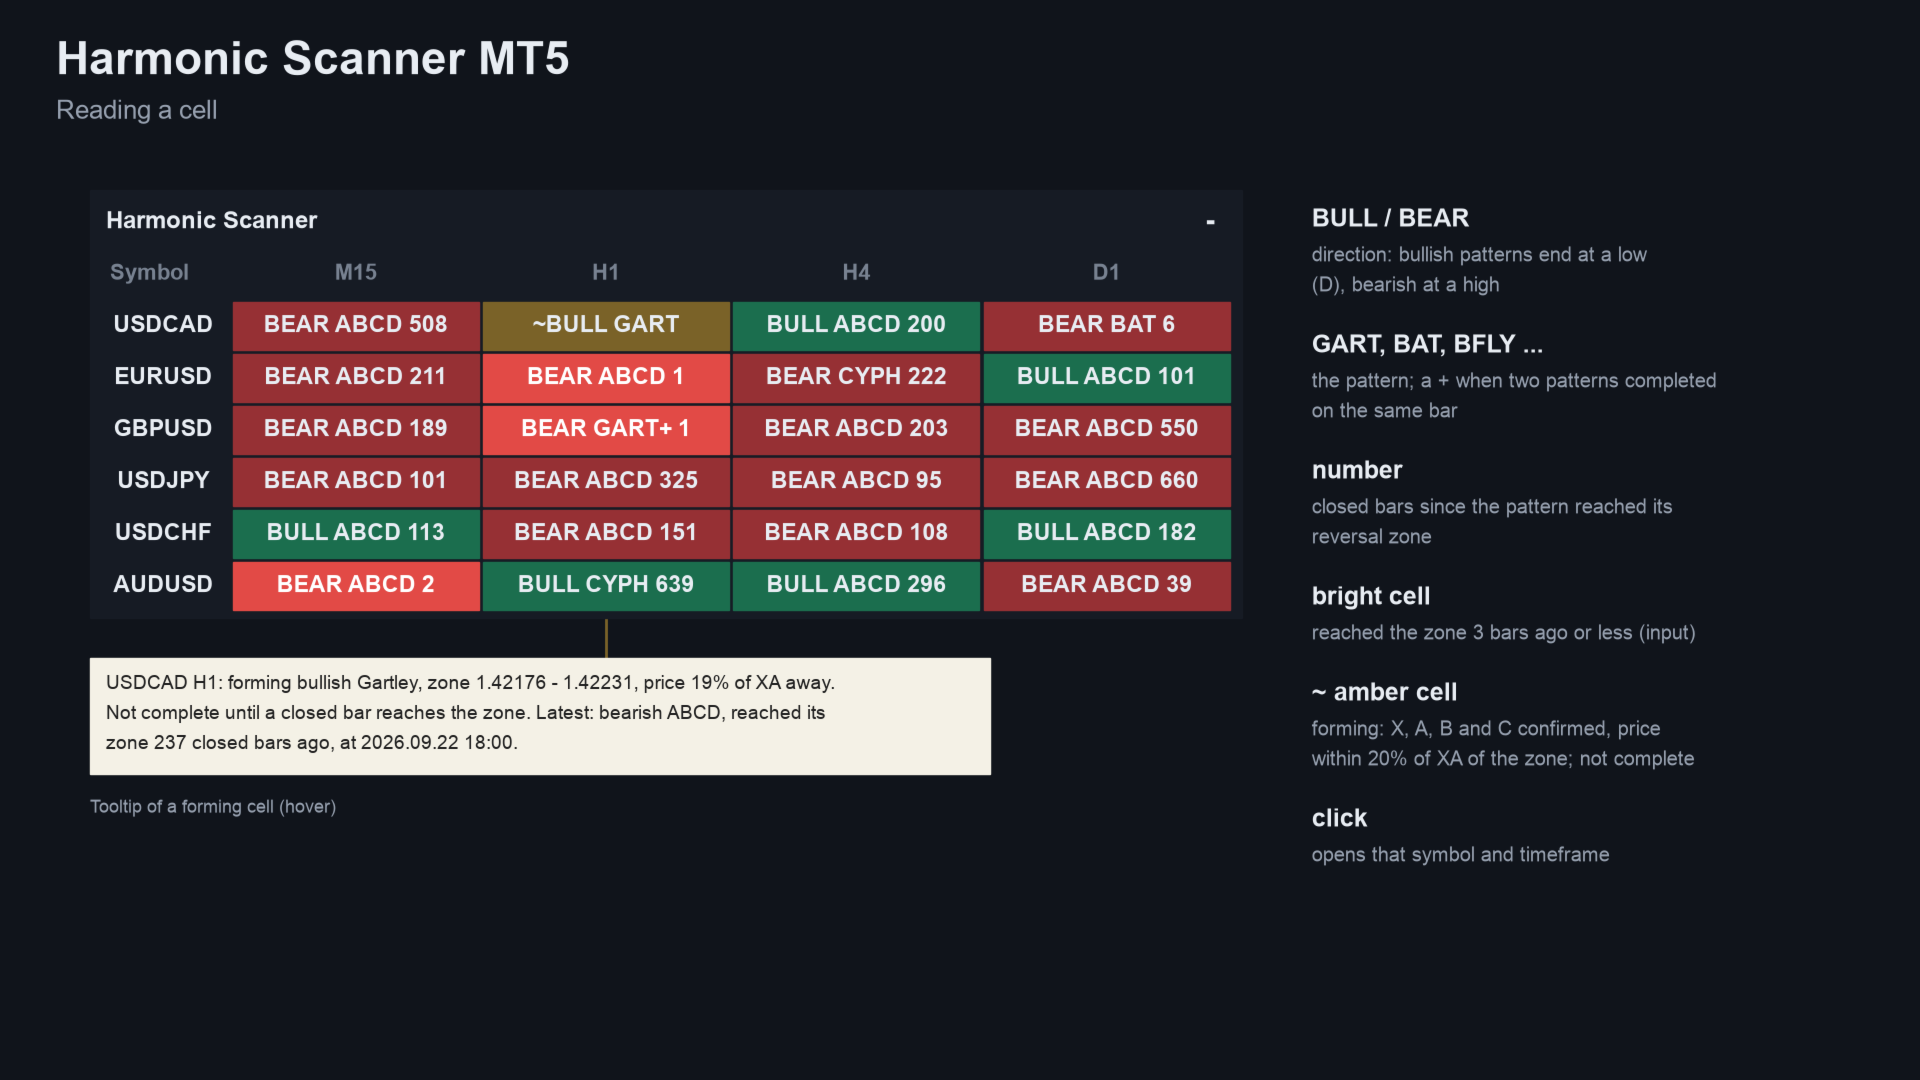
- Completed: the pattern, its direction and the bars since it reached the zone. Fresh ones are highlighted.
- Forming: a pattern whose X, A, B and C are confirmed and whose price is within 20% of the XA leg of its zone (adjustable). The tooltip gives the zone prices. A forming pattern is not complete until a closed bar reaches the zone.
- Alerts when a forming pattern comes near its zone and when a pattern reaches it: pop-up, sound, push, e-mail. Alerts of the same second come as one message.
- Click a cell to open that symbol and timeframe, with your template if you set one.
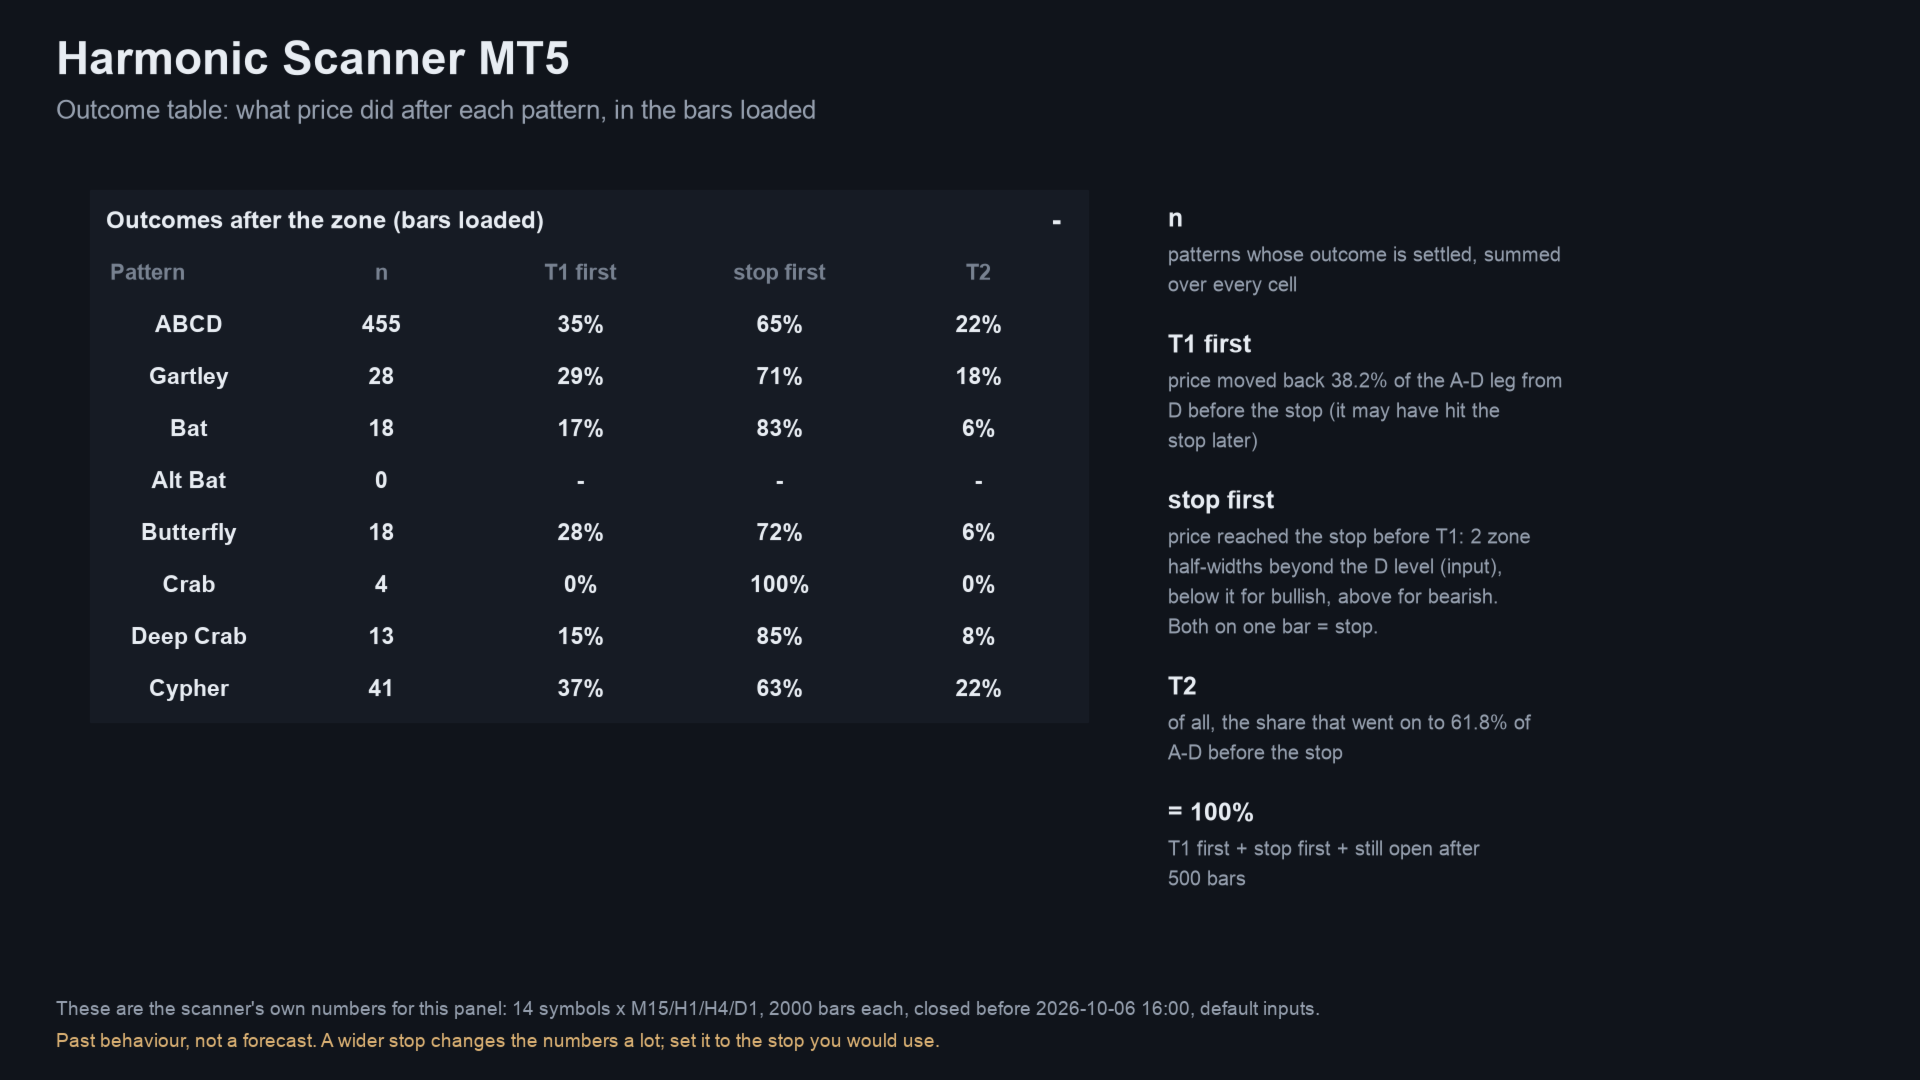
- Outcome table: for each pattern, how often price moved 38.2% and 61.8% of the A-D leg back after the zone before a stop beyond the D level was hit. The stop is 2 zone half-widths by default (adjustable). It is counted in the bars loaded in every cell. A wider stop changes the numbers a lot, so set it to the stop you would use. This is past behaviour, shown as it is, not a forecast.
How patterns are found
- Swings: higher (lower) than the 10 bars before and not lower (higher) than the 5 bars after. A swing is known 5 bars later.
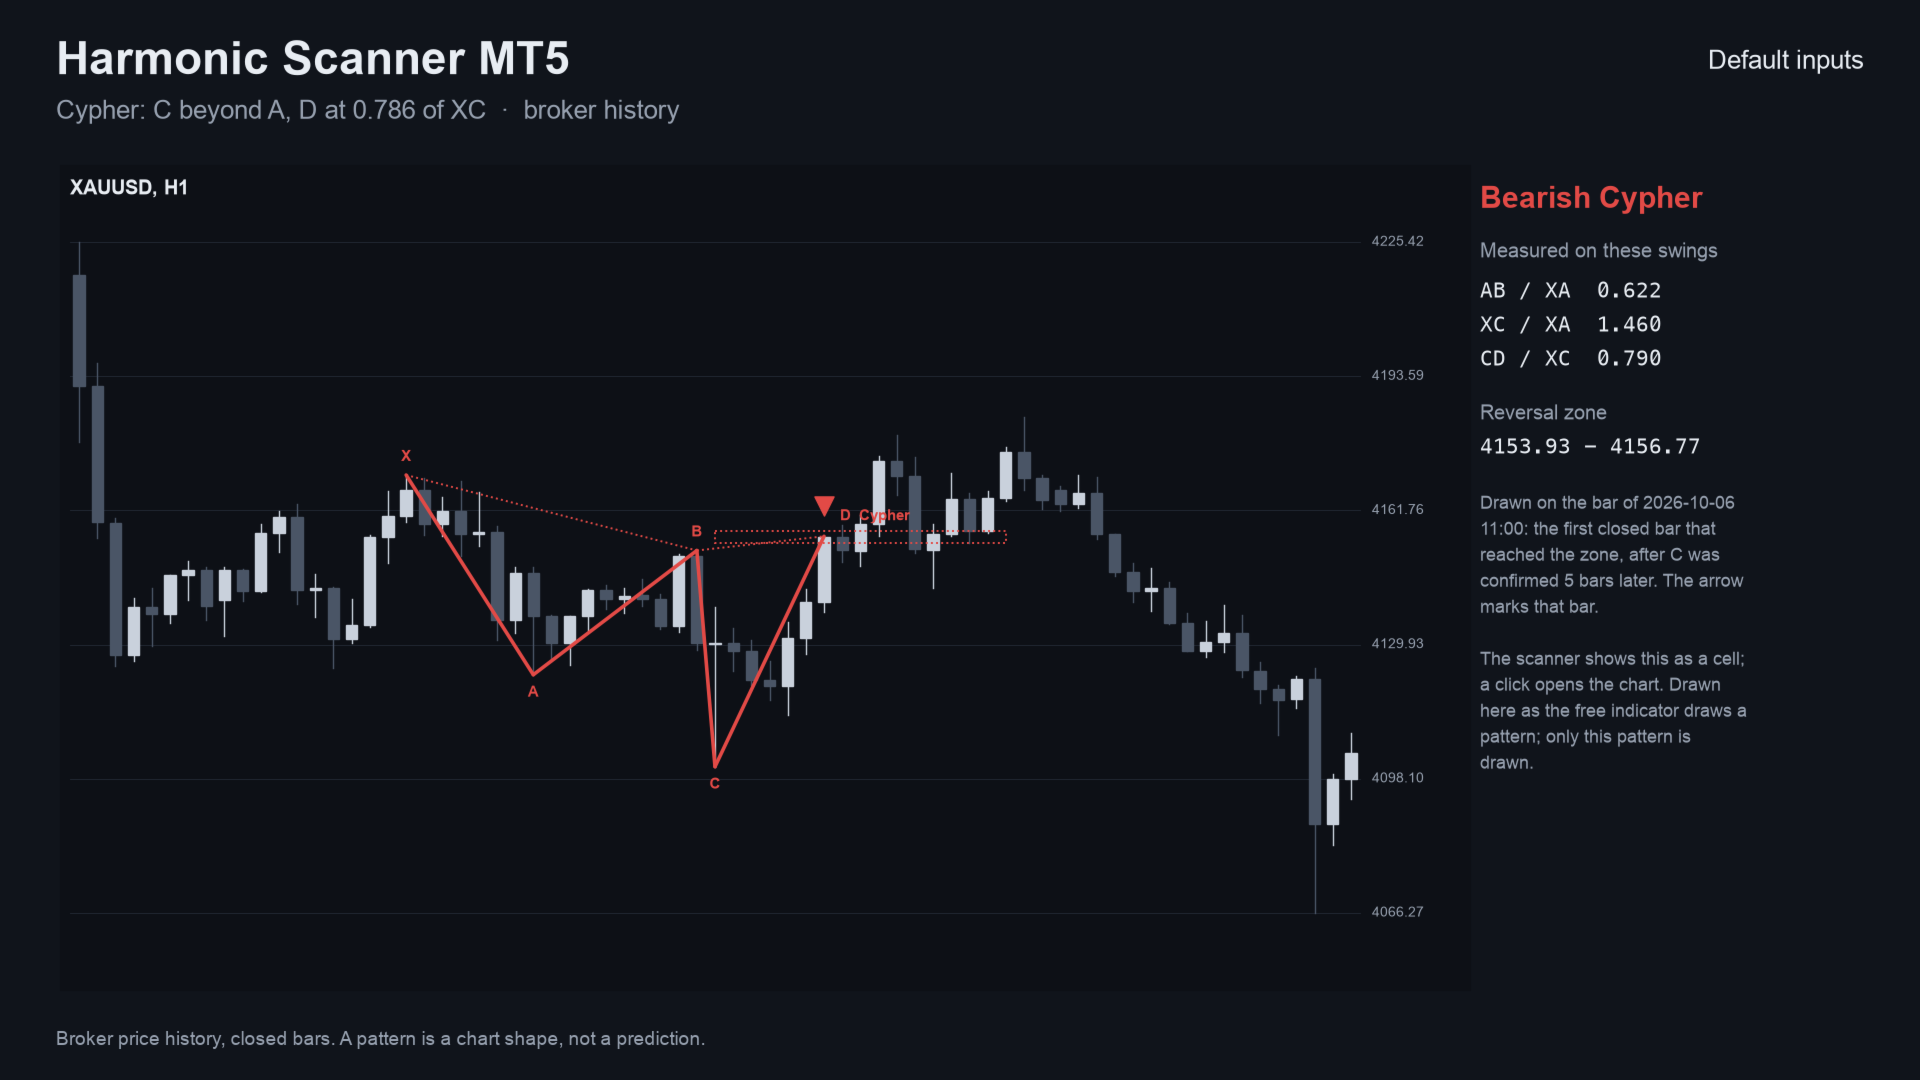
- Ratios: the commonly published Fibonacci ratios per pattern with a 5% tolerance (adjustable). For Cypher, C lies beyond A at 1.272-1.414 of XA, and D is at 0.786 of XC.
- Reversal zone: the D level plus and minus 3% of XA (AB for ABCD).
- Completion: the first closed bar that reaches the zone, provided no close went beyond it and price did not pass C.
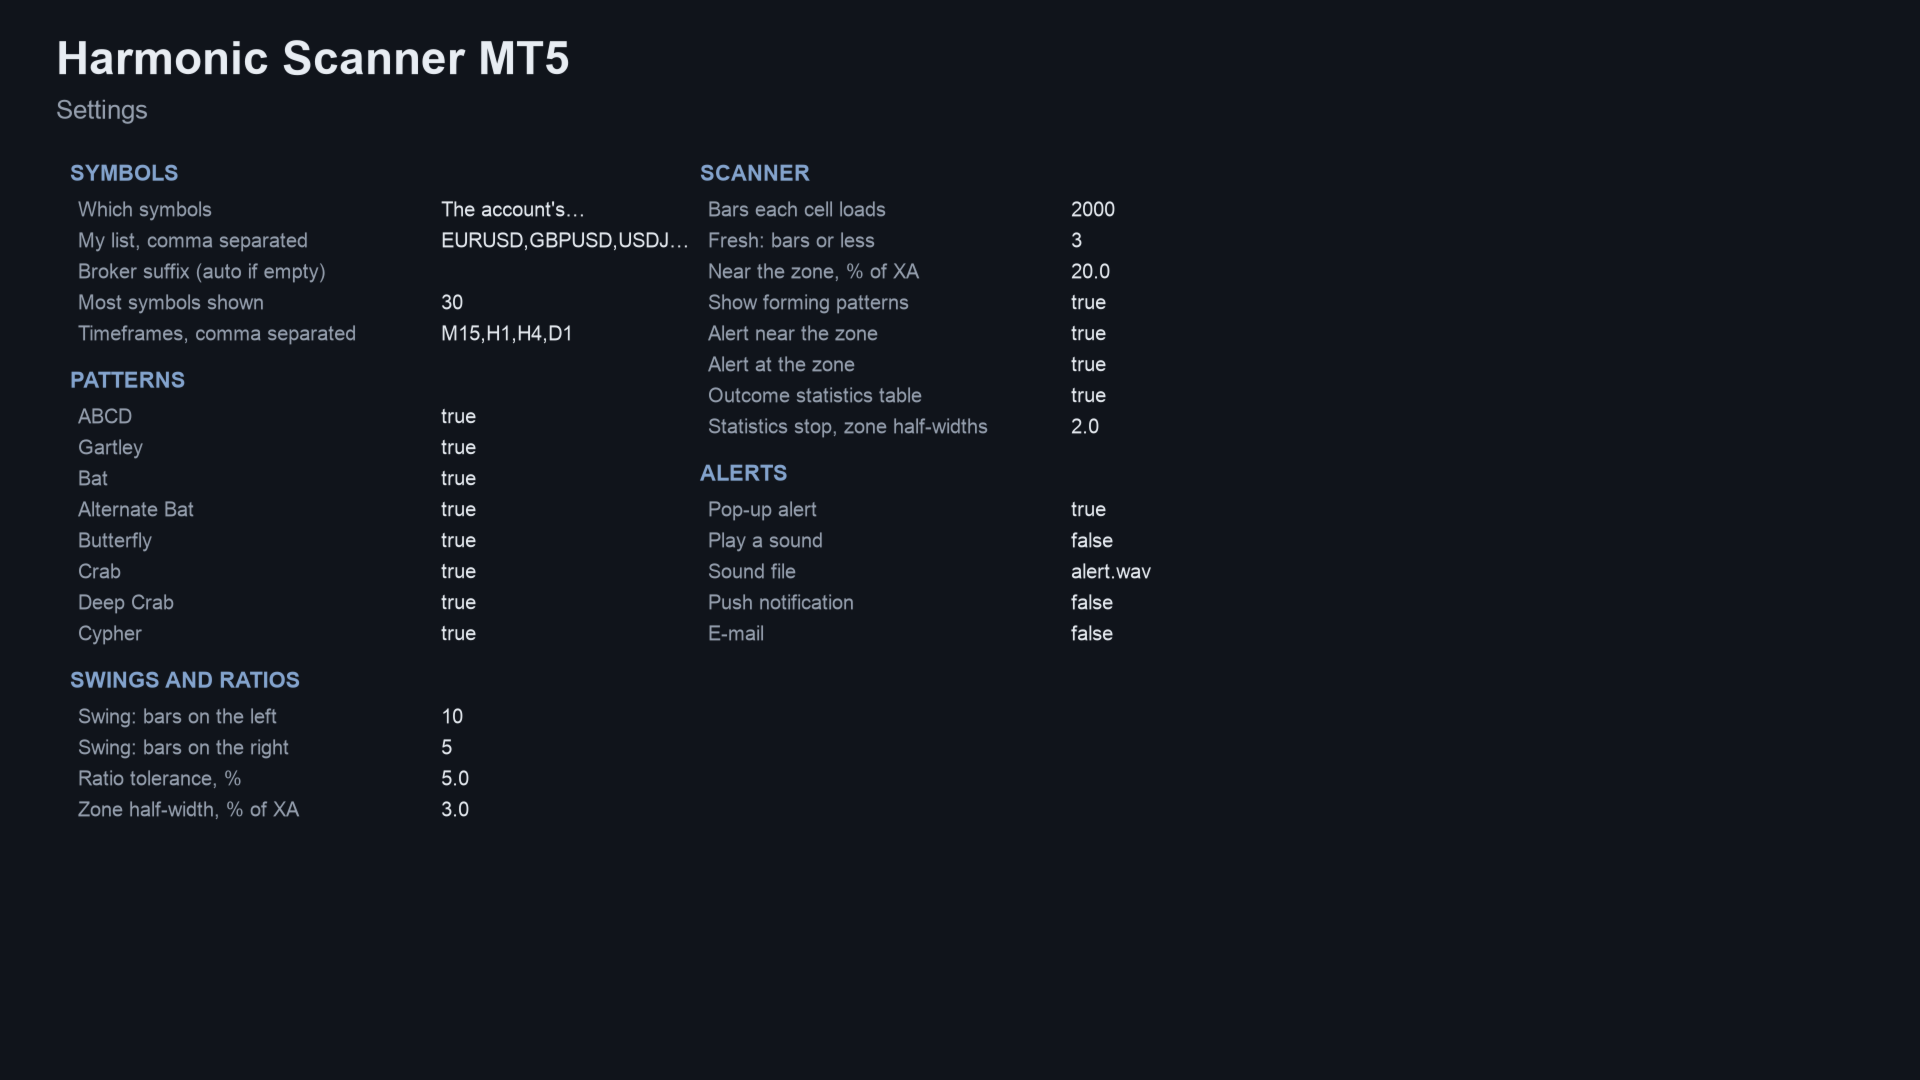
Inputs (main)
| Input | Default |
|---|---|
| Symbols | Market Watch - or your list; broker suffix found automatically |
| Timeframes | M15,H1,H4,D1 |
| Patterns | all eight on |
| Swing bars left / right | 10 / 5; ratio tolerance 5%; zone 3% of XA |
| Near the zone | within 20% of XA; show forming patterns - on |
| Bars each cell loads | 2000; fresh - 3 bars |
| Alerts near the zone / at the zone | on / on |
| Outcome table | on; its stop - 2 zone half-widths |
| Panel corners, font size, colours | - |
Related products
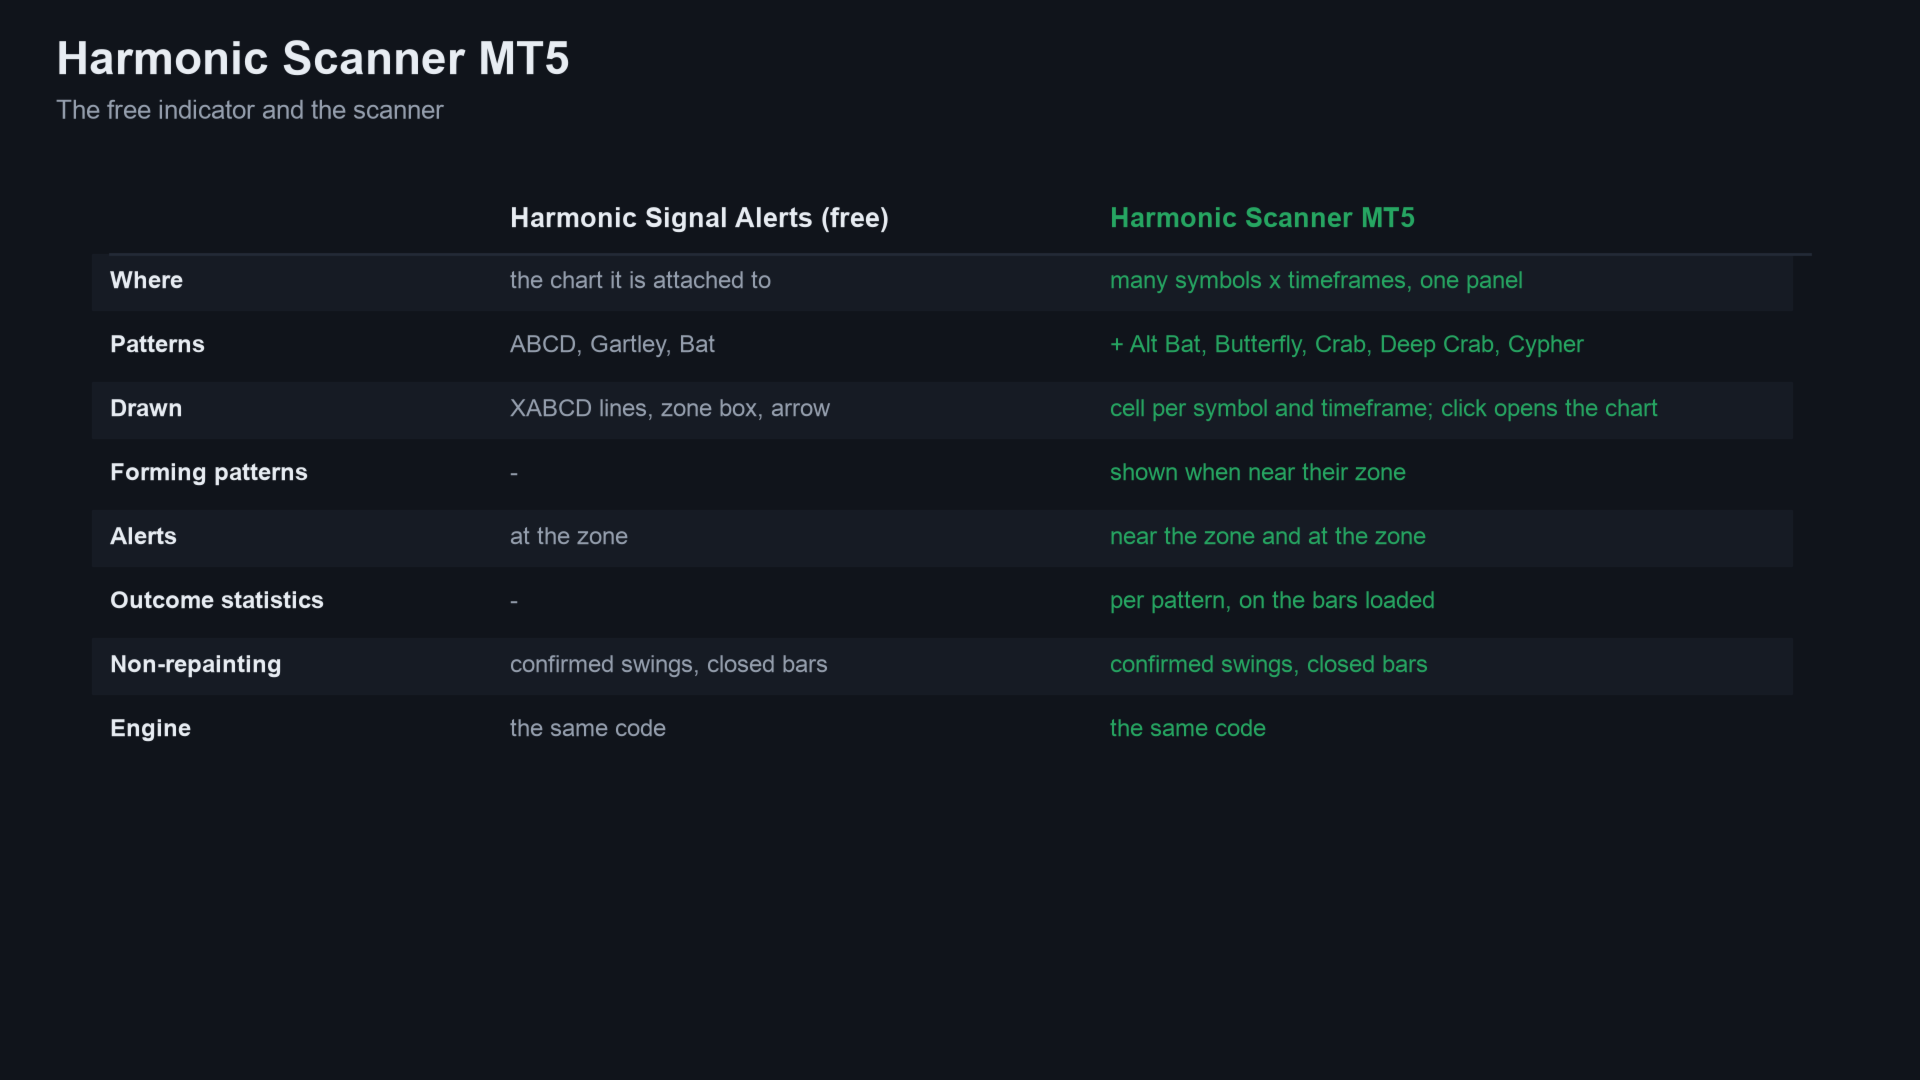
- Harmonic Signal Alerts — free; the same swing and ratio engine for ABCD, Gartley and Bat on one chart, with alerts.
- All my products on MQL5
Questions
- Does it repaint? Completed patterns do not. They are found on closed bars from confirmed swings and never removed. Forming patterns are, by nature, not final, and the panel labels them as forming.
- Why does a pattern show a few bars after point C? A swing is confirmed only after the bars on its right have closed.
- Does the outcome table mean the patterns work? It shows what happened in your history with one fixed rule. Results differ by symbol, timeframe and period. The past does not predict the future.
If it helps your trading, a short review on this page helps other traders find it.
Questions: use the comments on this page or send me a message on MQL5.
Trading involves risk. The scanner finds chart shapes; it does not tell you to buy or sell.