Manzano SMC Institutional Pro

Manzano SMC Institutional Pro

Smart Money Concepts, ICT, historical statistics, market structure and liquidity analysis for MetaTrader 5.

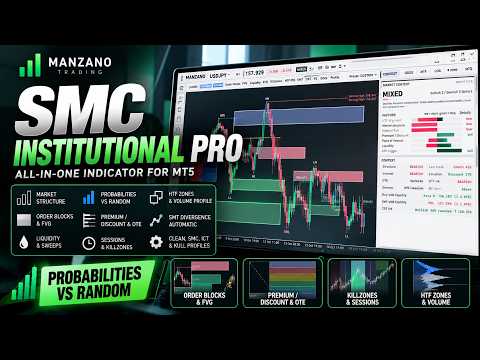
Any SMC indicator can draw zones. Manzano SMC Institutional Pro measures how those zones have performed in your market and compares their results against randomly selected price levels.

See the structure. Examine the historical evidence. Understand the market context.

Manzano SMC Institutional Pro combines Smart Money Concepts (SMC), ICT methodology, Market Structure, Order Blocks, Fair Value Gaps, Liquidity Sweeps, SMT Divergence and Multi-Timeframe analysis in a single interactive platform.

Its key difference is that it goes beyond identifying patterns. It provides historical statistics showing how specific setups have behaved on the current instrument, together with a market context system based on seven technical factors.

ODDS — Historical Statistics Compared Against Random Levels

Not all Order Blocks or Fair Value Gaps behave the same way. The ODDS module measures their historical performance using data from the current symbol and compares the results against random reference levels.

ATR-Based Zone Statistics

For each zone type — Order Blocks, Fair Value Gaps (FVG), Inversion Fair Value Gaps (IFVG) and Breaker Blocks — the indicator examines historical price interactions and evaluates what happened after price touched the zone.

The test measures:

  • How often price moved 1 ATR in the favorable direction.

  • Whether that move occurred before price traveled 1 ATR in the opposite direction.

  • The historical frequency with which this condition was met.

The test is symmetric: 1 ATR favorable versus 1 ATR adverse, using equal distances in both directions.

Comparison Against Random Levels

The system repeats the analysis using randomly selected price levels on the same chart under comparable conditions.

  • If identified zones clearly outperform random reference levels, the comparison reveals a measurable historical advantage.

  • If their behavior is similar to random levels, the results show that as well.

  • Unfavorable results are neither hidden nor replaced with optimistic estimates.

The historical percentage appears directly on each zone label, while the ODDS tab provides additional details.

Historical Retracement Depth

The module analyzes how far price has historically retraced before establishing a new extreme.

The following levels are included:

  • 50%

  • 61.8%

  • 70.5%

  • 78.6%

  • 100%

Historical Liquidity Target Probabilities

ODDS calculates how frequently price has reached specific liquidity levels before the end of the corresponding trading day or week:

  • Previous Day High (PDH).

  • Previous Day Low (PDL).

  • Previous Week High (PWH).

  • Previous Week Low (PWL).

The calculation selects comparable historical situations based on the same time of day, levels that had not yet been reached, and similar distances expressed in average trading ranges.

Nearby Zones and SMT Divergence

The ODDS tab also displays the zones closest to the current price, together with the historical frequency of favorable outcomes for that type of zone visit.

SMT Divergence includes its own historical statistical analysis, comparing observed results against random references.

ODDS values represent frequencies measured from available historical data, not predictions of future market behavior.

MARKET CONTEXT — Seven Alignment Factors

The dashboard describes the current market environment using three states:

BULLISH | BEARISH | MIXED

Instead of assigning a conventional score, it shows how many of seven technical factors are aligned in the same direction.

For example: Bullish 5/7.

The seven factors are:

  1. Higher-timeframe alignment.

  2. Main market structure.

  3. Internal flow or internal market structure.

  4. Premium/Discount position.

  5. Nearby Points of Interest (POI).

  6. Liquidity.

  7. Candle Range Theory (CRT) model.

Each factor has a green bar for the buying side or a red bar for the selling side.

The dashboard highlights agreement and disagreement between technical conditions. It describes the market context rather than generating automatic entry signals.

MARKET STRUCTURE — BOS, CHoCH and Price Action

Identify main and internal market structure through:

  • Break of Structure (BOS).

  • Change of Character (CHoCH).

  • Main and internal structure.

  • Higher Highs (HH), Higher Lows (HL), Lower Highs (LH) and Lower Lows (LL).

  • Protected structural highs and lows.

  • Bullish and bearish structural continuations and transitions.

The indicator uses closed candles to confirm structures and prevent confirmed historical structural information from repainting.

ORDER BLOCKS, FVG AND BREAKER BLOCKS

Detection and visualization of key zones used in Smart Money Concepts and ICT:

  • Bullish and bearish Order Blocks.

  • Breaker Blocks.

  • Fair Value Gaps (FVG).

  • Inversion Fair Value Gaps (IFVG).

  • Consequent Encroachment (50%).

  • Zone boundaries and midpoint levels.

  • Historical ODDS percentages displayed directly on zone labels.

These zones are integrated with market structure, liquidity analysis and the historical statistics engine.

LIQUIDITY ANALYSIS

Identify important liquidity levels and events:

  • Buy-Side Liquidity (BSL).

  • Sell-Side Liquidity (SSL).

  • Equal Highs (EQH) and Equal Lows (EQL).

  • Liquidity Sweeps.

  • Previous Day High and Low.

  • Previous Week High and Low.

  • Previous Month High and Low.

  • Asian session highs and lows.

Liquidity Sweeps can be analyzed alongside BOS, CHoCH, Order Blocks and FVG to provide structural context for price movements.

ICT CONCEPTS — OTE, Killzones and Power of 3

The platform integrates several concepts from ICT methodology:

  • Premium, Discount and Equilibrium.

  • Optimal Trade Entry (OTE), including the 62%–79% retracement zone.

  • Fibonacci retracements and extensions with selectable range anchoring.

  • ICT Killzones.

  • London and New York trading sessions.

  • ICT Silver Bullet.

  • New Day Opening Gap (NDOG) and New Week Opening Gap (NWOG).

  • NDOG and NWOG 50% midpoint levels.

  • New York Midnight Open.

  • Weekly and monthly opening prices.

  • Candle Range Theory (CRT).

  • Turtle Soup.

  • Power of 3 (Power of Three).

Power of 3

The system displays the developing higher-timeframe candle to the right of the current price.

The visualization uses the New York opening price as a reference and projection, connecting current price action with the developing higher-timeframe candle.

SMT DIVERGENCE — Automatic Instrument Matching

The SMT module compares price structure between related instruments and supports both direct and inverse correlations.

It automatically recognizes different broker naming conventions, including:

  • US100, NAS100, USTEC and NDX.

  • GER40, DE40 and GDAXI.

  • US30, DJ30 and WS30.

  • Common suffixes such as .cash, .pro and m.

If no predefined matching instrument is found, the indicator searches Market Watch for the available symbol with the highest correlation.

SMT also includes historical statistics compared against random references within the ODDS module.

Its functionality depends on the broker providing the required symbols and historical price data.

MULTI-TIMEFRAME ANALYSIS

Analyze market structure and direction across up to six configurable timeframes.

The MTF dashboard displays:

  • Trend direction for each timeframe.

  • Latest structural break.

  • Premium/Discount position.

  • Higher-timeframe context.

  • Two higher-timeframe miniature charts.

  • Structural range and OTE zone for each miniature chart.

The two higher timeframes are selected automatically according to the active chart.

INTERACTIVE TRADING DASHBOARD

Manzano SMC Institutional Pro features an interactive interface that brings market information and analysis controls together in one workspace.

Interactive Top Bar

  • Symbol selector with search functionality, without leaving the chart.

  • Timeframe selector.

  • Current price and daily price change.

  • BULLISH, BEARISH or MIXED context label.

  • Direct access to the CONTEXT tab by clicking the label.

  • Trend arrows for up to six timeframes.

  • Active trading session.

  • Chart zoom and navigation buttons.

Layer Bar

A dedicated button for each module lets you instantly enable or disable individual analysis layers.

On-Chart Module Settings

A vertical icon bar on the left opens each module's settings directly on the chart, without opening the standard MetaTrader indicator properties window.

Five Dashboard Tabs

CONTEXT

  • BULLISH, BEARISH or MIXED market state.

  • Seven-factor alignment display.

  • Context details button.

  • Main and internal market structure.

  • Latest structural break.

  • Premium/Discount position expressed as a percentage.

  • OTE zone.

  • Higher-timeframe trend.

  • Active trading session.

  • Price position relative to New York Open.

  • Nearest liquidity above and below current price.

  • Current CRT status.

ODDS

  • Historical ATR-based zone statistics.

  • Comparison against random price levels.

  • Order Block, FVG, IFVG and Breaker Block frequencies.

  • Nearest zones and historical visit frequencies.

  • Historical retracement depth.

  • PDH, PDL, PWH and PWL target probabilities.

  • SMT Divergence statistics.

MTF

  • Trend, latest structural break and Premium/Discount position by timeframe.

  • Two automatically selected higher-timeframe miniature charts.

  • Higher-timeframe ranges and OTE zones.

LOG

  • Chronological record of technical events.

  • Clicking an event moves the chart directly to the corresponding candle.

INFO

  • Historical data status.

  • Broker server time.

  • New York time.

  • Active visual theme.

  • Settings reset controls.

PERFORMANCE AND NON-REPAINTING VISUALIZATION

The indicator uses a single canvas to render its visual elements, avoiding the creation of large numbers of independent chart objects.

This architecture supports responsive chart interaction even when multiple modules are active.

Confirmed analysis uses closed candles, so confirmed historical structures and events do not repaint.

ONE-CLICK PROFILES AND CUSTOMIZATION

Four profiles adapt the platform to different analysis workflows:

  • CLEAN: Market Structure and ODDS statistics.

  • SMC: Classic Smart Money Concepts modules.

  • ICT: ICT concepts, including Power of 3 and SMT Divergence.

  • FULL: All available modules.

Switch between profiles with a single click.

The indicator remembers its configuration between sessions and includes:

  • Light theme.

  • Dark theme.

  • One-click theme switching.

  • Multiple bullish and bearish color palettes.

  • Individual module visibility controls.

STATUS BAR AND ALERTS

The status bar displays:

  • Countdown to the current candle close.

  • New York time.

  • Active trading session.

  • Next ICT Killzone.

  • Historical data status.

  • Alert status.

Configurable alerts include:

  • BOS and CHoCH.

  • Liquidity Sweeps.

  • Interactions with Order Blocks and FVG.

  • Entry into OTE zones.

  • CRT events.

  • Market context changes.

Notifications are available through pop-up alerts, sound, push notifications and email, depending on the MetaTrader 5 terminal configuration.

VISIBLE RANGE VOLUME PROFILE

The indicator includes a Visible Range Volume Profile calculated from tick-volume data available in MetaTrader 5.

It displays an estimated distribution of market activity across price levels within the visible range.

It is not a real traded-volume Footprint and does not provide information about private institutional orders.

TECHNICAL INFORMATION

Platform: MetaTrader 5.

Type: Interactive technical analysis indicator.

Methodologies: Smart Money Concepts, ICT, Market Structure, Price Action and Liquidity Analysis.

Markets: Forex, indices, metals and other instruments available through the broker, subject to data availability.

Expert Advisor integration: The current version does not expose indicator buffers for direct access through CopyBuffer().

Trade execution: The indicator does not open, modify or close trades.

Data: Analysis uses price history and tick-volume information available in MetaTrader 5.

IMPORTANT NOTICE

Manzano SMC Institutional Pro is a technical analysis tool, not an automated trading system. It does not open, modify or close trades and does not guarantee trading results. Institutional analysis concepts are calculated from available price and tick-volume data, not private institutional orders.

Manzano SMC Institutional Pro — Market structure, historical evidence and technical context in one integrated MetaTrader 5 platform.

Developed by Manzano Trading, a Spanish company specializing in algorithmic trading and professional trading software development.

추천 제품
Tired of information overload when analyzing forex currency strength? Introducing "All Currency Strength Live", the ultimate dashboard indicator for MetaTrader 5 that simplifies your trading life. This innovative tool provides a clear, concise overview of the strength of all major currencies, empowering you to make informed trading decisions with ease. With "All Currency Strength Live,"  you gain access to real-time insights into both price and volume strength across all major currencies. No mor
Smart Exit currency strenght meter
Pedro Miguel Quiles Mingot
SMART EXIT Currency Strength Meter is a professional Forex currency strength indicator designed to identify the strongest and weakest currencies in real time. The indicator analyzes 27 major Forex pairs and ranks the 8 major currencies according to their relative strength. By combining EMA momentum analysis with volatility-adjusted calculations, traders can quickly identify market leaders and laggards without manually reviewing dozens of charts. Main Features • Real-time ranking of the 8 major c
Aurum mid quant pro
N'da Lemissa Kouame
AURUM MID-QUANT PRO v5.60 Quantitative Excellence for Gold (XAU/USD) & Volatility Trading Gain a professional edge over institutional markets with AURUM MID-QUANT PRO , an advanced Price Action Pattern Detection and Breakout Engine designed exclusively for MetaTrader 5 . Built specifically to capture the unique volatility of Gold (XAU/USD) and other major financial instruments, this powerful indicator combines high-precision algorithmic pattern recognition with real-time dynamic accumulation z
ToolBox 360 is the swiss knife of all indicators. It is full packed with useful tools to help you with your trading. It can be used to find best entry and exit points and help you to decide if you should open a trade or not. It shows market trends, candlestick formations outside / inside bars and you can sett time based allerts. Main features: Time based Fibonacci lines Choose a start and end time and the indicator shows you Fibonacci lines within the selected time range including range high a
Xtrade Trend Detector
Dago Elkana Samuel Dadie
Xtrade Trend Detector is an indicator capable of finding the best opportunities to take a position in any stock market. Indeed, it is a great tool for scalpers but also for Daytraders. You could therefore use it to identify areas to trade, it fits easily on a chart. I use it to detect trends on Big timeframes and take positions on Small timeframes. Don't hesitate to give me a feedback if you test it.
Strong Liquidity Zones
Imoro Abdul-rahaman
Strong Liquidity Zones A professional non-repainting liquidity mapping indicator that detects and scores high-probability imbalance zones and stop-pool zones on the chart. The indicator identifies two core types of liquidity areas: • Imbalance Zones – price gaps (similar to Fair Value Gaps) that act as magnets • Stop-Pool Zones – areas around confirmed swing highs/lows where stop orders typically cluster Each zone receives a dynamic 0–10 score based on volume pressure, zone size, number of tests
FREE
Eazy Indicator
Isaac Agyei Poku
Forex BUY and SELL signals from the best Heiken Ashi Smoothed indicator. Draw bullish/bearish bars on the chart. Accurate trend detector. Heiken Ashi Smoothed is a simple MT5 indicator that draws bullish and bearish bars in the chart to reflect the direction of the trend. The indicator consists of orange bearish bars and green bullish bars. When the trend changes its direction, the indicator changes its color. The indicator is a modernization of the traditional Heiken Ashi indicator. Moving Aver
RelativeVolume
Richard Barile
Relative Volume (RVOL) Indicator See When Volume Really Matters Not all volume is equal. The Relative Volume (RVOL) Indicator helps you quickly identify when the market is experiencing unusually high trading activity compared with its recent average. Instead of simply showing how much volume is trading, RVOL puts current volume into context—making it easier to spot moments when buyers or sellers may be becoming more active. Key Features Identify High-Volume Bullish Moves Quickly spot candles
Quantum SMT Zones Pro MT5
Jerome Etkins Patrick Ankiah
Quantum SMT Zones Pro Overview Quantum SMT Zones Pro is a Smart Money Technique (SMT) divergence indicator for MetaTrader 5 that compares the price action of two correlated instruments and highlights situations where one market fails to confirm the movement of the other. By identifying SMT divergences and market inefficiencies, the indicator helps traders analyze intermarket relationships, monitor potential shifts in market structure, and identify developing trading opportunities. The indicator
Entry Points Pro for MT5
Yury Orlov
4.52 (151)
전설이 돌아왔습니다: Entry Points Pro 10. MQL5 마켓 Top-3 자리를 3년간 지켜온 전설적인 지표의 재출시입니다. 수백 개의 호평 리뷰(두 버전 합산 589개), 매일 이 지표로 거래하는 수천 명의 트레이더, 31,000회 이상의 데모 다운로드   MT4+MT5 . 지난 5년간 여러분이 남긴 리뷰를 하나도 빠짐없이 읽었고, 약속 대신 그 답을 버전 10에 담았습니다. 1999년부터 시장에서 활동하며 정직함과 자신의 평판, 그리고 고객을 소중히 여기는 개발자가 만들었습니다. Entry Points Pro의 진입 시그널은 절대 리페인팅되지 않습니다. 그리고 이번에는 개발자의 말뿐이 아니라 검증 가능한 사실입니다: 확정 시그널은 캔들 종가에서만 표시되며, 자동화 테스트에서 리페인팅 0건 이 확인되었습니다(EURUSD, XAUUSD, BTCUSD에서 2,486,568회의 불변조건 검사 — 위반 0건). 검증 방법은 공개되어 있으니 전략 테스터에서 직접 재현해 보실 수
Retest Breakout Bearish
Brighton Mufaro Mudzingwa
BreakerBlocks & Predictive R&B Engine v2.14 The Ultimate Sell-Only & Spike Capture System for MT5 Designed specifically for traders who demand high-precision short entries, BreakerBlocks & Predictive R&B v2.14 combines an institutional Breaker Block Engine with a specialized Bearish Predictive R&B (Rally & Break) Engine . It is engineered from the ground up to capture rapid downside moves in Forex and instantly catch price spikes on Synthetic Crash Indices (e.g., Crash 300, Crash 500, Crash 1000
다중 시간대 이동 평균선 지표 다중 시간대 이동 평균선 지표를 사용하여 시장 추세를 더 깊이 이해하십시오. 이 강력한 MQL5 도구를 사용하면 하나의 차트에서 5가지 다른 시간대의 이동 평균선을 동시에 시각화할 수 있습니다. 여러 지표 인스턴스로 작업 공간을 복잡하게 만들지 않고도 다양한 관점에서 가격 역학에 대한 포괄적인 통찰력을 얻을 수 있습니다. 주요 기능: 다중 시간대 분석: 하나의 차트에 다른 시간대(예: M15, H1, H4, D1, W1)의 최대 5개의 이동 평균선을 표시합니다. 사용자 정의 기간: 표시되는 모든 선에 대해 원하는 이동 평균 기간을 쉽게 설정할 수 있습니다. 다양한 MA 유형: 단순(SMA), 지수(EMA), 평활(SMMA), 선형 가중(LWMA)을 포함한 광범위한 이동 평균 유형 중에서 선택하십시오. 조정 가능한 시간대: 모니터링하려는 5가지 시간대를 선택하여 비교할 수 없는 유연성을 제공합니다. 깔끔한 시각화: 여러 추세 관점을 한눈에 확인하여 시간대
BBands PMO
Norio Takahashi
The indicator allows you to simplify the interpretation of signals produced by the classical MACD indicator.  It is based on the double-smoothed rate of change (ROC).  Bollinger Bands is made from EMA line.  The indicator is a logical continuation of the series of indicators using this classical and efficient technical indicator. The strength of the trend is determined by Bands and main line. If the bands width are smaller than the specified value, judge it as suqueeze and do not recommend tra
거래량 프로파일 멀티모드: 지표 방식이 아닌, 원하는 방식으로 거래량을 분석하세요. 대부분의 거래량 프로파일 지표는 거래자들이 미리 정해진 분석 범위 안에 갇히도록 만듭니다. 하지만 시장은 고정된 틀 안에서 움직이지 않는데, 분석까지 그럴 필요가 있을까요? 볼륨 프로파일 멀티 모드는 거래량 분석 시점, 장소, 방법을 완전히 자유롭게 결정할 수 있도록 해줍니다. 시장 구조 분석, 거래 세션 프로파일링, 더 높은 시간대의 활동 모니터링, 또는 진행 중인 경매 추적 등 어떤 목적이든 이 지표는 사용자의 거래 스타일에 맞춰 조정되므로 사용자가 거래 스타일에 맞춰야 할 필요가 없습니다. 직관적인 워크플로우를 원하는 초보자와 유연성을 요구하는 전문가를 위해 설계된 Volume Profile Multi-Mode는 네 가지 강력한 프로파일링 방법을 하나의 고도로 상호작용적이고 맞춤 설정 가능한 거래 도구로 결합합니다. 4가지 강력한 프로파일링 모드 1.       플렉서블 박스 : 대시보드에서 토
Calendar Dashboard
Chahine Mamodaly
Calendar Dashboard – a compact, real‑time economic calendar that sits directly on your MT5 charts and never gets in the way . Why traders love Calendar Dashboard See upcoming and past news at a glance, with clear time, currency, and impact so you know exactly when markets may move . Instantly spot high‑impact events thanks to color‑coding and a simple legend; past events are marked with a small asterisk for quick reference . Stay aligned across brokers with Broker Time and GMT Time displayed si
FREE
FVG - Fair Value Gap The FVG - Fair Value Gap is an advanced MQL5 indicator designed for traders who utilize institutional order flow and Smart Money Concepts to identify market inefficiencies. This indicator automatically detects and highlights Fair Value Gaps (FVGs) on your chart, providing a clear visual representation of potential support and resistance zones, reversal points, and high-probability trading setups. Key Features: Automated FVG Detection:   The indicator automatically identifie
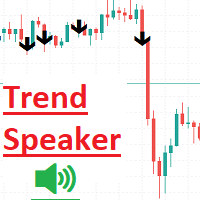
Trend Speaker 지표 는 실시간으로 시장 동향을 쉽게 추적하고 분석하려는 트레이더를 위해 설계된 강력한 도구입니다. 차트에서 명확하고 신뢰할 수 있는 매수 및 매도 신호를 제공하여 시장의 현재 추세를 매우 편리하게 평가할 수 있습니다. 사용자 친화적인 인터페이스를 갖춘 Trend Speaker는 잠재적인 거래 기회를 놓치지 않도록 도와주며, 정보에 기반한 결정을 내리고 거래 전략을 향상시키는 데 도움을 줍니다. 이 지표는 모든 매수 및 매도 신호에 대해 Stop Loss와 Take Profit을 표시합니다. 스크린샷에서: 초록색 점은 TP1에서 TP7까지의 Take Profit을 나타냅니다 빨간색 점은 Stop Loss를 나타냅니다. 사용법: 모든 시간대에서 실행할 수 있습니다. 매수 및 매도 화살표의 색상과 두께를 쉽게 변경할 수 있습니다. 이 지표를 사용하는 것은 매우 간단하고 쉽습니다. 편안하게 앉아 있고 모든 것이 잘 될 것입니다. 속성을 변경하여 TP와 SL을 쉽게
The  OBV MTF  is an Enterprise-grade On-Balance Volume indicator that transforms standard OBV into a complete trading system. It combines gradient-aware momentum analysis, divergence detection, multi-timeframe alignment, and dynamic customisable midpoint-filtering in a single intuitive professional volume analysis tool. Core Features 1. 5-State Momentum Engine Aqua (Strong Bullish) : OBV slope rising with positive acceleration SteelBlue (Weak Bullish) : OBV rising but losing momentum Gray (Neutr
Apex Institutional Reversal
Sami Eid Fahid Almashaqbeh
Apex Institutional Reversal is an advanced Smart Money Concepts (SMC) and ICT trading framework designed to identify high-probability market reversals, continuation phases, and institutional exhaustion zones before they become obvious to retail traders. This is not another lagging oscillator or generic overbought/oversold tool. Apex Institutional Reversal acts as a market regime intelligence system that combines statistical trend analysis, fractal market behavior, and institutional momentum dia
Multi-Timeframe Breakout Pressure and Confirmation Dashboard TAGLINE Track compression, stored pressure, breakout direction, and confirmation in one dashboard. PRODUCT OVERVIEW BreakoutPulse Navigator MT5 is a professional multi-timeframe breakout dashboard for MetaTrader 5. It is designed to detect two different stages of a breakout: 1. Pressure building before the breakout 2. Directional confirmation after price leaves the channel The indicator combines: - Bollinger Band squeeze - ATR
FREE
Analise Probabilistica
Valter Cezar Costa
4.78 (9)
I'm sure after a lot of research on the internet, you haven't found any indicator that can help you with forex or binary trading in the latest probability strategy created by famous trader Ronald Cutrim. The strategy is based on a simple count of green and red candles, checking for a numerical imbalance between them over a certain period of time on an investment market chart. If this imbalance is confirmed and is equal to or greater than 16%, according to trader Ronald Cutrim, creator of the pro
FREE
Selected Range Volume — Buyers and Sellers Balance + Volume Levels Selected Range Volume is an advanced indicator for analyzing volumes and the imbalance between buyers and sellers. It doesn't just show where the volume was—it highlights who exactly dominated: buyers or sellers, and where the market might stop in the future. You select any section of the chart, and the indicator instantly calculates the volume activity within the range, builds a volume profile by prices, and displays the balance
Excellent tracking performance and minimal noise! This trend detection indicator that avoids whipsaws and uncertain market noise and is also agile enough to react to changes in trend. It is also designed to adapt to dynamic markets. Functions mainly as a filter to help you trade in the direction of the trend. Features. Simple and easy to use. Low load and easy to try out The excellent tracking performance and smooth lines that make it ideal for market analysis Can be used as a trend filter for
FREE
Ugenesys AI MT5
Odaine Ramon Mcmillan
uGenesys AI - 90% Accurate Daytrading Indicator Introducing the ultimate forex trading indicator system, uGenesys AI, powered by cutting-edge AI technology and advanced analytical techniques, including Time-Series Analysis and Genetic Algorithms. Our AI-powered trading system leverages the power of time-series analysis to identify trends and patterns in historical price data, allowing traders to make informed predictions about future market movements. By analyzing vast amounts of data, our syst
Prime Major FX Swing Grid EA  A MetaTrader 5 Expert Advisor  for traders who prefer a structured, disciplined, and transparent automated trading approach on major forex pairs. This EA uses swing-based market entries combined with controlled grid recovery logic. It is designed to identify potential short-term market movements, manage basket positions, and close trades based on predefined profit conditions. Unlike aggressive grid systems, Prime Major FX Swing Grid EA emphasizes controlled exposure
Spike Probability GainX 999 is a professional analytical indicator engineered specifically for pinpointing price spikes on the GainX 999 index . It combines multi-pattern oversold algorithms and structural trend levels into a clean, intuitive on-chart GUI . Key Features: Dynamic Spike Probability Scale: Real-time multi-factor confluence analysis displaying spike probability (0–100%) directly on your screen . Multi-Trend Dashboard: On-chart dashboard tracking trend direction across 4 technical pa
" Blow It Up!" - The Trading Indicator That Questions Your Life Choices Tired of boring indicators? Meet your new market companion that delivers: "YOLO BUY!" arrows when you should probably panic Explosive rectangle confetti (because why not?) 200+ soul-crushing quotes like "Your stop loss is imaginary" and "This is n't trading, it's donating to whales" Random alerts that roast your strategy This Indicator is lik e Therapy - Because daytrading shouldn't fe el like watching paint dry! Highlights
MYTabogFX Pivot HILO MTF is a clean and powerful multi-timeframe support and resistance indicator designed for price action traders. This tool automatically detects and plots the latest pivot highs and pivot lows from a selected higher timeframe and displays them directly on your current chart. It is built for traders who focus on market structure, liquidity, and precision entries. Key Features: • Multi-Timeframe Pivot Detection (M5, M15, H1, H4, etc.) • Displays Latest 3 Pivot Highs and 3 Piv
FREE
FX Power MT5 NG
Daniel Stein
5 (33)
FX Power: 통화 강세 분석으로 더 스마트한 거래 결정을 개요 FX Power 는 어떤 시장 상황에서도 주요 통화와 금의 실제 강세를 이해하기 위한 필수 도구입니다. 강한 통화를 매수하고 약한 통화를 매도함으로써 FX Power 는 거래 결정을 단순화하고 높은 확률의 기회를 발견합니다. 트렌드를 따르거나 극단적인 델타 값을 사용해 반전을 예측하고자 한다면, 이 도구는 귀하의 거래 스타일에 완벽히 적응합니다. 단순히 거래하지 말고, FX Power 로 더 스마트하게 거래하세요. 1. FX Power가 거래자에게 매우 유용한 이유 통화와 금의 실시간 강세 분석 • FX Power 는 주요 통화와 금의 상대적 강세를 계산하고 표시하여 시장 역학에 대한 명확한 통찰력을 제공합니다. • 어떤 자산이 앞서고 있고 어떤 자산이 뒤처지는지 모니터링하여 보다 현명한 거래 결정을 내릴 수 있습니다. 포괄적인 멀티 타임프레임 뷰 • 단기, 중기 및 장기 타임프레임에서 통화와 금의 강세를
Inspired by the popular beat the market maker Multi MA. Now available for MT5 to be utilized. Multi Exponential Moving Average (Multi-EMA) Indicator for MT5 The Multi-EMA Indicator is designed to help traders visualize multiple exponential moving averages on one chart with precision and clarity. It plots five customizable EMA lines, each with distinct colors, making it easy to identify market trend direction, strength, and potential reversal zones at a glance. Key Features: Plots five indepen
이 제품의 구매자들이 또한 구매함
Neuro Poseidon MT5
Daria Rezueva
4.75 (52)
Neuro Poseidon is a new indicator by Daria Rezueva. It combines precise trading signals with adaptive TP/SL levels - creating best possible trades as a result! Message me and get  Neuro Poseidon Assistant  as a gift to automize your trading process! What makes it stand out? 1. Proven profitability on all assets and timeframes 2. Only confirmed BUY and SELL signals present on the chart 3. Adaptive TP & SL levels generated by the software for each trade 4. Easy to understand - suitable for al
ARIPoint
Temirlan Kdyrkhan
1 (4)
ARIPoint is a powerful trading companion designed to generate high-probability entry signals with dynamic TP/SL/DP levels based on volatility. Built-in performance tracking shows win/loss stats, PP1/PP2 hits, and success rates all updated live. Key Features: Buy/Sell signals with adaptive volatility bands Real-time TP/SL/DP levels based on ATR Built-in MA Filter with optional ATR/StdDev volatility Performance stats panel (Success, Profit/Loss, PP1/PP2) Alerts via popup, sound, push, or email Cu
안녕하세요, 트레이더 여러분! 많은 개인 투자자들이 느린 웹 스크립트에 의존하고 있습니다. 수익성 있는 거래를 위해서는 체계적인 프레임워크가 필수적입니다. Astro AI 지표는 단순한 차트 오버레이가 아닙니다. 터미널에서 직접 실행되는 두 개의 에이전트로 구성된 정교한 신경망입니다. 시스템 기술 상세 설명: 1. 에이전트 1: 분석가 (그래픽 신경망 – GNN) 시장은 개별 가격 막대로 이루어진 것이 아니라 상호 연결된 데이터 네트워크입니다. 기능: 에이전트 1은 그래픽 신경망을 사용하여 이러한 복잡하고 비선형적인 관계를 파악합니다. 장점: 기존 지표는 과거 이동 평균만을 고려하는 반면, 저희 GNN은 시장의 심층적인 구조적 관계를 실시간으로 처리하여 개별 트레이더의 거래량이 시장에 큰 영향을 미치기 전에 숨겨진 상관관계를 찾아냅니다. 2. 에이전트 2: 실행기 (근접 전략 최적화 – PPO) 패턴 인식은 절반의 성공일 뿐입니다. 현재 시장 변동에 기반하여 올바른
Volatility Master for MetaTrader is a real-time dashboard tool that scans up to  50 symbols  to identify high-volatility , trending markets instantly. With bullish/bearish signals, customizable alerts, and a user-friendly interface, it helps you avoid range-bound conditions and focus on high-probability trades. Clarity leads to confidence. Trade confidently and protect your capital effectively with this powerful dashboard. We don't offer free or bonus indicators in exchange of reviews from you.
ICT PO3 (Power of 3) AMD Protocol Framework Indicator True Time & Structure Integration   |  Non-Repainting | Real-Time  | Multi-Asset  | MT4 Version Available Full Setup Guide & Strategy Playbook: https://www.mql5.com/en/blogs/post/768683 The ICT Power of Three (PO3): The Complete Guide to Accumulation, Manipulation, and Distribution https://www.mql5.com/en/blogs/post/771729 MT4 Version: https://www.mql5.com/en/market/product/171742 Indicator Overview The ICT PO3 AMD Protocol Framework i
RelicusRoad Pro MT5
Relicus LLC
4.96 (25)
거래를 더 이상 감으로 하지 마세요. 언제 진입할지, 어디서 청산할지, 시장이 어느 쪽으로 기울어 있는지를 한 차트에서 확인하세요. RelicusRoad Pro는 20개 가까운 도구를 인디케이터 하나에 담았고, 내 매매 방식에 맞는 도구만 켜서 쓰면 됩니다. 명확한 진입. 명확한 청산. 차트마다 확실한 계획. 이런 경험, 익숙하지 않으신가요? 매수하면 1분 뒤 가격이 반대로 돌아섭니다. 너무 일찍 청산하고, 그다음 움직임이 나 없이 이어지는 것을 지켜봅니다. 지표를 5개 띄우면 답도 5가지가 나옵니다. 손절(스톱로스)은 그냥 감입니다. 우리가 이걸 만든 이유 우리는 18년 동안 외환 거래를 해 왔습니다. RelicusRoad는 처음에 우리끼리 쓰려고, 전문 트레이더 모임을 위해 비공개로 만들었습니다. 이유는 개인적이었습니다. 같은 선을 손으로 계속 그리는 일에 지쳤고, 스스로 정한 규칙을 어기고, 차트에서 정말 중요한 한 가지를 놓치곤 했습니다. 우리에게 통한 것은 일관성입니다. 매
Boba Analysis Suite Boba Analysis Suite는 MetaTrader 5용 분석 지표입니다. 시장 구조, 주요 가격 영역, 전반적인 시장 상황을 하나의 차트 화면에 통합하여 표시합니다. 트레이더이자 트레이딩 코치로서의 실무 경험을 바탕으로 개발되었으며, 시장 방향 평가, 주요 가격 수준 식별, 여러 시간대의 종합적인 분석 등 체계적인 분석 과정을 지원합니다. 시장 맥락을 고려한 분석 개별 신호의 의미는 시장 상황에 따라 달라집니다. Boba Analysis Suite는 현재 차트 상황을 더 넓은 시장 구조와 연결하고, 사전에 정한 규칙에 따라 매매 아이디어를 검토할 수 있도록 돕습니다. 주요 분석 기능은 다음과 같습니다. 추세 및 시장 구조: 시장 방향과 관련 구조적 맥락을 평가합니다. 주요 가격 영역 및 수준: 추가 분석이 필요한 중요한 영역을 차트에 시각적으로 표시합니다. 여러 시간대: 서로 다른 시간대의 정보를 통합하여 전반적인 시장 상황을 평가합니다.
CGE Trading Suite
Carl Gustav Johan Ekstrom
5 (2)
Institutional-Grade Analytics for MT5 The full analytical edge of a professional trading desk, built into your MT5 chart. Standard retail platforms lack the depth required for professional market analysis. The CGE Trading Suite bridges this gap, transforming MetaTrader 5 into a comprehensive workspace. By integrating 22 proprietary modules into a single, unified chart interface, the suite eliminates fragmented analysis. It provides definitive clarity across market structure, timing, momentum,
Chimera Volume
Marko Milenkovic
MetaTrader 5용 Chimera Volume 고급 거래량 분석 및 시장 활동 시각화 Chimera Volume은 MetaTrader 5 전용 사용자 정의 지표로, 정규화된 거래량 활동을 분석하고 역동적인 시각적 프레임워크를 통해 시장 참여도의 변화를 보여주도록 설계되었습니다. 이 지표는 적응형 정규화 알고리즘을 사용하여 틱 거래량 데이터를 처리하며, 다양한 시장 상황 속에서 거래량의 강도, 매집 단계, 활동 변화를 구조화된 형태로 생성합니다. 원시 거래량 값을 표시하는 일반 거래량 지표와 달리, Chimera Volume은 추가 계산을 적용하여 시장 활동의 상대적 변화를 강조하고 차트의 가독성을 향상시킵니다. 주요 기능 루트 인텐트 히스토그램 (Root Intent Histogram): 정규화된 거래량 강도와 시장 참여도를 시각화하는 동적 히스토그램입니다. 적응형 색상 전환을 사용하여 활동 증가 시기와 참여 감소 시기를 명확하게 구분합니다. 관성 라인 (Inertia Line
UZFX {SSS} 스캘핑 스마트 시그널 v5.0 MT5는 급변하는 시장에서 정확한 실시간 시그널을 필요로 하는 스캘퍼, 데이 트레이더, 스윙 트레이더를 위해 설계된 리페인팅이 없는 고성능 트레이딩 지표입니다. (UZFX-LABS)에서 개발한 이 지표는 가격 움직임 분석, 추세 확인 및 스마트 필터링을 결합하여 모든 통화 쌍과 시간대에서 높은 확률의 매수 및 매도 신호, 경고 신호, 추세 지속 기회를 생성합니다. 거래에 대한 망설임을 멈추고, 명확성, 정밀성, 그리고 규율 있는 시장 실행을 원하는 트레이더를 위해 설계된 체계적인 신호 시스템을 따르기 시작하세요. 제 말을 믿으세요. 이 지표는 MQL5에서 구할 수 있는 최고의 지표 중 하나입니다. 그러니 절대 놓치지 마세요!! “현명한 트레이더를 위한 스마트 신호” 지금 최신 버전 5.0이 출시되었으며, 사전 공지 없이 가격이 최대 $499.99까지 인상될 수 있으니 기회를 놓치기 전에 서둘러 구매하세요!! 최종 구매 전! 무료 체
Btmm state engine pro
Garry James Goodchild
5 (4)
BTMM State Engine Pro by G-Labs — Beat The Market Maker indicator for MetaTrader 5. Asian session range, London and New York kill zones, level progression (L1/L2/L3), peak formation detection (PFH/PFL), entry signals, and a multi-pair scanner from one chart. Stop scanning charts one pair at a time. The State Engine tracks the BTMM daily cycle automatically — Asian box, room boundaries, level blocks, peak formations, and filtered entries — while the scanner dashboard shows level, peak status, d
Ace Trend
Mikhail Sergeev
5 (3)
우리는 당신에게 트렌드 거래의 세계에서 게임의 규칙을 변경하는 혁신적인 지표를 제시한다. 이 표시기는 성능을 재고하고 거래 경험을 전례없는 높이로 높이도록 설계되었습니다. 우리의 표시기는 경쟁 업체와 차별화 된 고급 기능의 고유 한 조합을 자랑합니다. "실제 가격 요인"의 첨단 기술은 가장 어렵고 휘발성 시장 상황에서도 탁월한 안정성을 보장합니다. 불안정한 패턴,깨진 지표 및 의식적이고 통제 된 거래에 작별 인사를하십시오. 표시기는 단지 아름다운 그림이 아닙니다! 지표는 거래자의 편으로 확률을 이동시켜 이익을 얻어야 합니다. 표시 신호(완전 자동 모드)에 따라 거래 결과에 익숙해: https://www.mql5.com/ko/signals/2339244 표시기는 형성된 막대에 다시 그리지 않습니다. 막대가 형성된 경우 표시기 판독 값은 변경되지 않습니다. 이 표시기는 모든 시간대에 작동합니다. 표준은 시간대입니다. 귀하의 의견은 매우 중요합니다! 당신은 어떤 질문,제안이,또는 당신의
Cycles Plotter
Edoardo Centorame
Cycles Plotter 이동 평균과 시작 날짜가 있는 사용자 지정 가능 사이클 지표 Cycles Plotter는 사용자의 입력에 의해서만 완전히 사용자 지정 가능한 두 개의 사인파 사이클을 그리는 고급 기술 지표입니다. 사이클을 자동으로 생성하지 않습니다. 모든 사이클은 사용자가 설정한 매개변수에만 기반하여 계산되며, 자동 신호나 예측을 생성하지 않고 가격 진동과 잠재적인 추세 변화를 연구하기 위한 시각적 도구를 트레이더에게 제공합니다. 핵심 사항: 사용자 정의 사이클: 사이클 1 P1 및 2 P2는 사용자가 완전히 구성할 수 있습니다. 사이클 길이, 진폭, 이동 평균, 정확한 시작 날짜와 시간을 설정할 수 있습니다. 사용자가 매개변수를 입력하지 않으면 어떤 사이클도 그려지지 않습니다. 진폭 제어: 각 사이클은 다른 진폭을 가질 수 있어 기준 이동 평균에 대한 진동의 높이를 조정할 수 있습니다. 추세 감지: 빠른 이동 평균과 느린 이동 평균은 사이클의 방향을 나타냅니다: Fast
Mahra Pro Indicator MT5
Mahra Said Mohammed Al Kaabi
Mahra Pro Indicator MT5 Overview Mahra Pro is a MetaTrader 5 chart indicator designed to support structured analysis of XAUUSD (Gold). It combines trend, momentum, volatility and price-structure conditions to identify potential buy and sell setups and display them directly on the chart. The indicator does not open, modify or close trades. All trading decisions and order execution remain under the user's control. Main features • Buy and sell signal arrows on the chart. • Fast and slow EMA lines w
The Oracle Pro
Ottaviano De Cicco
5 (1)
The Oracle Pro: Synthetic Multi-Timeframe Bias Engine for MT5 ️ Summer Launch Offer — Get The Oracle Pro for USD 199 (early buyers). Price rises with traction; final price USD 399. The Oracle Pro is a premium multi-timeframe bias engine for MetaTrader 5, built for demanding and professional traders. It answers one question with discipline: what is the directional bias on each timeframe right now, how strong is it, and how much do the timeframes agree? Everything is computed on closed bars only
IQ FX Gann Levels a precision trading indicator based on W.D. Gann’s square root methods . It plots real-time, non-repainting support and resistance levels to help traders confidently spot intraday and scalping opportunities with high accuracy. William Delbert Gann (W.D. Gann) was an exceptional market analyst, whose trading technique was based on a complex blend of mathematics, geometry, astrology, and ancient mathematics which proved to be extremely accurate. We don't offer free or bonus indic
Quant Direction MT5
Georgios Kalomoiropoulos
Quant Direction 은 3D 시장 분석 도구입니다. 다양한 매개변수에 걸쳐 정확한 백분율 편차를 계산하면서 완벽하게 객관적인 알고리즘 기반 시장 분석을 제공합니다. 첨단 AI 기반 모델링 도구와 엄격한 테스트를 거쳐 개발된 이 알고리즘은 타의 추종을 불허하는 정확도로 시장을 분석합니다. 플랫폼에서 모든 통화쌍 또는 금융 상품을 분석할 수 있습니다. 단기 거래, 데이 트레이딩, 스윙 트레이딩 등 어떤 유형의 거래를 하든 Quant Direction은 최적의 선택입니다. 운영자가 되는 것의 진정한 이점 퀀트 디렉션의 진정한 장점은 감정, 눈의 피로, 과도한 분석을 완전히 배제한다는 점입니다. 더 이상 수십 개의 차트를 일일이 살펴보며 방향을 찾거나 자신의 판단에 끊임없이 의문을 품을 필요가 없습니다. 이 시스템은 8개의 시간 간격(5개월에서 수개월까지)을 밀리초 단위로 처리합니다. 특정 시점의 주요 시장 참여자를 정확하게 식별하여 항상 성공 확률이 가장 높은 방향으로 거래할
Azimuth Pro
Ottaviano De Cicco
5 (7)
Azimuth Pro V2: Synthetic Fractal Structure and Confirmed Entries for MT5 Overview Azimuth Pro is a multi-level swing structure indicator by Merkava Labs . Four nested swing layers, swing-anchored VWAP, ABC pattern detection, three-timeframe structural filtering, and closed-bar confirmed entries — one chart, one workflow from micro-swings to macro-cycles. This is not a blind signal product. It is a structure-first workflow for traders who care about location, context, and timing. ️ Summer Sale
First time on MetaTrader, introducing IQ Star Lines, an original Vedic Astrology Based Intraday Trading Indicator. We don't offer free or bonus indicators in exchange of reviews from you. You won't need any free products with this indicator to make it work. ;) Enjoy! Welcome to the new and updated  IQ Star Lines , the ultimate fusion of ancient planetary cycles and modern quantitative trading, published for the first time on Metatrader. This is an indicator built by the developer, who has spent
Spike Fakeout Detector
Brighton Mufaro Mudzingwa
PainX 400 FAKEOUT DETECTOR MT5 Custom Indicator  ·  Sell-Side Bias  ·  Scalping  ·  RSI(6) Filtered   OVERVIEW   The Spike Fakeout Detector is a non repaint precision technical indicator built exclusively for Crash / PainX synthetic indices on the platform. It is engineered around one of the most consistent and exploitable patterns on this instrument — the false breakout above resistance followed by a sharp price drop. Crash/PainX is a growing index that produces a significant price drop appr
Smart Market Structure Toolkit
Garry James Goodchild
5 (1)
Smart Market Structure Pro by G-Labs — ICT and Smart Money Concepts toolkit with built-in multi-symbol scanner for MetaTrader 5. Break of structure, change of character, order blocks, fair value gaps, liquidity sweeps, premium and discount zones, ICT sessions, confluence scoring, AI trade ideas, and a traffic-light scanner across up to 30 pairs and four timeframes from one chart. Map SMC and ICT on the active chart while the built-in scanner monitors your full watchlist. Each cell shows BUY, S
ARICoins
Temirlan Kdyrkhan
ARICoin is a powerful trading companion designed to generate high-probability entry signals with dynamic TP/SL/DP levels based on volatility. Built-in performance tracking shows win/loss stats, PP1/PP2 hits, and success rates all updated live. Key Features: Buy/Sell signals with adaptive volatility bands Real-time TP/SL/DP levels based on ATR Built-in MA Filter with optional ATR/StdDev volatility Performance stats panel (Success, Profit/Loss, PP1/PP2) Alerts via popup, sound, push, or email Cust
Quantum Momentum Guard (QMG) Advanced Breakout & Momentum Indicator for MetaTrader 5 Quantum Momentum Guard (QMG) is a next-generation MetaTrader 5 trading indicator designed to identify high-probability breakout opportunities using a powerful combination of advanced momentum analysis and high-level mathematical calculations . Unlike ordinary indicators that generate signals based on a single condition, QMG confirms every breakout with momentum strength and mathematical validation , ensuring
Gem SIGNAL
Shengzu Zhong
5 (1)
GEM Signal Pro GEM Signal Pro는 MetaTrader 5용 추세추종형 지표로, 차트에서 더 명확한 신호, 더 구조적인 트레이드 설정, 그리고 더 실용적인 리스크 관리를 원하는 트레이더를 위해 설계되었습니다. 단순한 화살표만 표시하는 것이 아니라, GEM Signal Pro는 전체 트레이드 아이디어를 더 깔끔하고 읽기 쉬운 방식으로 보여줍니다. 조건이 확인되면 진입가, 손절가, 목표가를 차트에 표시하여 트레이더가 설정을 더 효율적으로 검토할 수 있도록 도와줍니다. 작동 방식 이 지표는 먼저 내부 로직에 따라 유효한 초기 신호를 식별합니다. 확인 조건이 충족되면, GEM Signal Pro는 차트에 전체 설정을 표시합니다. 이를 통해 트레이더는 거래 구조를 더 명확하게 보고, 수동 분석 작업을 줄일 수 있습니다. 차트에 표시되는 거래 레벨 확인된 신호에 대해, GEM Signal Pro는 다음을 표시할 수 있습니다. 진입가 손절가 목표가 1 목표가 2 목표가 3 손
Meravith Scanner
Ivan Stefanov
5 (3)
MERAVITH SCANNER는 MetaTrader 5용 전문 금융 시장 지표로, 여러 분석 도구를 하나의 통합 시스템으로 결합합니다. 독점적인 거래량 가중 평균 가격(VWAP) 방법론을 사용하여 모든 계산을 자동으로 수행하며, 주관적인 해석을 완전히 배제합니다. 이 지표는 모든 자산 클래스(Forex, 주식, 지수, 상품, 암호화폐)와 M1부터 월간 차트까지 모든 시간 프레임에서 작동합니다. 기본 원리는 “가격은 거래량을 따른다”입니다. MERAVITH는 기관 거래량이 집중되는 위치를 식별하고, 그 집중에서 수학적으로 정확한 가격 수준을 도출합니다. 예측이나 투기를 하지 않으며, 계산만 수행합니다. MERAVITH SCANNER를 사용하면 28개의 주요 Forex 통화쌍을 모든 시간 프레임에서 단 2~3분 만에 스캔할 수 있습니다. 또한 원하는 시장을 스캔할 수도 있으며, 예를 들어 약 100개의 주식을 약 10분 안에 스캔할 수 있습니다. 지표는 소진 레벨, 균형선, 편차, 통계
Presenting one-of-a-kind Gann Indicator for XAUUSD IQ Gold Gann Levels is a non-repainting, precision tool designed exclusively for XAUUSD intraday trading. It uses W.D. Gann’s square root method to plot real-time support and resistance levels, helping traders spot high-probability entries with confidence and clarity. William Delbert Gann (W.D. Gann) was an exceptional market analyst whose trading technique was based on a complex blend of mathematics, geometry, astrology, and ancient calculation
Market Maker Reversal Scanner MT5
Siyasanga Stephen Mabokela
By the time you've clicked through forty charts looking for a first red day at a monthly high, the setup you wanted has already closed. Market Maker Reversal Scanner reads your Market Watch, finds a fixed set of reversal and exhaustion patterns, scores each one on a transparent 10-point scale, and puts the results in a single sortable panel on one chart. You stop hunting. You start choosing. New in v12.1: a DAYS / SESSIONS switch. Sessions mode runs the same scanner on closed H4 candles and tags
한 문장으로 이해하면 이 인디케이터는 RSI와 MACD, 두 전문가를 하나로 묶은 것 입니다. 두 지표를 따로 보며 판단할 필요 없이, 둘 다 동의할 때만 "매수" 또는 "매도" 화살표를 보여줍니다. 화살표는 다시 그려지지 않습니다 . 한 번 나타나면 그 자리에 고정됩니다. "콤보"의 의미 보통 트레이더는 RSI(가격 움직임의 힘)와 MACD(추세 방향)를 따로 봅니다. 그런데 둘의 신호가 충돌할 때가 많죠. 이 인디케이터는 두 지표가 동시에 같은 방향을 가리킬 때만 신호를 냅니다 . 덕분에 가짜 신호가 훨씬 줄어듭니다. 화면에서 보이는 것 가격 차트와 분리된 인디케이터 창 파란색과 빨간색 화살표 – 바로 쓸 수 있는 매매 신호 확대된 MACD 히스토그램 (모멘텀을 쉽게 파악하도록 더 크고 선명하게 표시) RSI와 MACD 선도 함께 표시되지만, 주목할 것은 화살표 이런 분께 적합합니다 초보자 – 두 지표를 따로 해석하고 모순을 처리할 필요 없음 경험자 – 빠른 신호 필터링, 다시
VTrende Pro
Andrii Diachenko
5 (1)
VTrende Pro - MTF indicator for trend trading with a display panel for MT5 *** Videos can be translated into any language using subtitles (video language - Russian) Although the signals of the VTrende Pro indicator can be used as signals of a full-fledged trading system, it is recommended to use them in conjunction with the Bill Williams TS. VTrende Pro is an extended version of the VTrende indicator. Difference between Pro version and VTrende: - Time zones - Signal V - signal 1-2 waves -    S
KURAMA GOLD SIGNAL PRO (MT5) — 7중 필터 · 자동 TP/SL · 품질 점수 · 시그널 기록 저장 | XAUUSD 완전 트레이딩 시스템 실시간 리페인트 없음. 시그널이 나타나는 순간 화살표, 진입, TP, SL이 그 자리에 고정되어 이후 절대 움직이지 않습니다. 여러분이 거래하는 것은 바로 이 실시간 시그널입니다. 그리고 v7.20에서는 실제로 발신된 모든 시그널이 자동 저장되어 재시작 후에도 정확히 복원됩니다. 구매자 전용 보너스 평생 라이선스를 구매하시면 AI Zone Radar($59 상당) + 완전 PDF 매뉴얼을 무료로 드립니다. 제품 가격에 더해 $59 상당의 보너스가 따라옵니다. 구매 후 MQL5로 메시지를 보내주세요. AI Zone Radar: https://www.mql5.com/en/market/product/175834 골드 트레이더 커뮤니티에서 실제로 사용되며 정확성과
제작자의 제품 더 보기
Manzano Footprint Order Flow
Patricia Manzano Gomez
5 (1)
MANZANO FOOTPRINT ORDER FLOW Footprint, Order Flow and Volume Analysis for MetaTrader 5 Manzano Footprint Order Flow is an analytical indicator for MetaTrader 5 that brings together Footprint charts, Bid x Ask, Delta, Cumulative Delta (CVD), Imbalances, Volume Profile, VWAP, Market Depth and Time & Sales in an interactive environment. It allows traders to examine activity within individual candles, identify volume concentrations, compare buying and selling pressure, and analyse how market partic
Harmonic Pattern Suite Pro
Patricia Manzano Gomez
Harmonic Pattern Suite Pro Introduction Harmonic Pattern Suite Pro is an indicator designed to identify and display harmonic structures on the chart based on X-A-B-C-D sequences. Its purpose is to present pattern formations that meet geometric and proportional criteria, providing a clear visual representation directly on the chart. The indicator automates the detection process, removing the need for manual measurement of ratios and allowing the user to review the structural configuration withou
FREE
Manzano Risk Box
Patricia Manzano Gomez
Manzano Risk Reward Box The PRO version, including direct trade execution and automatic R-based trailing management, is available. For information about the PRO version, please contact us via MQL5 private message. Manzano Risk Reward Box is a visual trade planning and risk management tool for MetaTrader 5, designed to help traders prepare their positions directly on the chart before execution. It allows users to create visual BUY and SELL scenarios, define the percentage of the account they want
FREE
Manzano Quant Engine MTT4
Patricia Manzano Gomez
¡¡ 7-Day Free Trial!! info@manzanotrading.com Advanced Statistical Market Structure, Volume Analysis and Decision Support Framework for MetaTrader 5   Manzano Quant Engine is an advanced analytical indicator that combines adaptive trend modelling, statistical deviation analysis, volume-based market structure, multi-timeframe confirmation, and quantitative scoring — all within a single visual framework.   Its objective is not to predict future prices, but to help traders interpret market behaviou
Smart Adaptive Trend Flow MT4 Professional adaptive trend, market structure, price levels and flow analysis indicator for MetaTrader 4. Would you like to test it before purchasing? Request a fully functional trial version by sending us a private message through MQL5.com and evaluate the indicator directly on your own charts. A Complete Market View Smart Adaptive Trend Flow MT4 combines several analytical components in a single indicator: Adaptive trend analysis. BULLISH and BEARISH market regim
Manzano Quant Engine
Patricia Manzano Gomez
Manzano Quant Engine Advanced Statistical Market Structure, Volume Analysis and Decision Support Framework for MetaTrader 5   Manzano Quant Engine is an advanced analytical indicator that combines adaptive trend modelling, statistical deviation analysis, volume-based market structure, multi-timeframe confirmation, and quantitative scoring — all within a single visual framework.   Its objective is not to predict future prices, but to help traders interpret market behaviour more effectively and ma
Manzano Squeeze Pro
Patricia Manzano Gomez
7-day free trial available with full functionality. Contact us at info@manzanotrading.com to request yours. Manzano Squeeze Pro is a professional squeeze momentum dashboard for MetaTrader 5. It is designed to identify periods of low volatility where the market is accumulating energy before a significant directional move, and to help traders position themselves in the direction of that move at the earliest possible moment. The core concept behind Manzano Squeeze Pro is volatility compression. Wh
If you would like a free 7-day trial with full access to all features, send me a private message on MQL5 and I will walk you through how to get the complete evaluation version. Manzano Market Intelligence Matrix Every trade is shaped by far more than the chart in front of you. Currency strength, asset correlations, market session, and overall portfolio exposure all influence any decision you make. Manzano Market Intelligence Matrix was built to deliver exactly that kind of context — all from a s
Smart Adaptive Trend Flow MT5 Professional adaptive trend, market structure, price levels and flow analysis indicator for MetaTrader 5. Would you like to test it before purchasing? You can request a fully functional trial version by sending us a private message through the MQL5 messaging system . This allows you to evaluate the indicator and all its features before making a purchase decision. A Complete Market View in a Single Chart Smart Adaptive Trend Flow MT5 has been developed to provide a
필터:
리뷰 없음
리뷰 답변