Market Structure Viewer

  • Индикаторы
  • Adari Manohar
    Adari Manohar
    Forex trader and MQL5 developer focused on market structure, Smart Money Concepts, multi-timeframe analysis and automated trading systems. I build practical MetaTrader 5 tools that convert complex market analysis into structured visual and algorithmic workflows. My work includes market structure
  • Версия: 1.30
  • Обновлено: 26 сентября 2026
  • Активации: 5
MARKET STRUCTURE VIEWER FOR MT5

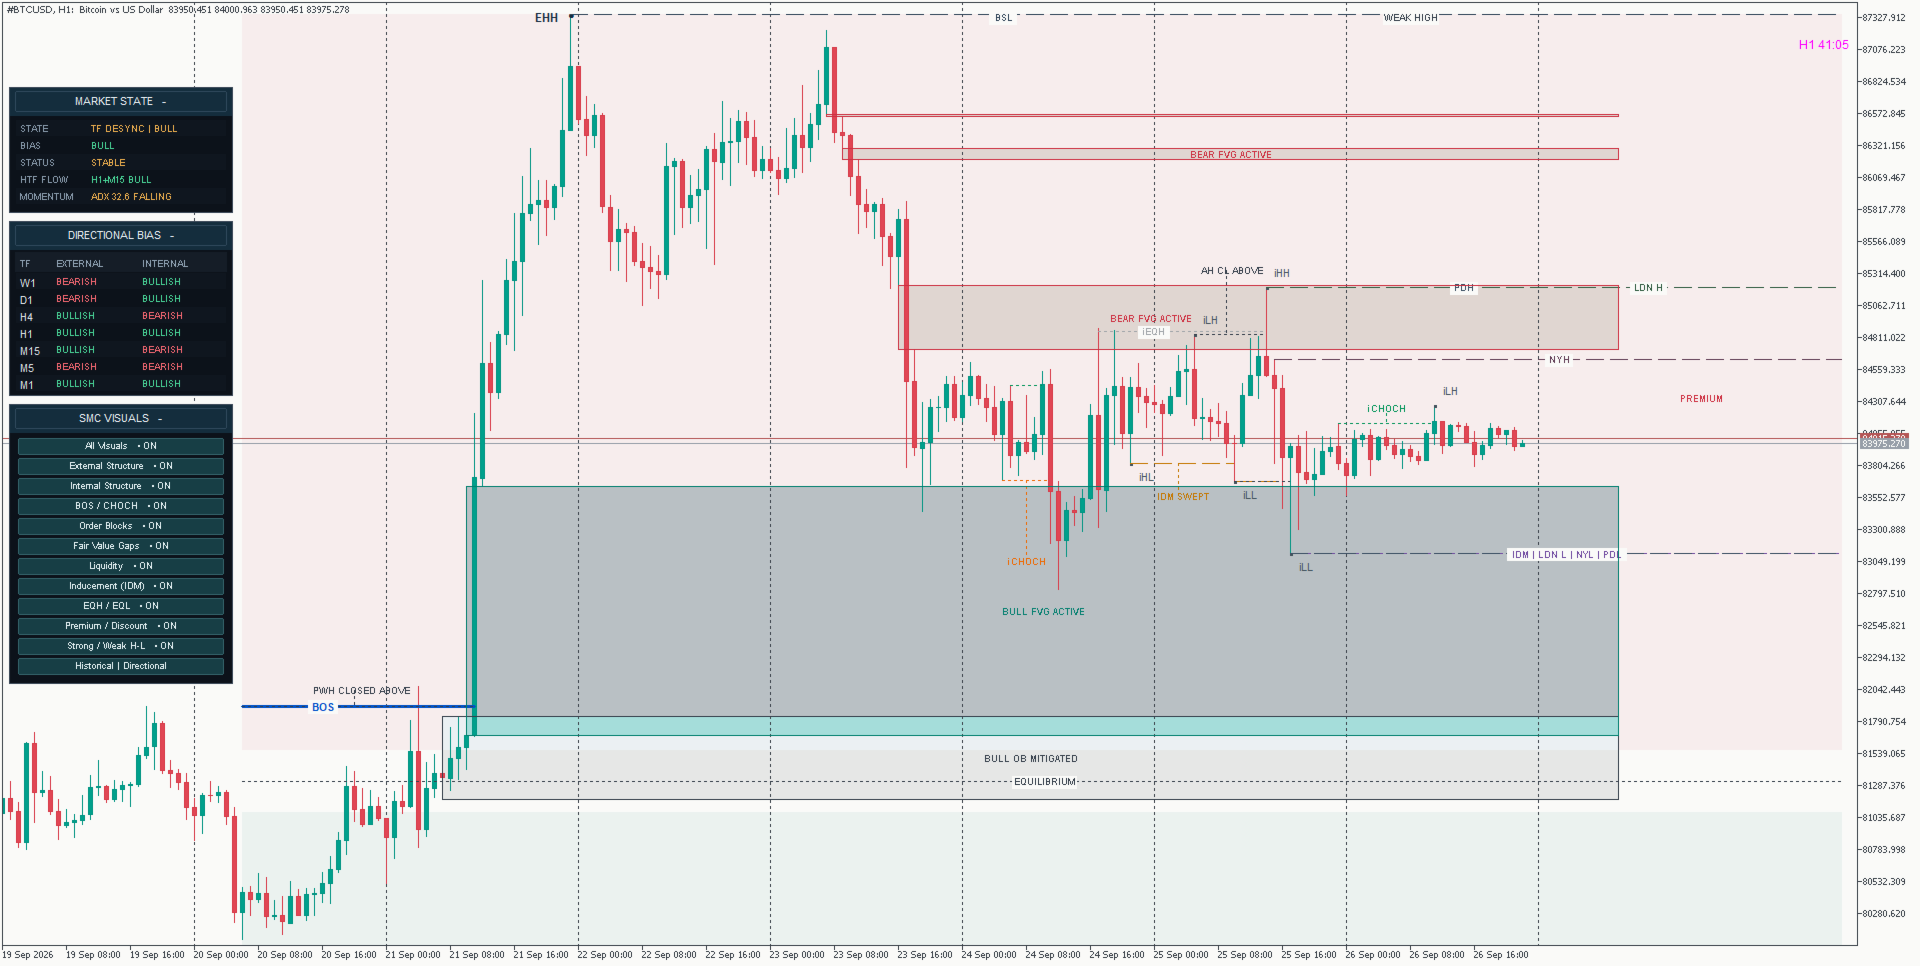
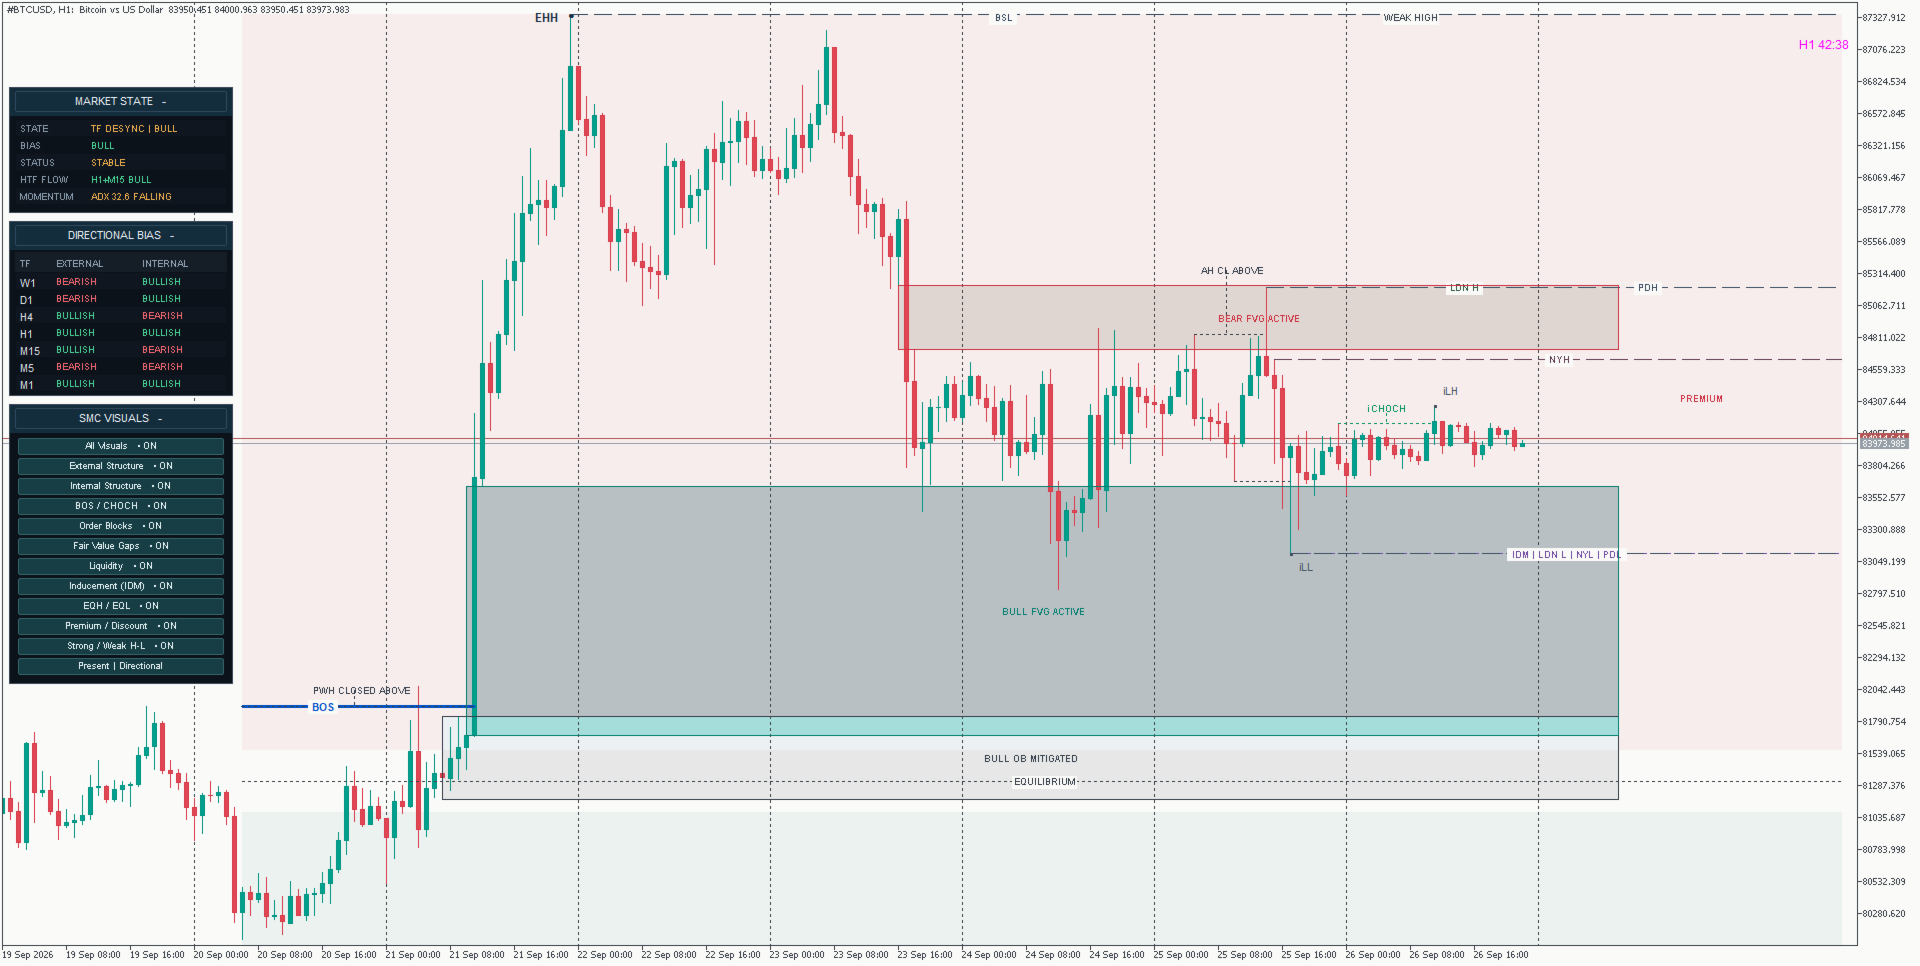
Market Structure Viewer is a multi-timeframe Smart Money Concepts (SMC) analysis workspace for MetaTrader 5.

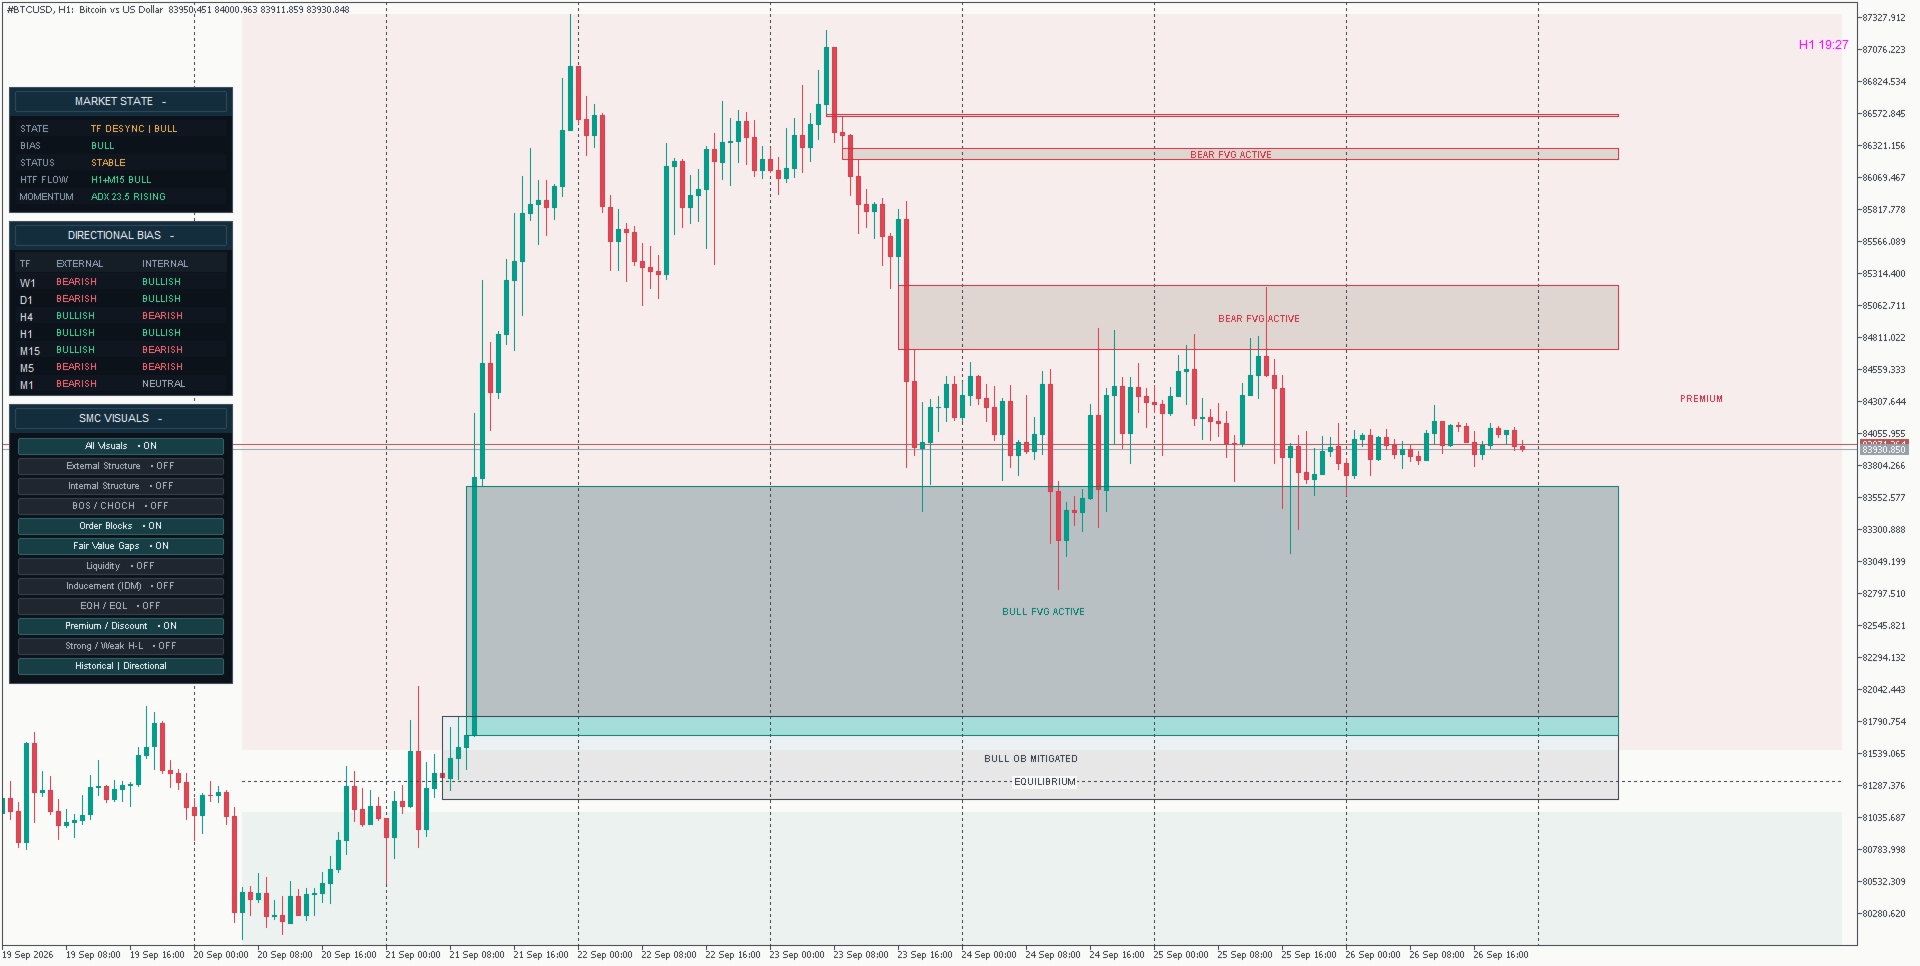
Instead of displaying BOS, CHOCH, Order Blocks, Fair Value Gaps or liquidity as isolated chart elements, the indicator combines external and internal market structure, multi-timeframe directional bias, market-state context, liquidity, price zones and momentum into one structured workflow.

The objective is to help discretionary traders understand not only what structural event has occurred, but also where that event sits inside the broader market context.

Market Structure Viewer is an analysis and visualization tool only. It does not automatically open, modify or close trades.


## WHY MARKET STRUCTURE VIEWER IS DIFFERENT

Many SMC indicators focus mainly on drawing individual concepts such as BOS, CHOCH, Order Blocks and Fair Value Gaps.

Market Structure Viewer is designed around the relationship between those concepts.

For example, a bullish M1 BOS has a very different context when M15 and H1 are also bullish compared with the same M1 BOS appearing against bearish higher-timeframe structure.

The viewer therefore combines:

- Market structure
- Multi-timeframe directional bias
- Market state
- Liquidity
- Inducement
- Order Blocks
- Fair Value Gaps
- Premium / Discount positioning
- Higher-timeframe flow
- Momentum context

This provides a more complete view of the current market environment without requiring the trader to constantly switch between multiple charts.


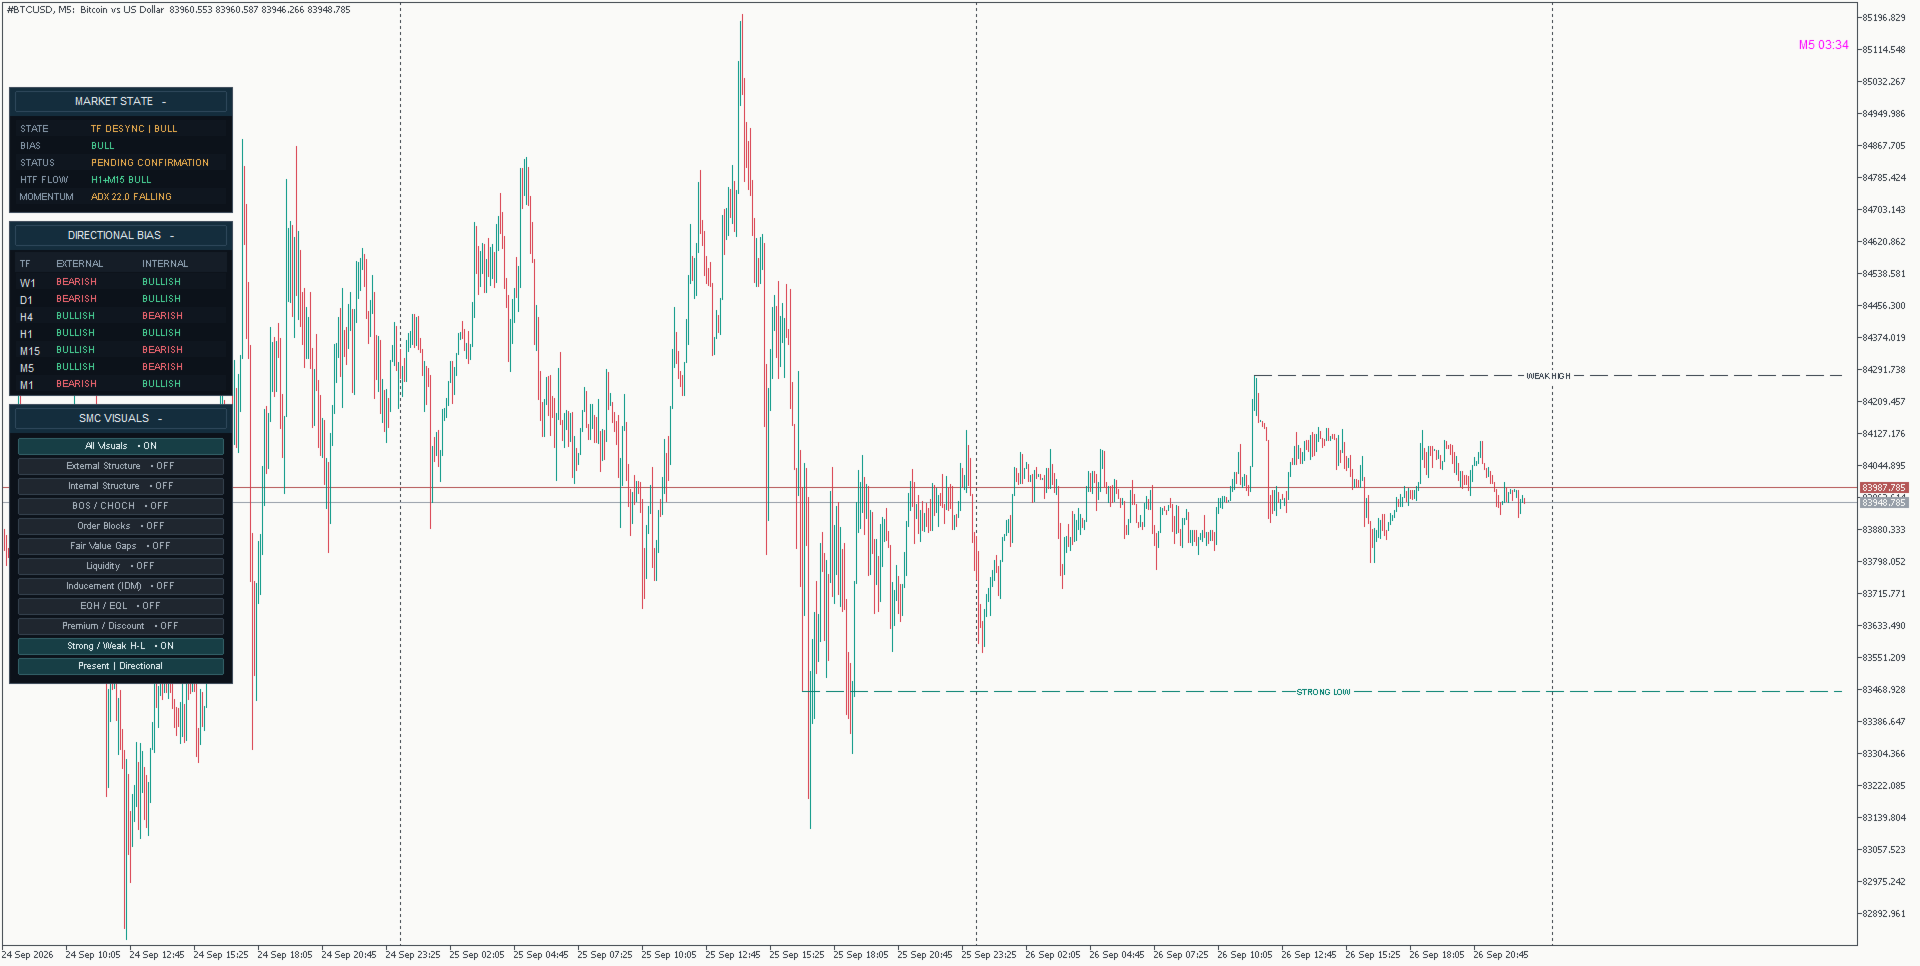
## MULTI-TIMEFRAME DIRECTIONAL BIAS

The Directional Bias panel monitors both External and Internal market structure across:

- W1
- D1
- H4
- H1
- M15
- M5
- M1

External structure represents the broader directional structure of each timeframe, while internal structure shows the more recent movement developing inside that larger structure.

This makes it easier to identify:

- Higher-timeframe alignment
- Lower-timeframe pullbacks
- Counter-directional movement
- Possible structural transitions
- External and internal disagreement

A lower-timeframe bullish move does not automatically mean that the higher-timeframe structure has turned bullish.

The panel helps keep both layers visible at the same time.


## MARKET STATE PANEL

The Market State panel provides a compact summary of the current market environment.

Depending on current conditions, the viewer can classify the market into states such as:

- Strong Bull Trend
- Healthy Bull Trend
- Strong Bear Trend
- Healthy Bear Trend
- Early Expansion
- Decaying Chop
- Compression / Range
- Timeframe Desynchronization

The panel also displays:

BIAS
Current directional tendency.

STATUS
Current classification, trend condition or transition status.

HTF FLOW
Relationship between H1 and M15 structural direction.

MOMENTUM
M5 ADX value together with rising, falling or relatively flat momentum behaviour.

The Market State panel is designed as a context layer, not as an automatic entry signal.

The classification engine uses confirmation and transition logic to avoid treating every short-term change as a complete market-state reversal.


## EXTERNAL AND INTERNAL MARKET STRUCTURE

Market Structure Viewer separates broader external structure from faster internal structure.

This helps distinguish between:

- Structural continuation
- Internal corrections
- Pullbacks
- Potential directional transitions

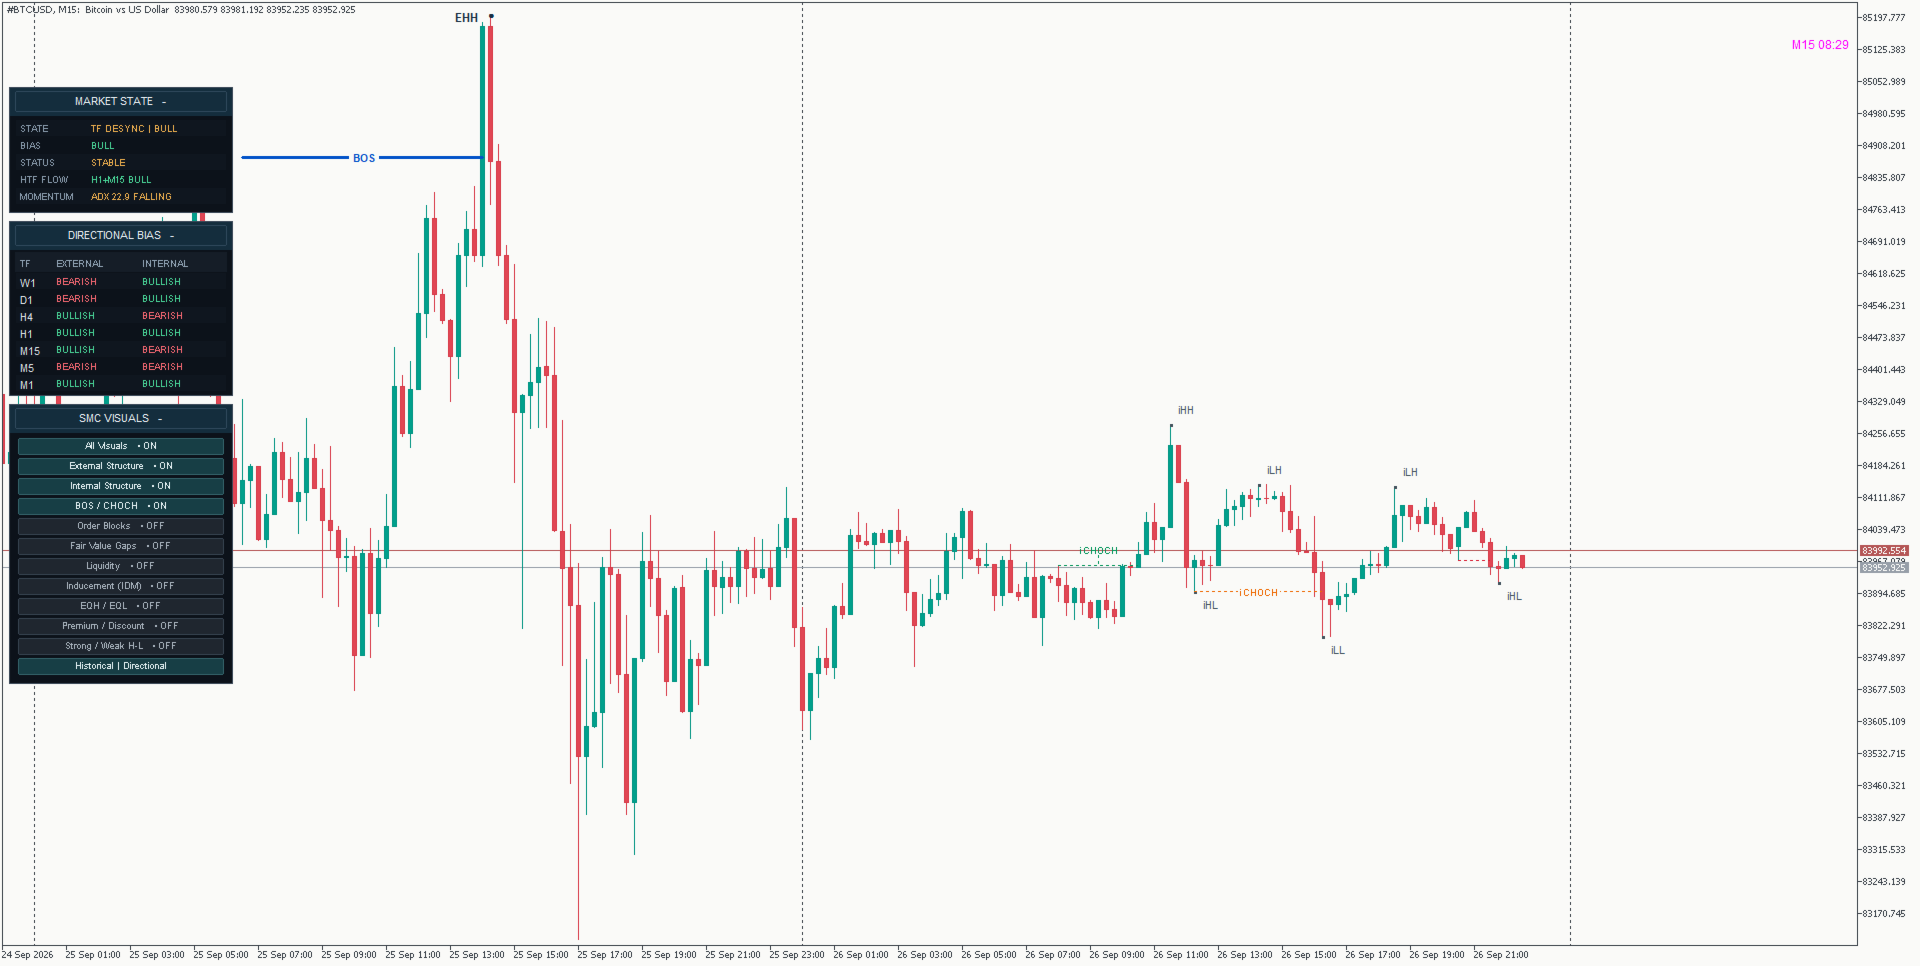
The indicator displays:

- External structural highs and lows
- Internal structural highs and lows
- Bullish and bearish BOS
- Bullish and bearish CHOCH
- Internal BOS
- Internal CHOCH

A lower-timeframe CHOCH can therefore be viewed inside its higher-timeframe context instead of automatically being treated as a complete trend reversal.


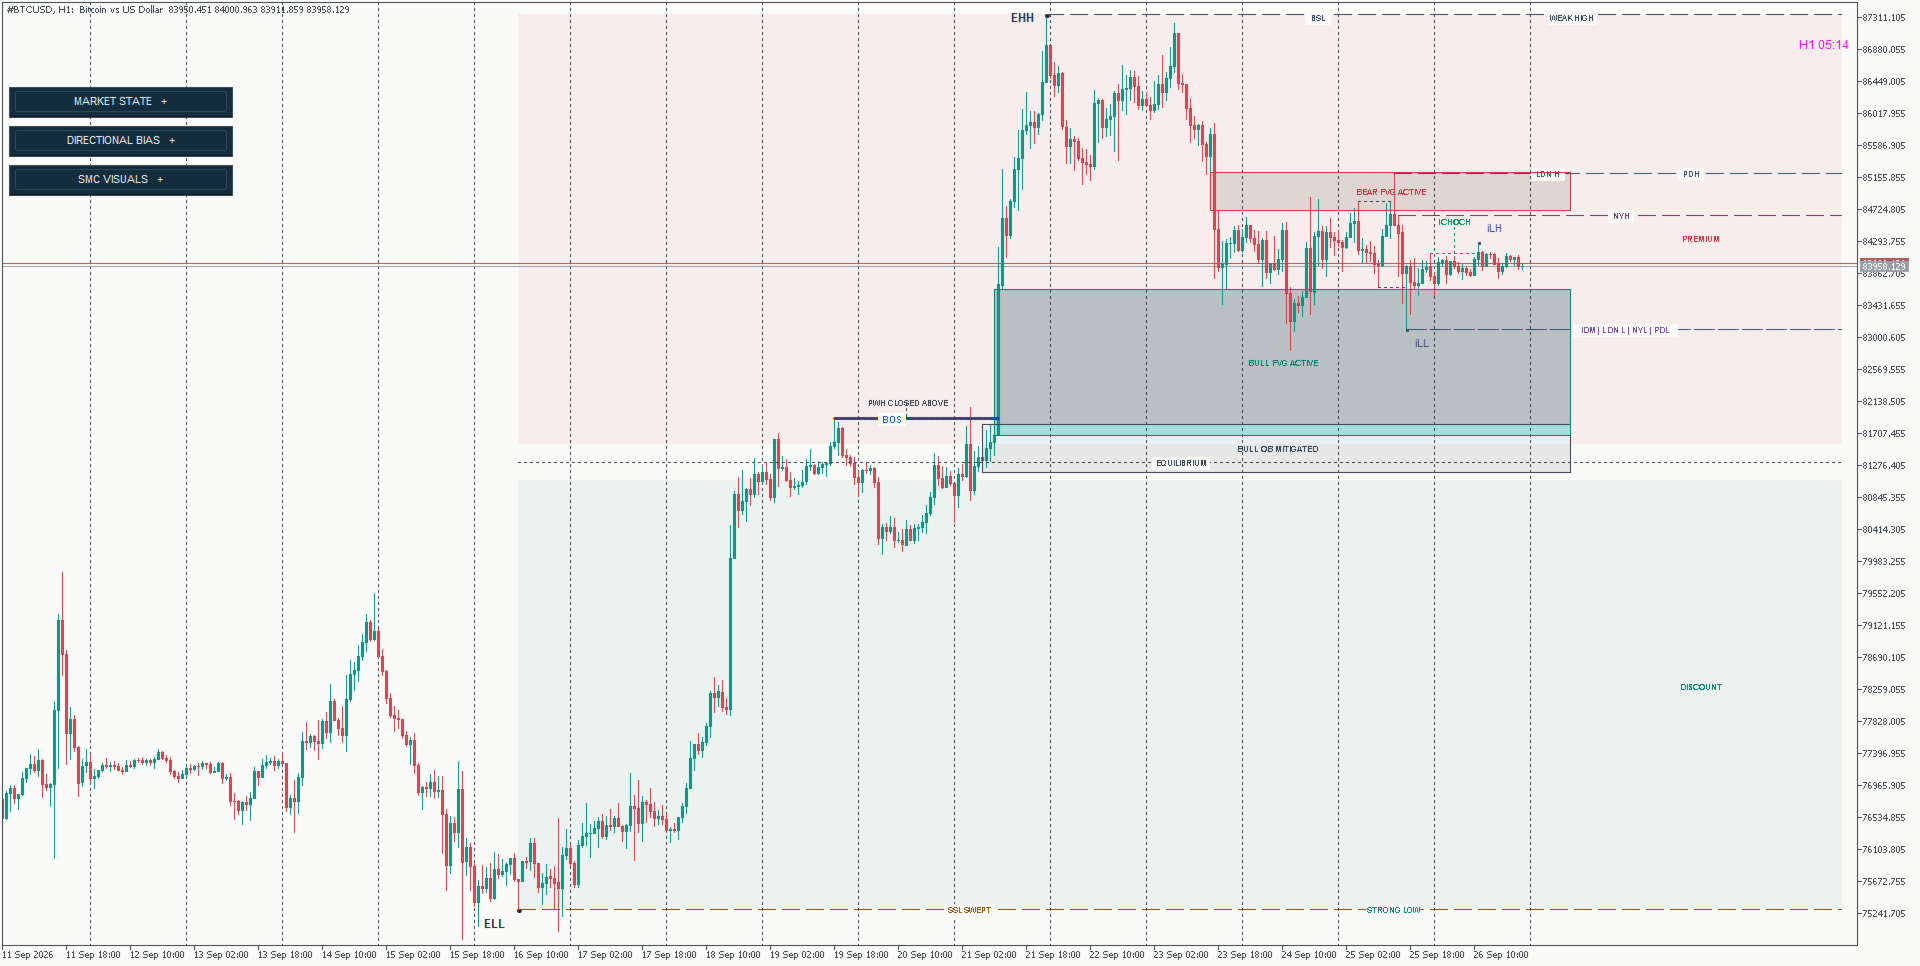
## BOS AND CHOCH

Break of Structure (BOS) is used to identify confirmed continuation through an important structural level.

Change of Character (CHOCH) highlights a structural break that conflicts with the previous directional state and may indicate a transition.

External and internal structural events are tracked separately so that smaller internal changes do not automatically replace the broader structural view.

The structure engine is designed around confirmed price structure rather than unfinished intrabar movement.


## ORDER BLOCKS

The indicator identifies bullish and bearish Order Block areas associated with relevant price movement and structural context.

Instead of treating every opposite candle as an Order Block, the viewer focuses on zones connected with meaningful displacement and structure.

Order Blocks can be evaluated together with:

- Market direction
- Liquidity
- Fair Value Gaps
- Premium / Discount positioning
- Higher-timeframe bias

This helps the trader view each zone as part of the broader market structure rather than as an isolated signal.

Order Block states may update as price interacts with, mitigates or invalidates previously identified zones.


## FAIR VALUE GAPS

Market Structure Viewer detects bullish and bearish Fair Value Gaps created during directional displacement.

Fair Value Gaps can be used as potential areas of interest during retracements or continuation scenarios.

The value of an FVG depends on its context.

For example, a bullish Fair Value Gap located below current price during bullish structure has a different meaning from the same type of gap appearing against bearish higher-timeframe structure.

The viewer allows Fair Value Gaps to be analysed together with structural direction, liquidity and active price zones.

FVG states can update as price interacts with or fills previously identified gaps.


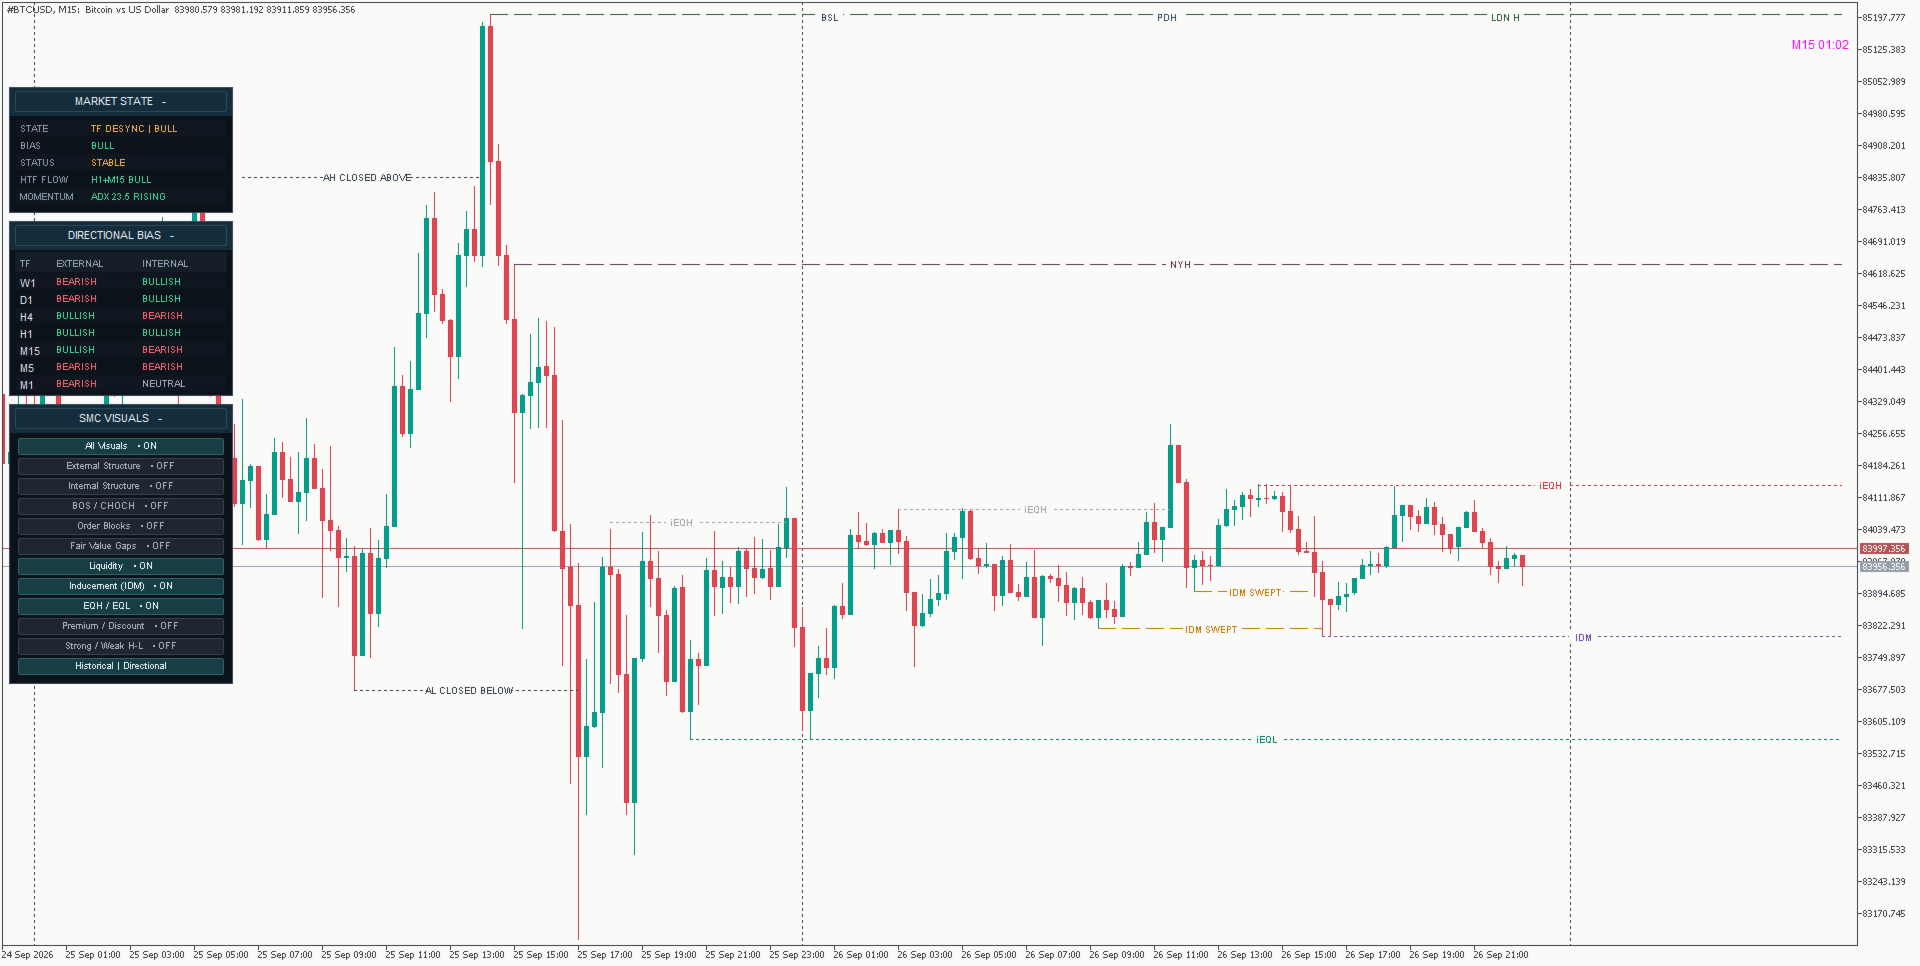
## LIQUIDITY MAPPING

The indicator highlights relevant liquidity levels and tracks how price interacts with them.

Liquidity references can include important structural highs and lows and other significant price levels.

The viewer can distinguish between active liquidity and levels that have already been interacted with.

Liquidity levels can also change state after being:

- Swept
- Broken
- Closed through

This helps prevent previously consumed liquidity from being interpreted in the same way as untouched liquidity.


## INDUCEMENT (IDM)

Inducement levels represent smaller internal structural references that may be targeted before price reaches a larger external objective.

IDM can provide additional context when analysing:

- Pullbacks
- Liquidity sweeps
- Internal structure
- External targets
- Order Blocks
- Fair Value Gaps

The indicator displays inducement separately from broader liquidity so that the trader can distinguish between different structural objectives.


## EQUAL HIGHS AND EQUAL LOWS

Equal Highs (EQH) and Equal Lows (EQL) identify areas where multiple swing points form around similar price levels.

These areas may represent concentrated liquidity.

The viewer marks these levels directly on the chart so they can be analysed together with:

- BOS / CHOCH
- External structure
- Internal structure
- Liquidity
- Order Blocks
- Fair Value Gaps

Previously formed equal levels can also reflect lifecycle changes after price sweeps or closes through them.


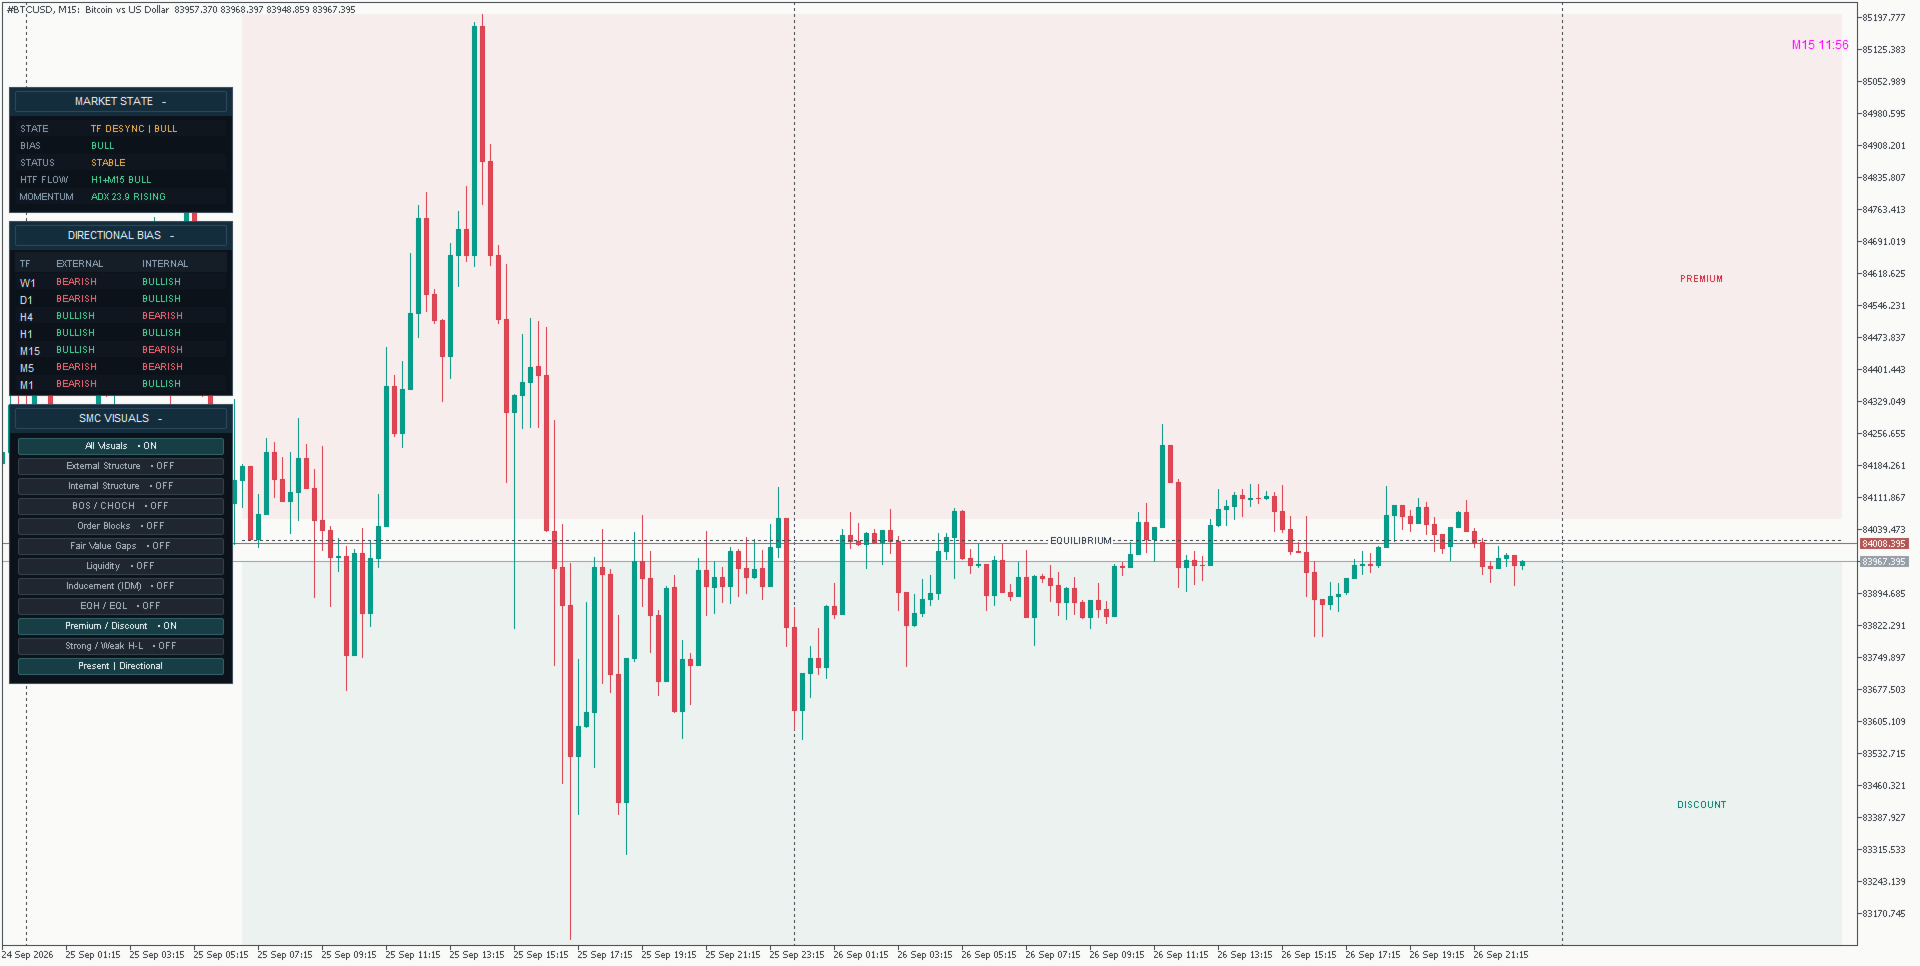
## PREMIUM, DISCOUNT AND EQUILIBRIUM

The active external structural range is divided into:

- Premium
- Equilibrium
- Discount

The midpoint of the current external structural range is used as Equilibrium.

The area above Equilibrium represents Premium, while the area below represents Discount.

These zones are contextual filters, not automatic trading signals.

For example:

A bullish Order Block or Fair Value Gap located in Discount during bullish structure may provide different context from the same zone positioned high in Premium.

Similarly, a bearish area of interest located in Premium may provide more relevant structural context during bearish conditions.


## STRONG AND WEAK HIGHS / LOWS

The viewer can also identify Strong and Weak structural highs and lows.

These levels provide additional information about the current structural range and possible directional objectives.

They can be displayed or hidden independently through the visual control panel.


## HIGHER-TIMEFRAME FLOW

Higher-timeframe flow provides a simplified view of the relationship between H1 and M15 structure.

The panel can display conditions such as:

- H1 + M15 Bull
- H1 + M15 Bear
- H1 / M15 Mixed

This helps quickly identify whether lower-timeframe analysis is aligned with or moving against the broader structural environment.


## MOMENTUM CONTEXT

The Market State panel includes M5 ADX information together with its recent slope.

Momentum can be displayed as:

- Rising
- Falling
- Flat

This provides additional context about whether directional strength is increasing, weakening or remaining relatively stable.

Momentum should be interpreted together with structure and market state rather than used as a standalone signal.


## INTERACTIVE SMC VISUAL CONTROLS

A major challenge with advanced SMC analysis is chart clutter.

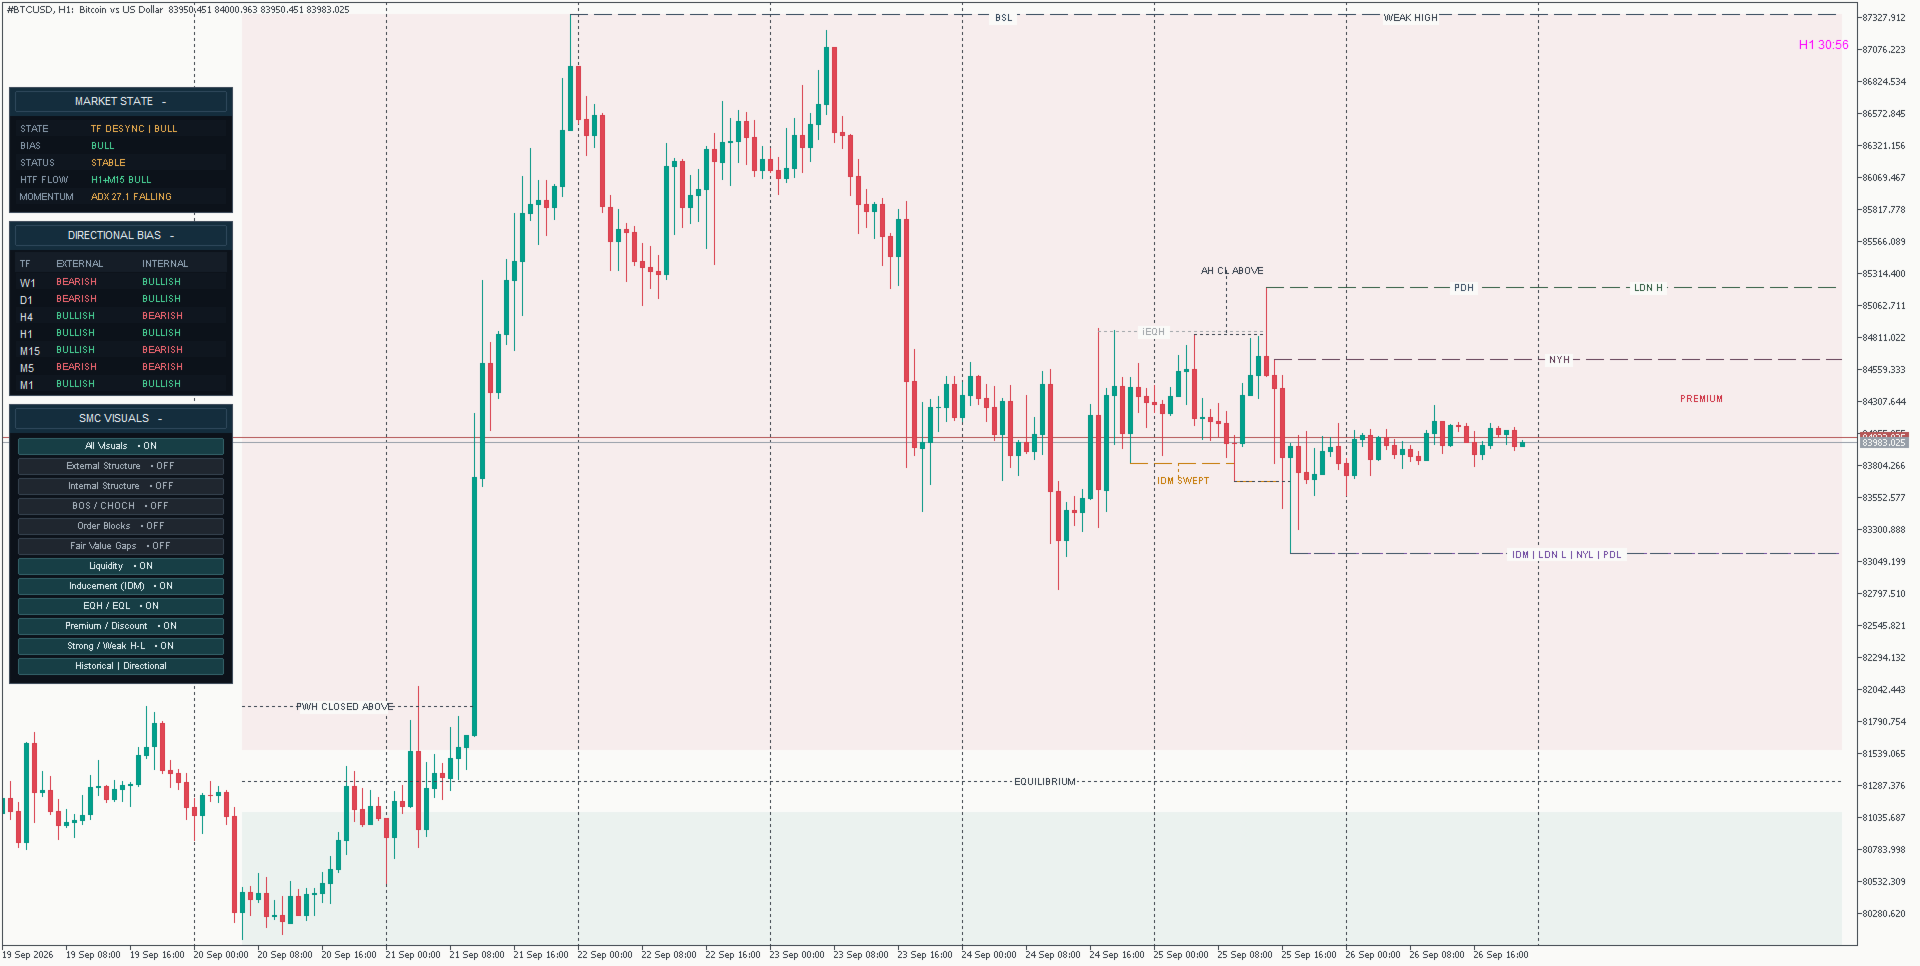
Market Structure Viewer includes an interactive control panel that allows analytical layers to be enabled or disabled individually.

Available visual controls include:

- All Visuals
- External Structure
- Internal Structure
- BOS / CHOCH
- Order Blocks
- Fair Value Gaps
- Liquidity
- Inducement (IDM)
- EQH / EQL
- Premium / Discount
- Strong / Weak Highs and Lows

The All Visuals control acts as a master switch for chart overlays.

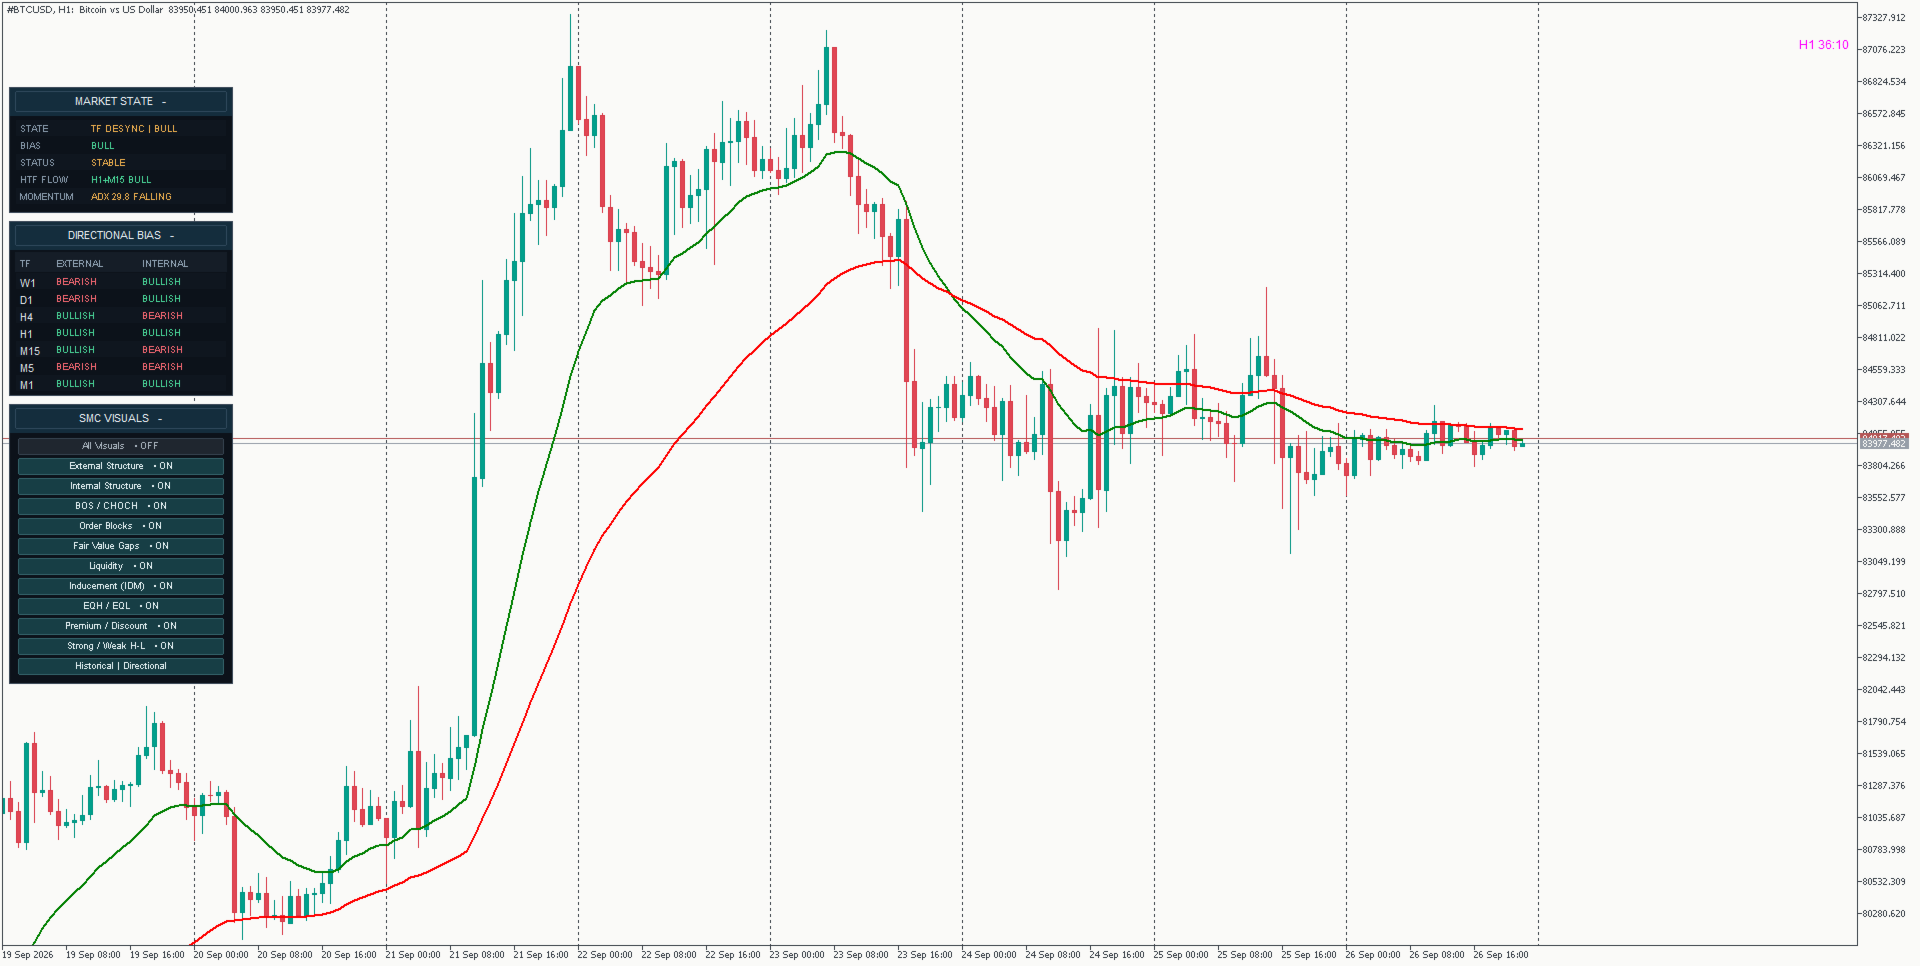
Turning All Visuals OFF temporarily hides the SMC chart drawings without changing the individual visual-layer selections.

When All Visuals is turned back ON, the previously selected visual settings are restored.

The Market State and Directional Bias panels operate independently from the All Visuals master control.

Individual layers can still be enabled or disabled separately according to the type of analysis currently being performed.

For example, a trader studying liquidity can temporarily hide Order Blocks and Fair Value Gaps and focus only on Liquidity, IDM and EQH/EQL.


## PRESENT AND HISTORICAL DISPLAY MODES

Market Structure Viewer provides two display modes for different types of analysis.


### PRESENT MODE

Present Mode focuses on the most recent and currently relevant market structure.

It reduces historical chart clutter by prioritizing the latest structural highs and lows, BOS/CHOCH events, active Order Blocks, Fair Value Gaps, liquidity references and other current SMC information.

This mode is useful when the main objective is analysing the current market environment.

Present Mode is designed to keep the chart cleaner while preserving the most relevant current structural context.


### HISTORICAL MODE

Historical Mode provides a broader view of previous market structure and structural events.

More historical structural highs and lows, BOS/CHOCH events, Order Blocks, Fair Value Gaps, liquidity references, inducement levels, EQH/EQL and other SMC information can be displayed.

When the chart is scrolled backward, the viewer adapts to the visible historical area and rebuilds relevant SMC information for that part of the chart.

This makes it possible to review previous structural development directly within historical price action.

Historical calculations are designed around the historical area being reviewed instead of simply projecting the latest market state backward across the chart.

This mode is useful for:

- Manual chart review
- Studying previous market behaviour
- Reviewing structural development
- Analysing previous BOS / CHOCH events
- Reviewing historical Order Blocks and Fair Value Gaps
- Studying liquidity interactions
- Comparing different market environments

Present and Historical modes change how chart information is displayed.

They do not change the underlying purpose of the Market State or Directional Bias panels.


## VISUAL THEMES

Different visual themes are available to improve chart readability.

These include:

- Institutional Neutral
- Monochrome
- Directional Color

Changing the visual theme does not change the analytical logic of the indicator.

It only changes how structural information is presented.


## COLLAPSIBLE PANELS

The Market State, Directional Bias and SMC Visuals panels can be collapsed when additional chart space is required.

This is especially useful on lower timeframes where price action develops quickly and screen space is important.

Collapsing a panel changes the interface layout only.

The underlying analytical engine can continue updating independently.


## HOW TO USE

1. Attach Market Structure Viewer to an MT5 chart.

2. Allow sufficient historical data to load for all required timeframes.

3. Begin with the Market State and Directional Bias panels to understand the broader market environment.

4. Review the external and internal structure of the current timeframe.

5. Use BOS and CHOCH to understand structural continuation or possible transition.

6. Analyse nearby liquidity, inducement, EQH/EQL, Order Blocks and Fair Value Gaps.

7. Check whether price is positioned in Premium, Discount or near Equilibrium.

8. Compare lower-timeframe events with higher-timeframe directional bias.

9. Use Present Mode for current-market analysis or Historical Mode when reviewing previous price action and structural development.

10. Use the All Visuals master control or individual visual-layer controls to keep the chart focused on the information required for the current analysis.

11. Make the final trading decision using your own strategy and risk-management rules.


## EXAMPLE 1: TREND ALIGNMENT

Suppose M1 prints a bullish BOS.

If M15 and H1 are also bullish and the market is trading from a relevant Discount area, the lower-timeframe bullish break is occurring in alignment with the broader market structure.

If M15 and H1 remain bearish, the same bullish M1 BOS may instead represent a lower-timeframe retracement.

The viewer helps expose this difference directly on the chart.


## EXAMPLE 2: LIQUIDITY AND PRICE ZONES

Suppose price sweeps an Equal Low and then reacts from a bullish Order Block or Fair Value Gap located in Discount.

The liquidity sweep, structural location and higher-timeframe bias can be evaluated together instead of treating the Order Block or FVG as an independent signal.

This is the main purpose of Market Structure Viewer: combining several structural elements into one coherent analytical framework.


## EXAMPLE 3: PRESENT VS HISTORICAL REVIEW

Suppose the trader is analysing the current H1 market structure.

Present Mode can be used to keep the chart focused on the most recent structural information and active areas of interest.

If the trader wants to study how the same market behaved several days earlier, Historical Mode can be selected and the chart can be scrolled backward.

The viewer then provides historical structural context around the area being reviewed.

This makes the two modes useful for different purposes without requiring separate indicators.


## WHO IS THIS INDICATOR FOR?

Market Structure Viewer may be useful for traders who use:

- Smart Money Concepts
- Market Structure
- BOS / CHOCH analysis
- Order Blocks
- Fair Value Gaps
- Liquidity concepts
- Multi-timeframe analysis
- Premium / Discount analysis
- Discretionary price-action trading

It is designed for traders who want a structured visual workspace rather than an automatic signal generator.


## IMPORTANT INFORMATION

Market Structure Viewer is a discretionary analysis tool.

It does not:

- Automatically open trades
- Automatically close trades
- Manage positions
- Guarantee profitable trades
- Predict future market movement
- Replace risk management

Market conditions can change and structural classifications may update as new candles close and new information becomes available.

Market State classifications, structural levels, liquidity states, Order Blocks, Fair Value Gaps and other displayed information can update as new confirmed market information becomes available.

Historical visualisation is intended for analysis and review. It should not be interpreted as a guarantee that historical market behaviour will repeat.

Results and displayed levels can vary slightly between brokers because of differences in price feeds and available historical data.

Sufficient historical data must be available for multi-timeframe calculations.

The final interpretation, entry decision, position sizing, stop loss, take profit and overall risk management remain the responsibility of the trader.


## FINAL NOTE

Market Structure Viewer is designed to reduce repetitive chart work and organize complex Smart Money Concepts into a clearer multi-timeframe framework.

Instead of switching constantly between charts and manually combining structure, liquidity, zones and directional bias, the indicator brings these elements together in one MT5 workspace.

The goal is simple:

More structured analysis.
Less chart clutter.
Better visibility of the market context.
Рекомендуем также
Structure King AI Signal Structure King AI Signal is a professional MetaTrader 5 trading indicator designed to help traders analyze market structure, trend direction, multi-timeframe confirmation and trade management from one clean dashboard. Key Features • Market Structure & Trend Analysis • BUY / SELL Signals • Multi-Timeframe (HTF) Confirmation • Entry Price Levels • Dynamic Stop Loss (SL) • TP1 / TP2 / TP3 Levels • ATR Volatility Analysis • ADX Trend Strength Filter • Adaptive Market Filter
RBreaker Gold Indicators — это краткосрочная внутридневная торговая стратегия для фьючерсов на золото, которая сочетает в себе два подхода: трендовое следование и внутридневные развороты. Она позволяет не только получать прибыль при трендовом движении, но и своевременно фиксировать прибыль при развороте рынка, открывая позиции в новом направлении. Данная стратегия на протяжении 15 лет подряд входила в десятку самых прибыльных торговых стратегий по версии американского журнала Futures Truth. Она
What Is Trend Master Pro? Trend Master Pro   is a professional-grade trend trading indicator built for MetaTrader 5. It was designed with one goal in mind — to keep you on the right side of the market at all times by combining three powerful technical tools into a single, clean, easy-to-read display directly on your price chart. Instead of cluttering your screen with multiple separate indicators, Trend Master Pro fuses an   EMA Ribbon trend filter , a   ZigZag swing point engine , and a   breako
SPECIAL LAUNCH OFFER: $30 (1-Month Rent) Limited time offer to build our community and gather feedback! AmbM GOLD Institutional Scalper A high-precision M5 algorithm for XAUUSD (Gold) , engineered to trade exclusively at Institutional Liquidity Levels ($5/$10 psychological marks). PERFORMANCE DATA (BUY ONLY) • Win Rate: 87.09%. • Safe Growth: +$4,113 profit on $10k (13.75% Max Drawdown). • Extreme Stress Test: Successfully generated +$22,997 in a 5-year stress test (2020-2026), proving
Your Trend Friend
Luigi Nunes Labigalini
5 (1)
The trend is your friend! Look at the color of the indicator and trade on that direction. It does not  repaint. After each candle is closed, that's the color of the trend. You can focus on shorter faster trends or major trends, just test what's most suitable for the symbol and timeframe you trade. Simply change the "Length" parameter and the indicator will automatically adapt. You can also change the color, thickness and style of the lines. Download and give it a try! There are big movements w
STRICTLY FOR BOOM INDEX ONLY!!!!! Here I bring the Maximum Trend Arrows OT1.0 MT5 indicator. This indicator is made up of a combination of different trend indicators for entries and exits, for entries an orange arrow will paint on the chart below the current market and a red flag for closing of trades and it produces buy arrows only. When the orange arrow appears, it will appear along with it's sound to notify you. The 1H timeframe is recommended, don't use it anywhere else than on the 1H timefr
Noize Absorption Index - is the manual trading system that measures the difference of pressure between bears forces and bulls forces. Green line - is a noize free index that showing curent situation. Zero value of index shows totally choppy/flat market.Values above zero level shows how powerfull bullish wave is and values below zero measures bearish forces.Up arrow appears on bearish market when it's ready to reverse, dn arrow appears on weak bullish market, as a result of reverse expectation.
Mine Farm is one of the most classic and time-tested scalping strategies based on the breakdown of strong price levels. Mine Farm is the author's modification of the system for determining entry and exit points into the market... Mine Farm - is the combination of great potential with reliability and safety. Why Mine Farm?! - each order has a short dynamic Stop Loss - the advisor does not use any risky methods (averaging, martingale, grid, locking, etc.) - the advisor tries to get the most
Fabii Half Trend Baseline
Fabien Georges Andre Guillemaud
Перестаньте торговать против тренда старшего таймфрейма. Две базовые линии, один график. Без перерисовки. Любая пара, любой таймфрейм. На вашем графике за 2 минуты. Бесплатная демо-версия в Strategy Tester. Get more indicators here Baselines, volatility filters and oscillators. No repaint. Зачем это нужно Вы открываете сделку, потому что линия на графике стала зелёной. Затем вы открываете старший таймфрейм и видите, что общий тренд направлен в другую сторону. Сигнал был настоящим. Но тренд во
Indicator Name: Fibaction – price action candle Detector Description: Fibo Signal Boxes is a powerful Smart Money Concept (SMC)-inspired indicator that auto-detects price action candles. bullish hammers and shooting stars, then draws precise Fibonacci entry zones and multiple take-profit levels directly on the chart. as for the SL personally i use 40 pips rules  Key Features: Detects bullish hammer and shooting star reversal candles. Automatically draws Fibonacci entry and TP boxes. as
Max Min Delta Indicator - Market Volume Imbalance Analysis Gain Deeper Insights into Market Volume Imbalance with Delta Analysis What is the Max Min Delta Indicator? The Max Min Delta Indicator is a powerful market volume analysis tool that visually represents maximum and minimum delta values using a histogram. It helps traders identify market strength, weakness, absorption, and aggressive buying/selling activity with precision. Key Features Histogram Visualization: Displays Max Delta (Green) an
Caicai L&S Yield Histogram Important Notice: This indicator is an integral tool of the automated EA Caicai Long and Short Pair Trading . This indicator visually displays the percentage deviation (Yield %) of a pair's current spread relative to its own historical mean. It is an excellent tool for quickly visualizing the gross financial potential of a market distortion in Long & Short operations. Main Features: Percentage Visualization: Understand the size of the distortion in palpable percentage
ONNYX INDICATOR — версия 1.14 Индикатор зон спроса и предложения для MetaTrader 5 без перерисовки подтвержденных сигналов. Он определяет подтвержденные ценовые экстремумы, строит зоны с шириной на основе ATR, оценивает качество зон в процентах и показывает стрелки BUY/SELL на закрытых свечах. ОСНОВНЫЕ ВОЗМОЖНОСТИ - Зоны спроса и предложения с процентной оценкой внутри зоны. - Увеличенные стрелки BUY/SELL после подтверждения закрытой свечи. - Фильтр тренда EMA и подтверждение отклонения цены. - П
BTC Trend Scalper MT5 Trend Capture Edition — Точный моментный трейдинг для BTCUSD Привет, трейдеры! Я — BTC Trend Scalper MT5, интеллектуальный советник для торговли Биткоином, созданный для захвата импульсных движений с дисциплинированным управлением рисками. Я   не   мартингейл. Я   не   сеточная система. Я   не   робот-игроман. Я — скальпер, следующий за трендом, созданный специально для трейдеров, которые понимают, что сохранение капитала важнее погони за каждым ценовым движением. Моя сп
PipFinite Trend PRO MT5
Karlo Wilson Vendiola
4.84 (562)
Стратегия пробоя для торговли по тренду, фильтрация и все необходимые функции, встроенные в один инструмент! Интеллектуальный алгоритм индикатора Trend Pro с точностью определяет тренд, отфильтровывает рыночный шум и генерирует входные сигналы и уровни выхода. Новые функции с расширенными правилами статистического расчета улучшают общую производительность этого индикатора. Важная информация Для максимального использования потенциала Trend Pro прочитайте полное описание www.mql5.com/en/blogs/p
EMA256 Fourier Cycle Trader EMA256 Fourier Cycle Trader is an advanced MetaTrader 5 Expert Advisor combining a long-term EMA or TEMA trend model, causal Fourier cycle analysis, configurable averaging and a unified basket take-profit system. The Expert Advisor is designed primarily for CENT accounts and for traders who understand basket recovery strategies, geometric lot progression and the risks associated with trading without a mandatory Stop Loss. RECOMMENDED STARTING CONFIGURATION Recommended
Bollinger Bands are a technical analysis tool that consists of a set of three lines plotted on a price chart. The middle line is a simple moving average, usually of 20 periods, and the upper and lower lines represent the standard deviation of the price from the moving average. The upper band is calculated by adding two standard deviations to the moving average, while the lower band is calculated by subtracting two standard deviations from the moving average. This creates a band around the moving
HAS RSI Signal — Профессиональный трендовый индикатор с расчетом SL/TP HAS RSI Signal — это мощный торговый инструмент, объединяющий проверенную классику и современные алгоритмы фильтрации шума. Индикатор анализирует рынок через призму сглаженных свечей Heiken Ashi и осциллятора RSI, предоставляя трейдеру четкие сигналы на вход в моменты разворота тренда или выхода из зон перекупленности/перепроданности. Основные преимущества: Двойная фильтрация: Использование Heiken Ashi Smoothed позволяет искл
Divergent Stochastic Filter II Catch Reversals Early, Filter Noise, Trade with Confidence The Edge: Why This Stochastic is Different  Every trader knows the Stochastic oscillator. But knowing when to trust its signals, that's the real challenge. The Divergent Stochastic Filter II transforms this classic indicator into a precision reversal detection system by adding critical elements: divergence intelligence, signal filtering and exhaustion detection.  While standard Stochastic oscillators fire s
A powerful oscillator that provide Buy and Sell signals by calculating the investor liquidity. The more liquidity the more buy possibilities. The less liquidity the more sell possibilities. Please download the demo and run a backtest! HOW IT WORKS: The oscillator will put buy and sell arrow on the chart in runtime only . Top value is 95 to 100 -> Investors are ready to buy and you should follow. Bottom value is 5 to 0 -> Investors are ready to sell and you should follow. Alert + sound will appe
# DRAWDOWN INDICATOR V4.0 - The Essential Tool to Master Your Trading ## Transform Your Trading with a Complete Real-Time Performance Overview In the demanding world of Forex and CFD trading, **knowing your real-time performance** isn't a luxury—it's an **absolute necessity**. The **Drawdown Indicator V4.0** is much more than a simple indicator: it's your **professional dashboard** that gives you a clear, precise, and instant view of your trading account status. --- ## Why This Indicator
GOLD FIBONACCI SNIPER M5 Описание GOLD FIBONACCI SNIPER M5 — это профессиональный индикатор для MetaTrader 5, специально разработанный для торговли XAUUSD (Gold) на таймфрейме M5. Индикатор использует уровни коррекции Fibonacci в сочетании с анализом тренда, волатильности, свечных моделей и силы движения рынка для поиска высокоточных точек входа. Система автоматически определяет зоны коррекции между уровнями Fibonacci 38.2, 50 и 61.8, которые считаются важными институциональными уровнями реакции
Visual CrossPulse Dynamics: Trade with the Market's True Rhythm Unlock a new level of market insight with Visual CrossPulse Dynamics, a sophisticated trading indicator designed to adapt to ever-changing volatility and reveal the true direction of the trend. Are you tired of indicators that lag in fast-moving markets or give false signals during consolidation? The Visual CrossPulse Dynamics indicator solves this problem by using an advanced, adaptive algorithm that intelligently adjusts to the m
"Impulses and Corrections 5" создан для того, чтобы помочь трейдерам ориентироваться в рыночной ситуации. Индикатор показывает мультитаймфреймовые восходящие и нисходящие импульсы ценовых движений. Эти импульсы служат основой для определения "Базы" , состоящей из зон "Коррекции" ценовых движений, а также имеет "Потенциальные" зоны для возможных сценариев движения цены. Восходящие и нисходящие импульсы определяются на основе модифицированной формулы индикатора "Фракталы" Билла Вильямса. Последни
MQL5 Market Listing: Bollinger Pro Bollinger Pro   is an advanced signal-based indicator designed to simplify market analysis by identifying high-probability entry points. Unlike standard Bollinger Band indicators that only show volatility channels, Bollinger Pro utilizes a proprietary algorithm to detect market conditions—whether the market is trending or sideways—and prints direct Buy/Sell signals on the chart. The indicator is designed for traders who seek a "clean chart" experience while mai
Dewa Scalper Feel Good EA Description Dewa Scalper Feel Good EA is an advanced automated trading solution engineered for consistent, stress-free capital growth. Built on precise multi-candle momentum patterns, this Expert Advisor captures high-probability market swings on the H1 timeframe while keeping risk strictly under control. It combines a smart switching entry model with a disciplined Break-Even Point (BEP) recovery algorithm and automated auto-compounding. Unlike conventional high-risk gr
C88 Projected Candle See the Bigger Picture Before the Candle Closes C88 Projected Candle is a professional market visualization indicator that projects the current higher timeframe candle directly onto your active chart. It helps traders understand the evolving market structure without constantly switching between timeframes. Whether you trade Price Action, ICT, Smart Money Concepts (SMC), or Volume Profile, this indicator provides a cleaner and more intuitive way to read market context. Key Fe
Smart Support And Resistance Indicator See the Market Levels That Matter. Make your chart clearer and your technical analysis more organized with Smart Support And Resistance Indicator — a powerful trading tool designed to help traders identify important support and resistance levels directly on their MetaTrader 5 charts. Whether you trade Forex, Gold, Indices, or other available markets, this indicator helps you focus on key price areas, monitor potential market reactions, and analyze price act
Short Description: SMC Smart Flow Pro is an advanced Smart Money Concept indicator that automatically detects Break of Structure (BOS), Change of Character (CHoCH), and projects precise TP/SL target levels on all timeframes — built for serious traders who trade with institutional flow. Full Description: SMC Smart Flow Pro is a premium Smart Money Concept (SMC) indicator for MetaTrader 5, engineered for traders who want to trade alongside institutional order flow. By automatically mapping m
NQX Range Edge Hook Weekly Bias — сигнальный индикатор для MetaTrader 5: сигналы крюка от границы диапазона (сигналы подаются только в направлении недельного смещения рынка). Собственная логика NQX, которая обнаруживает уход цены от границы её недавнего диапазона, подтверждённый свечой. Сигналы подаются только в направлении недельного смещения рынка. Индикатор отображает предлагаемую точку входа, короткий стоп и дальние цели (3:1, 5:1, 10:1, до 20:1 на свинге); решение принимаете вы. Что отображ
С этим продуктом покупают
Trend Sniper X
Sarvarbek Abduvoxobov
4.86 (44)
Trend Sniper X — это трендовый индикатор для MetaTrader 5, работающий на нескольких таймфреймах, который помогает трейдерам точно и ясно определять направление тренда и потенциальные точки разворота. для MT4: https://www.mql5.com/en/market/product/193245 Информация о цене: Текущая цена является промо-ценой и может измениться по мере выхода предстоящих обновлений и новых функций. Бонусное предложение: Чтобы получить БЕСПЛАТНЫЙ авто-трейд советник Assistant EA для этого индикатора, пожалуйста, на
Entry Points Pro показывает, где входить, где ставить стоп и каким лотом торговать — до того, как вы поставите ордер. ЦЕНА Сейчас 149 USD, и это последняя копия по этой цене. После неё цена вырастет до 199 USD, а финальная цена — 349 USD. Я зарабатываю торговлей на рынке и показываю это, поэтому мне не нужно продавать этот индикатор всем подряд. Это инструмент для трейдеров, которые думают своей головой, а не волшебная кнопка. Стрелка появляется на закрытии свечи и не перерисовывается. Две на
Gann Made Easy   - это профессиональная, но при этом очень простая в применении Форекс система, основанная на лучших принципах торговли по методам господина У.Д. Ганна. Индикатор дает точные BUY/SELL сигналы, включающие в себя уровни Stop Loss и Take Profit. ПОЖАЛУЙСТА, СВЯЖИТЕСЬ СО МНОЙ ПОСЛЕ ПОКУПКИ, ЧТОБЫ ПОЛУЧИТЬ ТОРГОВЫЕ ИНСТРУКЦИИ И ОТЛИЧНЫЕ ДОПОЛНИТЕЛЬНЫЕ ИНДИКАТОРЫ БЕСПЛАТНО! Вероятно вы уже не раз слышали о торговли по методам Ганна. Как правило теория Ганна отпугивает от себя не только
ULTRA - это технический индикатор, который который работает по принципу “Все включено” - самостоятельно анализирует рынок, дает торговые сигналы, показывает уровни для установки стоп лосс, а также подсказывает когда нужно закрывать сделки, чтобы получить профит или минимизировать убыток. То есть, не важно, что ты не умеешь анализировать рынок, определять уровни - где поставить SL или плохо совладаешь с мани-менеджментом. ULTRA все это сделает вместо тебя! БОНУС ДЛЯ ПОКУПАТЕЛЯ : После покупки ULT
Boba Analysis Suite
Trade Ready Solutions LLC
5 (2)
Boba Analysis Suite Boba Analysis Suite — аналитический индикатор для MetaTrader 5. Он объединяет структуру рынка, значимые ценовые зоны и общий рыночный контекст в одном представлении на графике. Индикатор разработан на основе практического опыта трейдера и наставника по трейдингу. Он помогает выстроить последовательный процесс анализа: оценивать направление рынка, определять важные уровни и рассматривать несколько таймфреймов в совокупности. Анализ с учётом контекста Значение отдельных сигнало
Следующее обновление — версия 2.52 уже скоро! [НОВОЕ] Приготовьтесь к 4 новым важным функциям, призванным улучшить ваш анализ рынка и торговый процесс. Мы выводим анализ рынка на новый уровень с помощью 4 новых функций, разработанных с учётом ваших потребностей в трейдинге. Представляем: 1. TRADE OVERVIEW DASHBOARD 2. CONFLUENCE AT ZONE 3. STRONG & WEAK HIGH/LOW 4. OTE 1. TRADE OVERVIEW DASHBOARD Панель, которая помогает легче понимать общую картину рынка, предоставляя рекомендации для поддержк
M1 SNIPER   — это простая в использовании торговая система. Это стрелочный индикатор, разработанный для тайм фрейма M1. Индикатор можно использовать как отдельную систему для скальпинга на тайм фрейме M1, а также как часть вашей существующей торговой системы. Хотя эта торговая система была разработана специально для торговли на M1, ее можно использовать и с другими тайм фреймами. Первоначально я разработал этот метод для торговли XAUUSD и BTCUSD. Но я считаю этот метод полезным и для торговли на
FiboSniper Pro – Multi-Filter Fibonacci System with Auto SL/TP and Control Panel FiboSniper Pro — это технический индикатор, который объединяет динамические Fibonacci Envelopes с несколькими фильтрами подтверждения для формирования отборных сигналов Buy и Sell. Уровни Fibonacci рассчитываются на основе Moving Average и ATR, а затем фильтруются с помощью ADX, EMA, RSI, ATR, Volume, Time и структуры свечи. Индикатор отображает на графике автоматические уровни Stop Loss и Take Profit на основе ATR,
Auto Optimized SpeedAngle — это система векторизации импульса институционального уровня, которая исключает подгонку под исторические данные (curve-fitting) за счет непрерывной форвард-оптимизации (Walk-Forward Optimization, WFO). Вместо того чтобы полагаться на статические входные параметры, которые теряют эффективность при смене рыночных режимов, индикатор динамически перекалибрует свои настройки, используя валидацию на вневыборочных данных (Out-of-Sample, OOS). Это гарантирует, что отображаемы
Adaptive Price Action Engine Купи индикатор — получи советник (EA) к нему бесплатно Самооптимизирующийся мульти-таймфреймовый анализ тренда и свечных моделей Рынок постоянно меняется — и не каждая модель Price Action имеет одинаковую ценность в разных рыночных режимах. Adaptive Price Action Engine создан для адаптации к изменяющимся рыночным условиям, объединяя трендовую структуру, мульти-таймфреймовый анализ, свечные модели и статистическую оптимизацию в единой аналитической системе. Два адапти
Crystal Heikin Ashi Signals—Professional Trend & Signal Detection Indicator Advanced Heikin Ashi Visualization with Intelligent Signal System for Manual & Automated Trading Final Price: $149 ---------> Price goes up $10 after every 10 sales . Limited slots available — act fast . Overview User Guide PDF Crystal Heikin Ashi Signals is a professional-grade MetaTrader 5 indicator that combines pure Heikin Ashi candle visualization with an advanced momentum-shift detection system. Designed for both m
Scalper Vault — это мощная, полноценная торговая система, созданная для трейдеров, которые стремятся к стабильным результатам в внутридневной торговле. Этот высокоточный индикатор представляет собой комплексное, самостоятельное торговое решение, обеспечивающее аналитику профессионального (институционального) уровня как для торговли на рынке Forex, так и для работы с бинарными опционами. Пожалуйста, свяжитесь со мной после покупки, чтобы получить мои торговые советы, а также отличный бонус! Исклю
SIO Oscillator: самооптимизирующийся осциллятор дисбаланса семивариаций Купите индикатор и получите советник (EA) на его основе БЕСПЛАТНО. Большинство осцилляторов воспринимают любое движение цены одинаково. SIO разделяет давление покупателей и продавцов и измеряет дисбаланс между ними, показывая, какая сторона действительно контролирует рынок. Когда дисбаланс достигает экстремума, SIO выдаёт чёткий сигнал с уровнями входа, Stop Loss и Take Profit. Главное отличие SIO в том, что он не полагается
Volatility Master for MetaTrader is a real-time dashboard tool that scans up to  50 symbols  to identify high-volatility , trending markets instantly. With bullish/bearish signals, customizable alerts, and a user-friendly interface, it helps you avoid range-bound conditions and focus on high-probability trades. Clarity leads to confidence. Trade confidently and protect your capital effectively with this powerful dashboard. We don't offer free or bonus indicators in exchange of reviews from you.
Мультивалютный индикатор силы и импульса MT5 Dynamic Forex28 Navigator — это развитие наших давних популярных индикаторов, объединяющее силу трёх в одном: Advanced Currency Strength28 Indicator (700 отзывов) Advanced Currency IMPULSE with ALERT (530 отзывов) CS28 Combo Signals (недавний бонус) Оба индикатора-предшественника вместе получили более 1,200 отзывов на MQL5 Market и с 2016 года являются неотъемлемой частью сообщества MT4. Dynamic Forex28 Navigator MT5 переносит ту же проверенную логику
AriFocus - Non-Repainting Buy/Sell Signals AriFocus - one clear signal. AriFocus marks buy and sell signals directly on the chart and suggests a stop-loss level for each one. Every signal is confirmed on bar close and never repaints. - Buy/sell arrows, confirmed on bar close - Suggested stop-loss level for every signal - Trend band and candle coloring to show direction at a glance - 10 ready-made presets, or your own settings (14 calculation methods) - Pop-up, push and email alerts with entr
Neuro Poseidon - новый индикатор от Дарьи Резуевой. Он сочетает точные торговые сигналы с адаптивными уровнями TP/SL , в результате создавая максимально выгодные сделки! TO SWITCH TO   ENG   PLEASE CHOOSE IT IN THE UPPER-RIGHT CORNER OF THE WEBSITE Напишите мне и получите  Neuro Poseidon Assistant  в подарок для автоматизации вашей торговли! Что отличает его от других индикаторов? 1. Доказанная прибыльность на всех активах и таймфреймах 2. На графике присутствуют только подтвержденные сигналы н
Свинг-трейдинг - это первый индикатор, предназначенный для обнаружения колебаний в направлении тренда и возможных разворотов. Он использует базовый подход свинговой торговли, широко описанный в торговой литературе. Индикатор изучает несколько векторов цен и времени для отслеживания направления совокупного тренда и выявляет ситуации, когда рынок перепродан или перекуплен и готов к исправлению. [ Руководство по установке | Руководство по обновлению | Устранение неполадок | FAQ | Все продукты ] П
Azimuth Pro
Ottaviano De Cicco
5 (7)
Azimuth Pro V2: Синтетический фрактальный структурный анализ и подтверждённые входы для MT5 Обзор Azimuth Pro — многоуровневый индикатор свинговой структуры от Merkava Labs . Четыре вложенных уровня свингов, привязанный к свингам VWAP, определение ABC-паттернов, трёхтаймфреймная структурная фильтрация и подтверждённые входы на закрытой свече — один график, один рабочий процесс от микро-свингов до макро-циклов. Это не слепой сигнальный продукт. Это рабочий процесс, основанный на структуре, для т
SkyHammer Signal Pro Профессиональный трендовый индикатор без перерисовки с фиксированными уровнями Entry, SL и TP SkyHammer Signal Pro — это структурированный индикатор тренда и momentum, созданный для трейдеров, которым нужны четкие, зафиксированные и проверяемые торговые сигналы. Лучше всего он работает на младших таймфреймах, таких как M1 и M5 . Индикатор не пытается предсказывать вершины или основания рынка. Вместо этого он ожидает подтвержденную рыночную структуру, направление тренда, силу
Advance AI Scanner is a multi-symbol analysis indicator for MetaTrader 5. It scans Forex pairs, metals, energy, stock indices and cryptocurrencies at the same time and rates each instrument with its own self-training model. It explains in plain English what moved each market and why, and it estimates how far upcoming economic news usually moves each symbol, measured on your broker's own price history. $199 instead of $499. 10 copies left at this price. One time purchase  Installation and User
DayTrader PRO DayTrader PRO — это передовой торговый индикатор, сочетающий фильтр Лагерра (Laguerre Filter) Джона Элерса с мощным движком автоматической оптимизации. Вместо использования фиксированных параметров индикатор автоматически подбирает оптимальные настройки на основе недавних рыночных условий, что позволяет адаптироваться к изменяющейся волатильности без необходимости ручной корректировки. Индикатор генерирует четкие сигналы на ПОКУПКУ и ПРОДАЖУ, а также адаптивные уровни Stop Loss и T
Bill Williams Advanced предназначен для автоматического анализа графика по системе " Profitunity " Билла Уильямса. Индикатор анализирует сразу четыре таймфрейма. Инструкция/Мануал ( Обязательно читайте перед приобретением ) Преимущества 1. Анализирует график по системе "Profitunity" Билла Уильямса. Сигналы помещает в таблицу в углу экрана и на график цены. 2. Находит все известные сигналы АО и АС, а также сигналы зон. Оснащён трендовым фильтром по Аллигатору. 3. Находит "Дивергентный бар", а та
Apex Patterns PRO Купите индикатор — получите Expert Advisor на его основе БЕСПЛАТНО. Самооптимизирующаяся система анализа графических паттернов и пробоев Традиционные сканеры паттернов полагаются на фиксированные входные параметры, что часто приводит к снижению их эффективности при изменении рыночной волатильности и структуры. Apex Patterns PRO разработан для адаптации к меняющимся рыночным условиям, объединяя распознавание структурных графических паттернов, фильтрацию по моментуму и статистич
Power Candles V3 — самооптимизирующийся индикатор силы Power Candles V3 преобразует силу валюты и инструмента в готовый к использованию торговый план на каждом графике, к которому он прикреплен. Вместо того, чтобы просто раскрашивать свечи, он выполняет автоматическую оптимизацию в режиме реального времени в фоновом режиме и предоставляет вам оптимальные значения Stop Loss, Take Profit и порог сигнала для выбранного вами символа. Один клик — и все готово для реальной торговли: на графике появляю
Apollo SR Master — это индикатор уровней поддержки/сопротивления со специальными функциями, которые упрощают и повышают надежность торговли с использованием зон поддержки/сопротивления. Индикатор рассчитывает зоны поддержки/сопротивления в режиме реального времени без задержек, выявляя локальные максимумы и минимумы цены. Затем, для подтверждения сформированной зоны поддержки/сопротивления, индикатор выдаёт специальный сигнал, который сигнализирует о том, что зону поддержки/сопротивления можно у
Каждый покупатель этого индикатора получает дополнительно Бесплатно: Авторскую утилиту "Bomber Utility", которая автоматически сопровождает каждю торговую операцию, устанавливает уровни Стоп Лосс и Тейк профит и закрывает сделки согласно правилам этой стратегии, Сет-файлы для настройки этого индикатора на различных активах, Сет-файлы для настройки Bomber Utility в режимы: "Минимум Риска", "Взвешенный Риск" и "Стратегия Выжидания", Пошаговый видео-мануал, который поможет вам быстро установить, н
Superhero
Ihor Otkydach
5 (3)
SUPERHERO индикатор - это мультивалютная торговая система, которая создана по принципу "Все включено". Индикатор самостоятельно анализирует рынок и дает сигналы когда открывать и когда закрывать сделки. Используются ордера Стоп Лосс и Тейк профит. Соотношение R:R = 1:1 Эта система может присылать на смартфон PUSH-уведомления, так что вы сможете делать сделки "на ходу" без привязки к ПК. Отлично подходит для Проп Фирм трейдинга. БОНУС ДЛЯ КАЖДОГО ПОКУПАТЕЛЯ: Каждый покупатель этого индикатора пол
TREND LINES PRO   помогает понять, где рынок действительно меняет направление. Индикатор показывает реальные развороты тренда и места, где крупные участники входят повторно. Вы видите   BOS-линии   смены тренда и ключевые уровни старших таймфреймов — без сложных настроек и лишнего шума. Сигналы не перерисовываются и остаются на графике после закрытия бара. VERSION MT 4     -     Раскрывает свой максимальный потенциал в связке с индикатором  RFI LEVELS PRO Что показывает индикатор: Реальные смен
Murrey Math Classic
Sarvarbek Abduvoxobov
5 (2)
Murrey Math Classic Murrey Math Classic — это профессиональный и динамичный торговый индикатор, разработанный для прогнозирования движения цен на финансовых рынках с математической точностью. Система модернизирует легендарную геометрию цены и времени, превращая ее в высокоструктурированную математическую модель, адаптированную для современных финансовых рынков. Основная логика математики Мюррея заключается в том, что финансовые рынки движутся не хаотично, а подчиняются определенному ритму. Подоб
Фильтр:
Нет отзывов
Ответ на отзыв