Market Structure Viewer

  • Göstergeler
  • Adari Manohar
    Adari Manohar
    Forex trader and MQL5 developer focused on market structure, Smart Money Concepts, multi-timeframe analysis and automated trading systems. I build practical MetaTrader 5 tools that convert complex market analysis into structured visual and algorithmic workflows. My work includes market structure
  • Sürüm: 1.30
  • Güncellendi: 26 Eylül 2026
  • Etkinleştirmeler: 5
MARKET STRUCTURE VIEWER FOR MT5

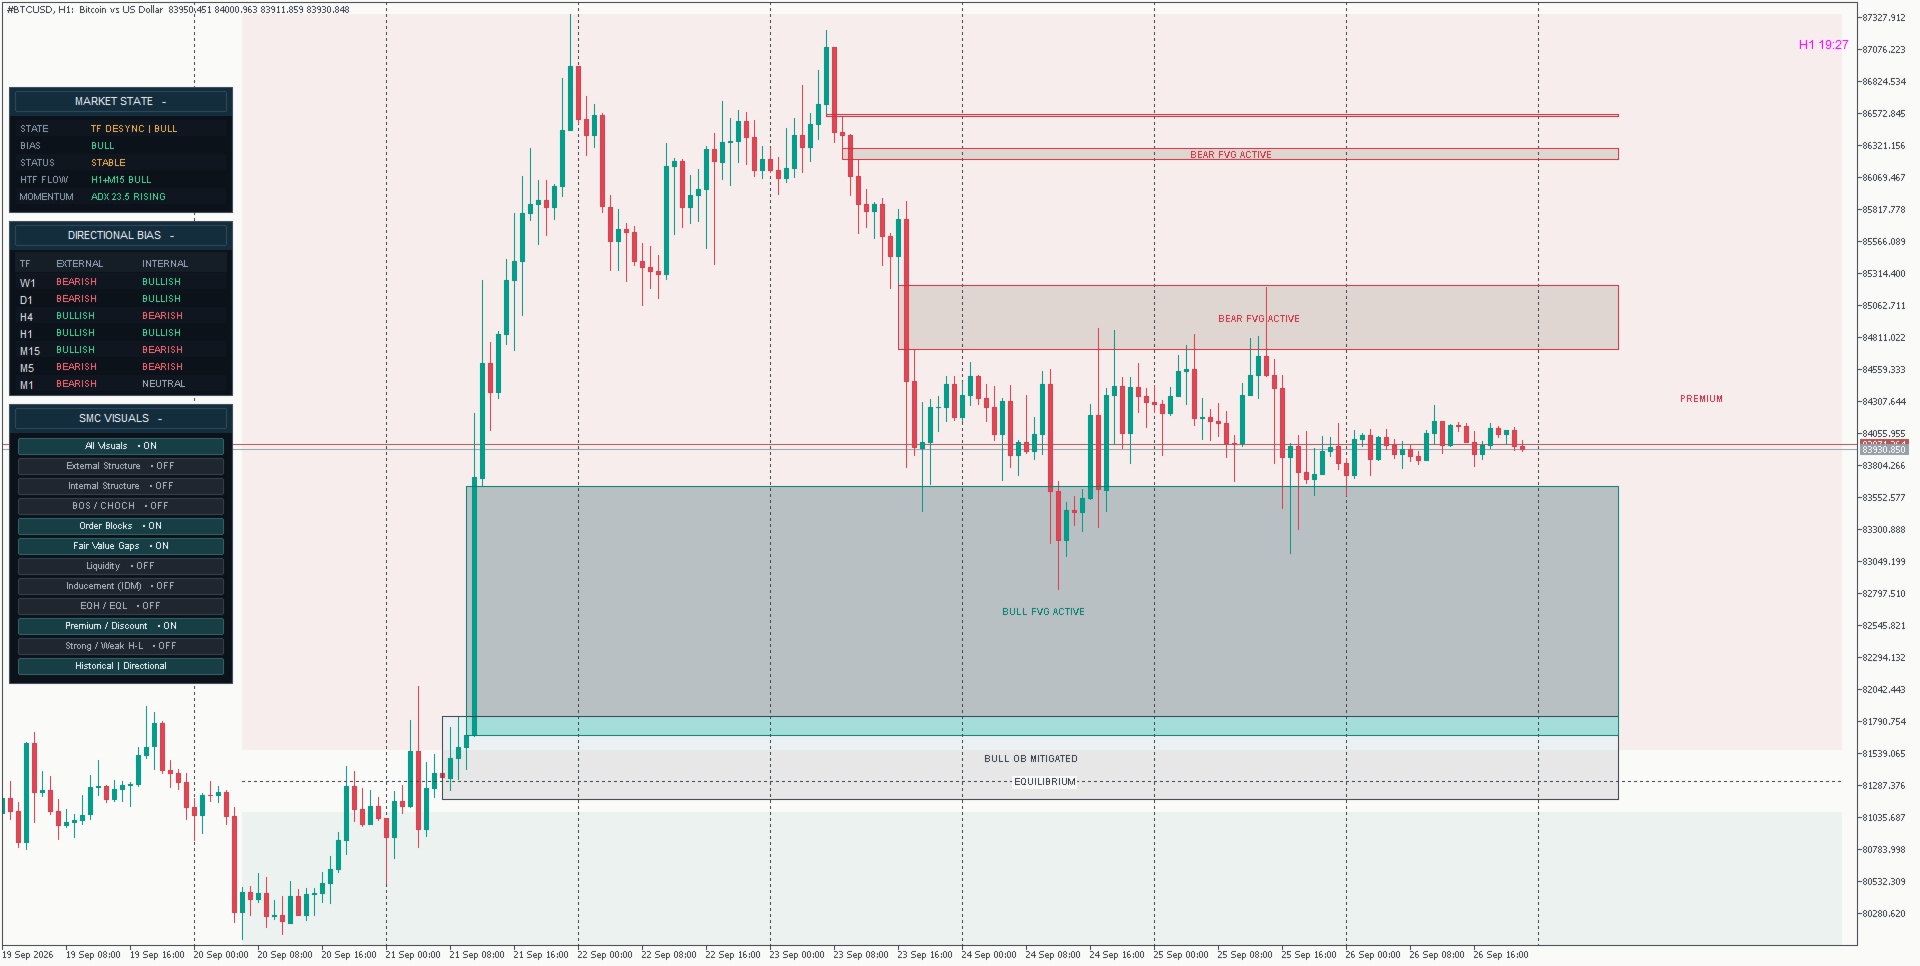
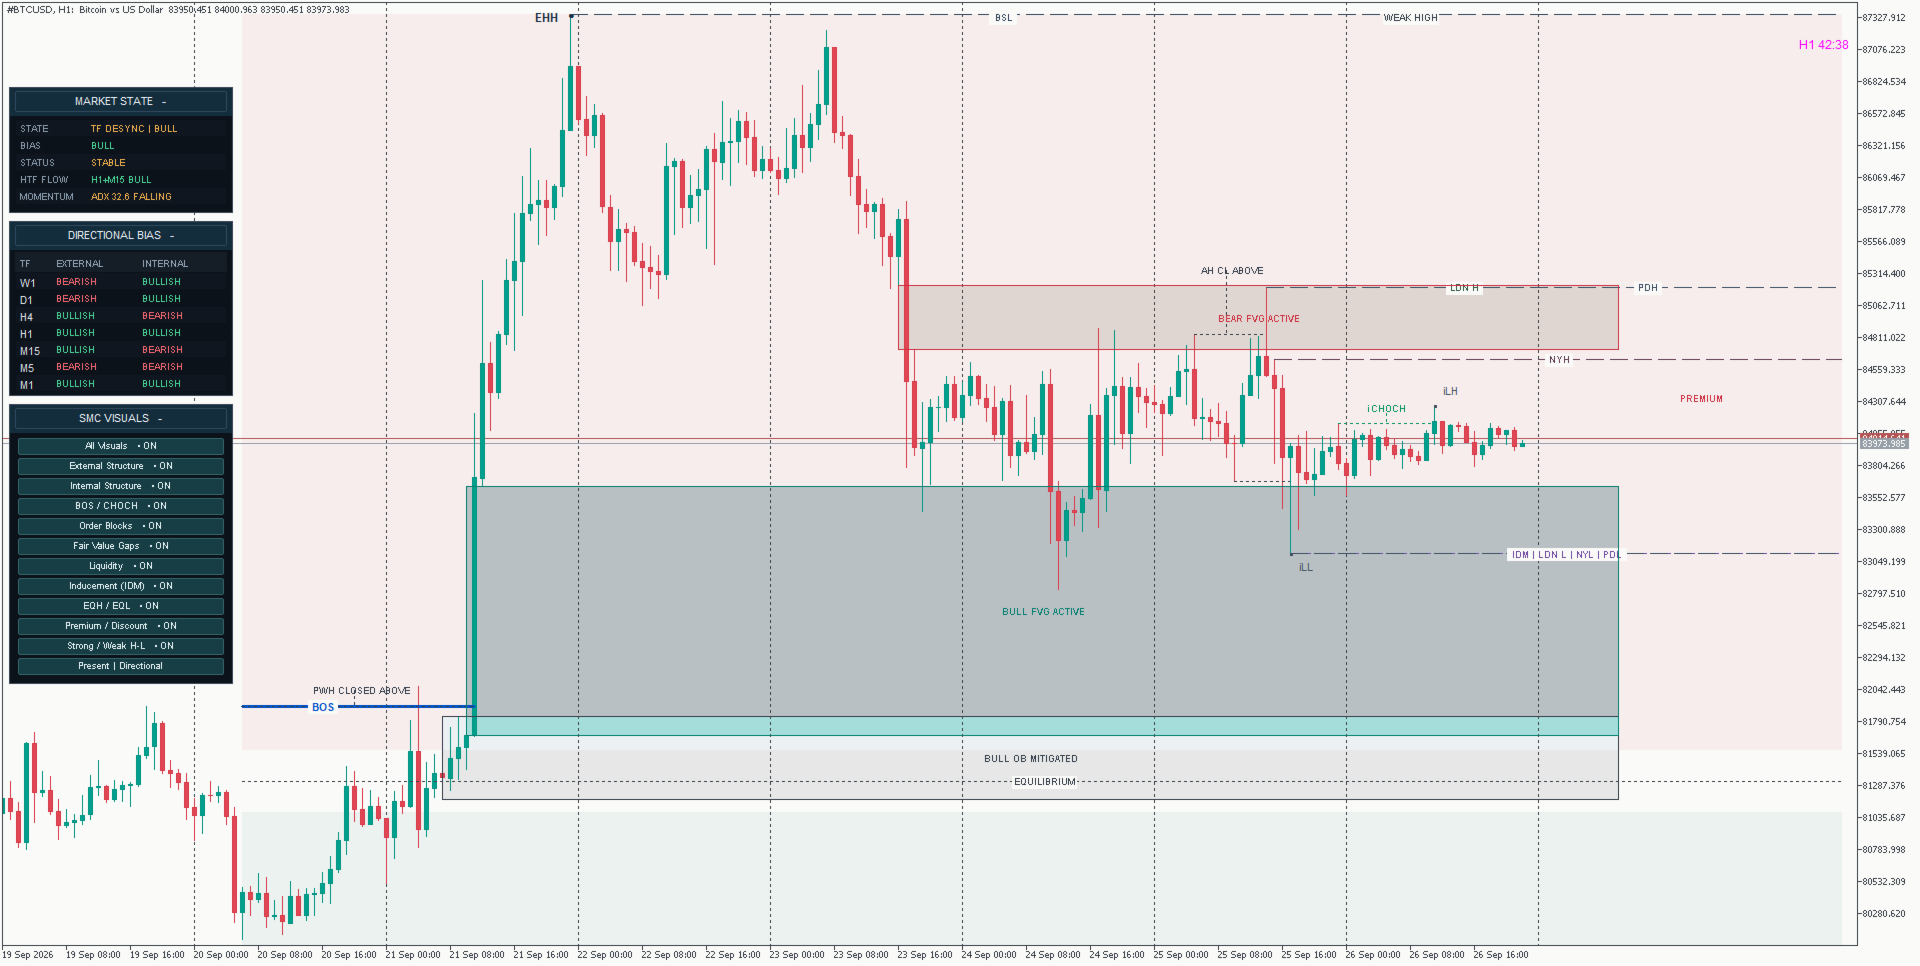
Market Structure Viewer is a multi-timeframe Smart Money Concepts (SMC) analysis workspace for MetaTrader 5.

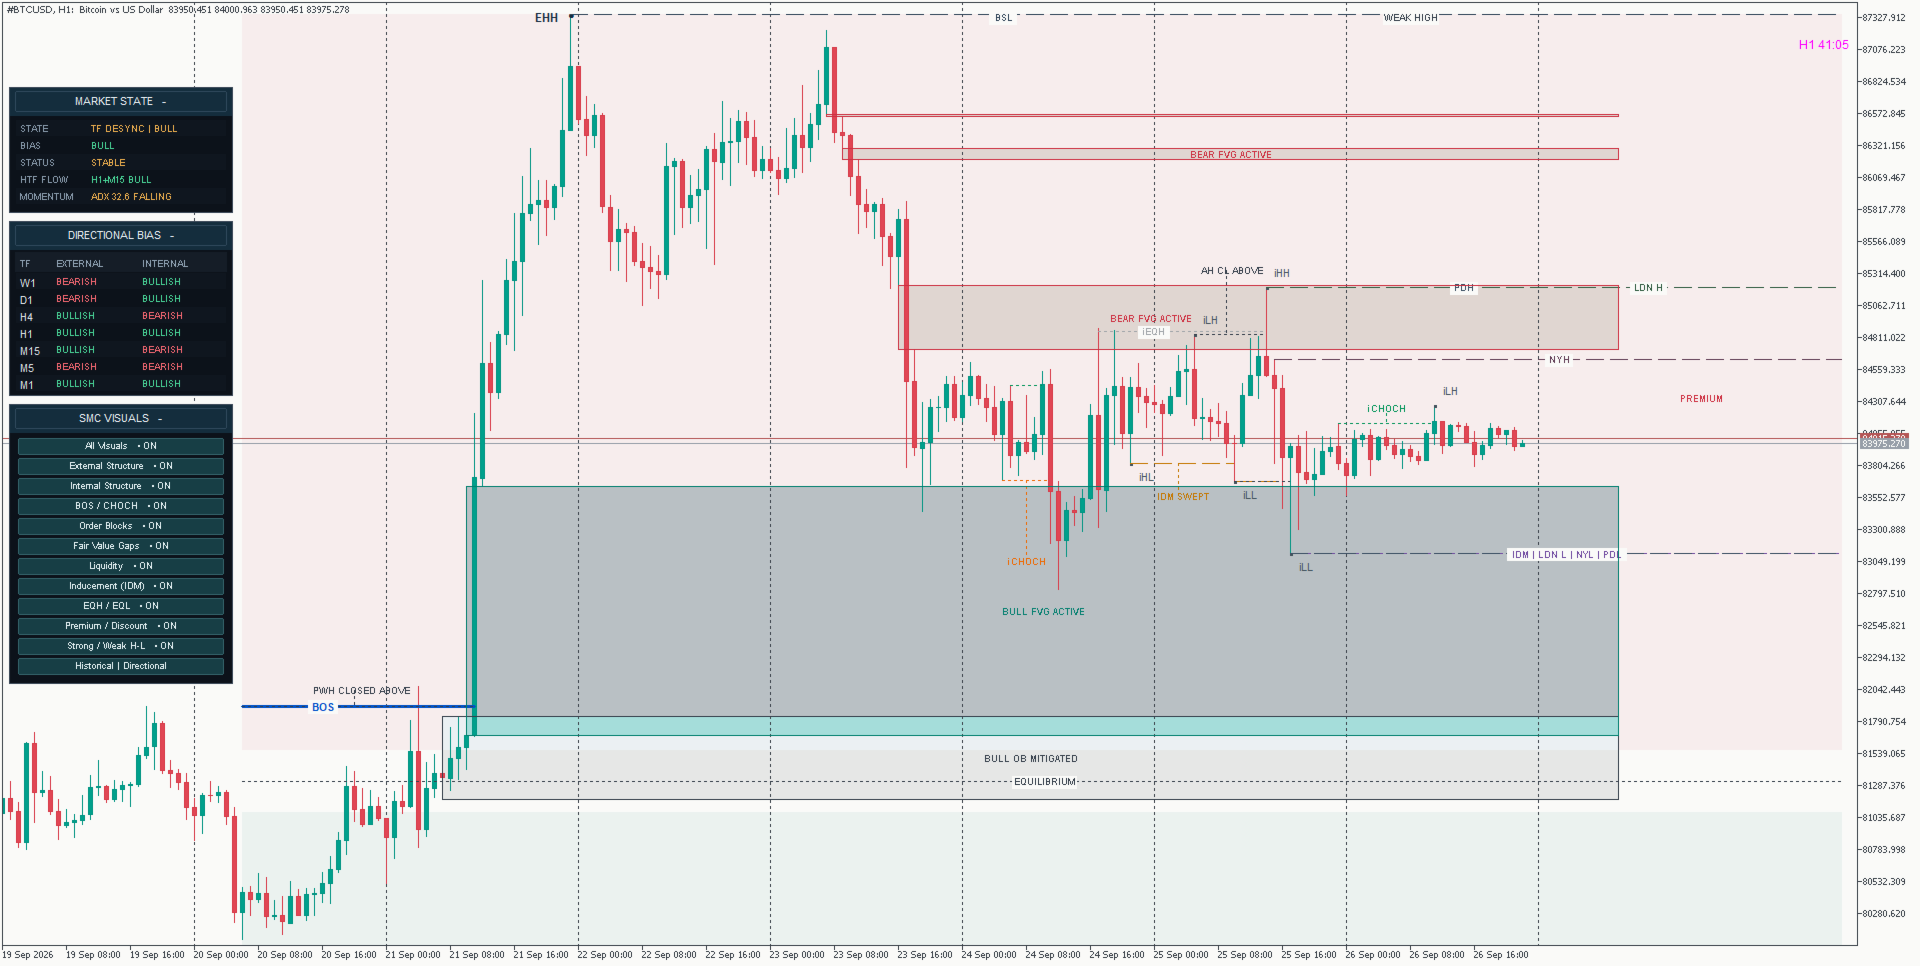
Instead of displaying BOS, CHOCH, Order Blocks, Fair Value Gaps or liquidity as isolated chart elements, the indicator combines external and internal market structure, multi-timeframe directional bias, market-state context, liquidity, price zones and momentum into one structured workflow.

The objective is to help discretionary traders understand not only what structural event has occurred, but also where that event sits inside the broader market context.

Market Structure Viewer is an analysis and visualization tool only. It does not automatically open, modify or close trades.


## WHY MARKET STRUCTURE VIEWER IS DIFFERENT

Many SMC indicators focus mainly on drawing individual concepts such as BOS, CHOCH, Order Blocks and Fair Value Gaps.

Market Structure Viewer is designed around the relationship between those concepts.

For example, a bullish M1 BOS has a very different context when M15 and H1 are also bullish compared with the same M1 BOS appearing against bearish higher-timeframe structure.

The viewer therefore combines:

- Market structure
- Multi-timeframe directional bias
- Market state
- Liquidity
- Inducement
- Order Blocks
- Fair Value Gaps
- Premium / Discount positioning
- Higher-timeframe flow
- Momentum context

This provides a more complete view of the current market environment without requiring the trader to constantly switch between multiple charts.


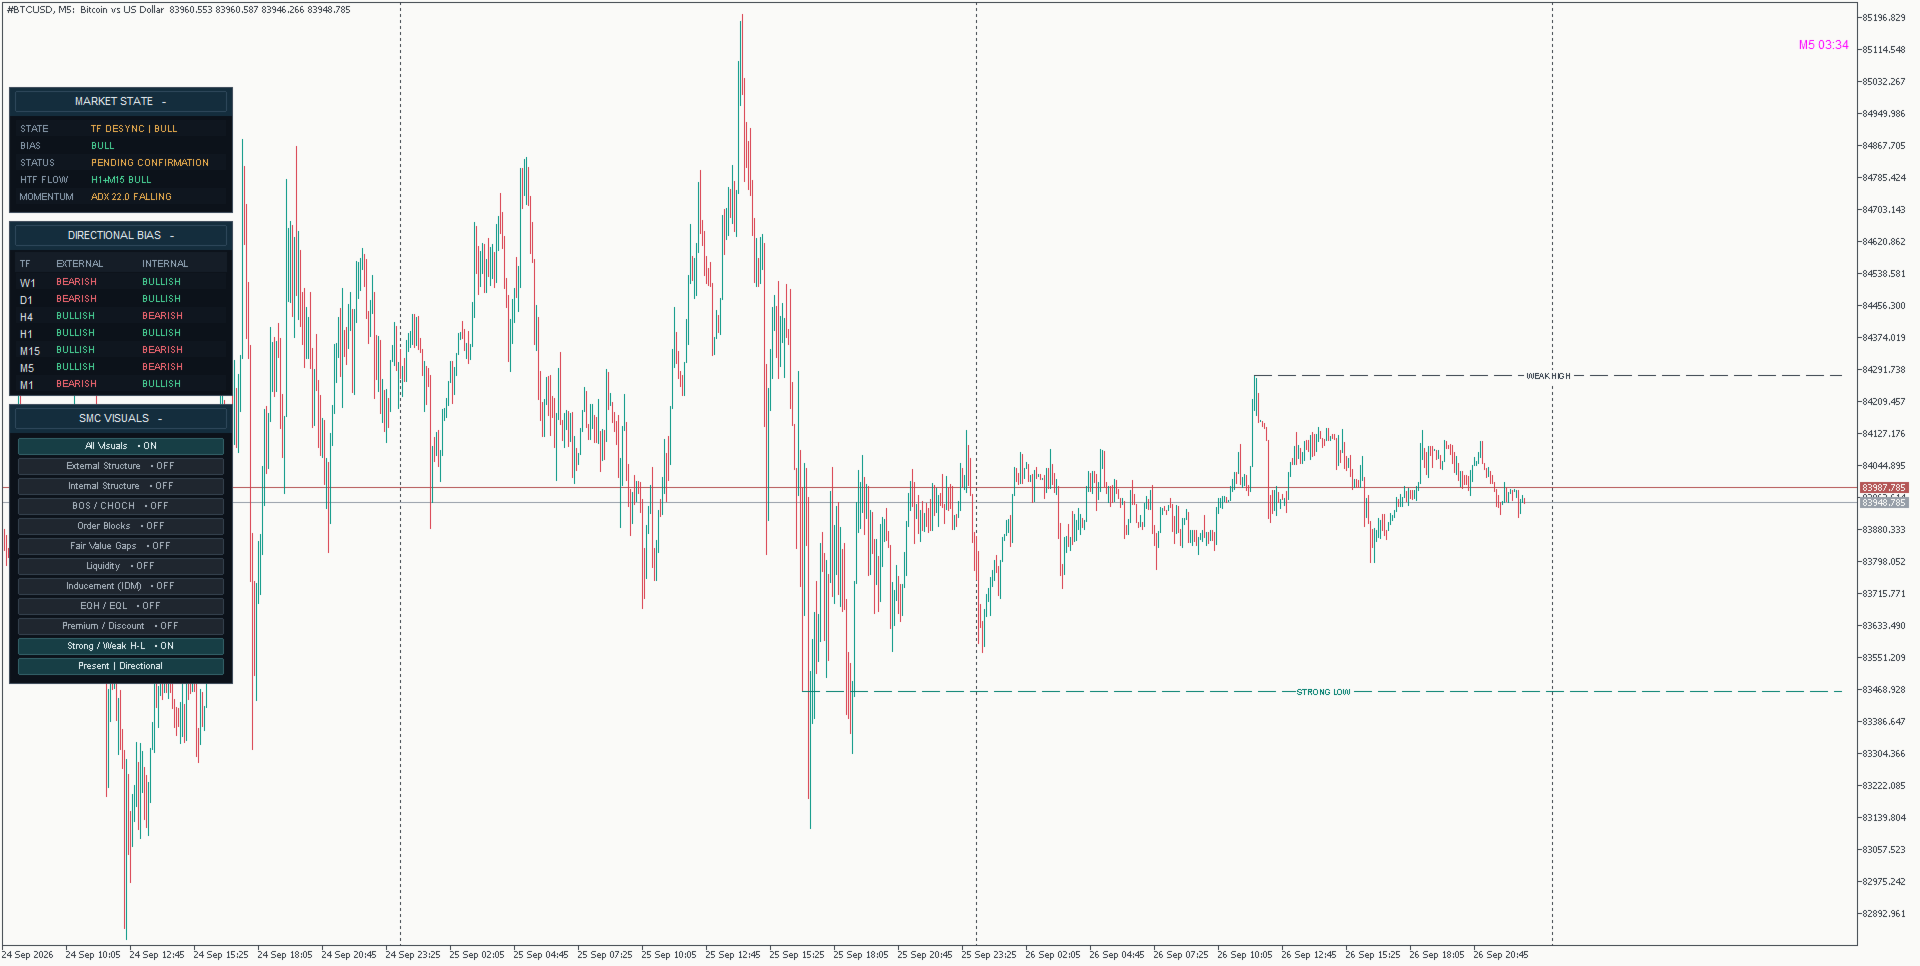
## MULTI-TIMEFRAME DIRECTIONAL BIAS

The Directional Bias panel monitors both External and Internal market structure across:

- W1
- D1
- H4
- H1
- M15
- M5
- M1

External structure represents the broader directional structure of each timeframe, while internal structure shows the more recent movement developing inside that larger structure.

This makes it easier to identify:

- Higher-timeframe alignment
- Lower-timeframe pullbacks
- Counter-directional movement
- Possible structural transitions
- External and internal disagreement

A lower-timeframe bullish move does not automatically mean that the higher-timeframe structure has turned bullish.

The panel helps keep both layers visible at the same time.


## MARKET STATE PANEL

The Market State panel provides a compact summary of the current market environment.

Depending on current conditions, the viewer can classify the market into states such as:

- Strong Bull Trend
- Healthy Bull Trend
- Strong Bear Trend
- Healthy Bear Trend
- Early Expansion
- Decaying Chop
- Compression / Range
- Timeframe Desynchronization

The panel also displays:

BIAS
Current directional tendency.

STATUS
Current classification, trend condition or transition status.

HTF FLOW
Relationship between H1 and M15 structural direction.

MOMENTUM
M5 ADX value together with rising, falling or relatively flat momentum behaviour.

The Market State panel is designed as a context layer, not as an automatic entry signal.

The classification engine uses confirmation and transition logic to avoid treating every short-term change as a complete market-state reversal.


## EXTERNAL AND INTERNAL MARKET STRUCTURE

Market Structure Viewer separates broader external structure from faster internal structure.

This helps distinguish between:

- Structural continuation
- Internal corrections
- Pullbacks
- Potential directional transitions

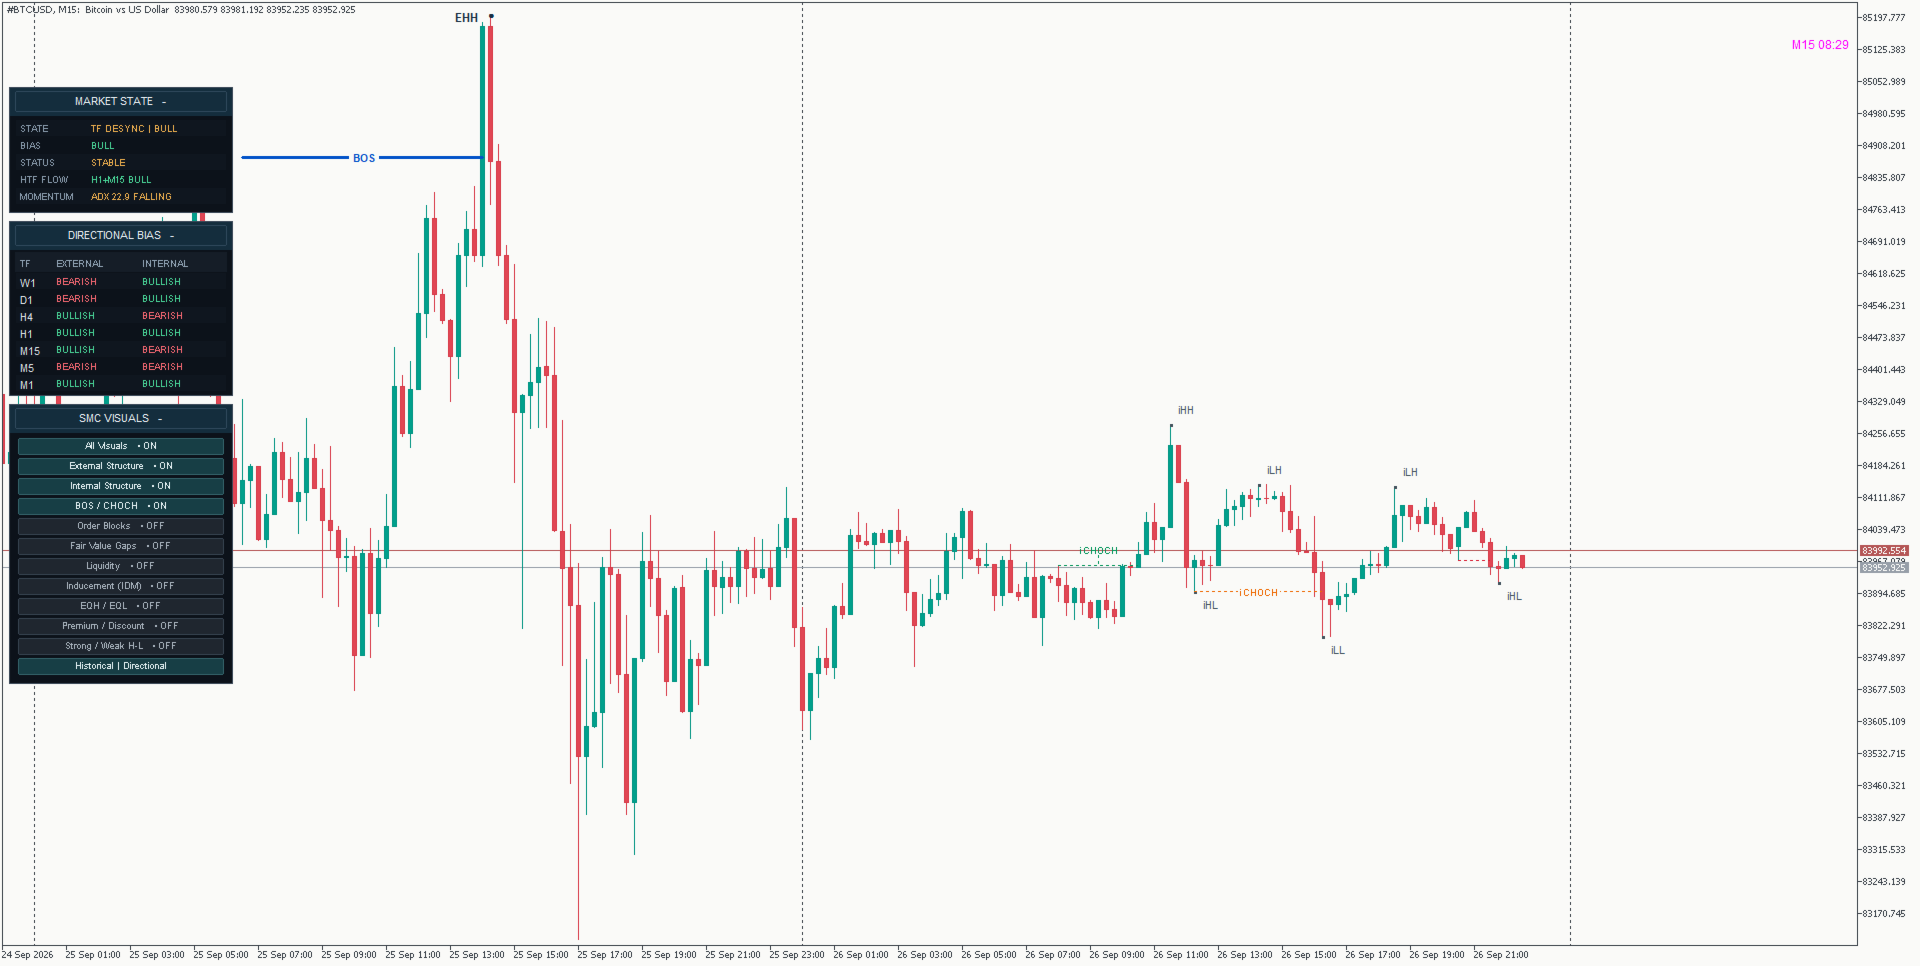
The indicator displays:

- External structural highs and lows
- Internal structural highs and lows
- Bullish and bearish BOS
- Bullish and bearish CHOCH
- Internal BOS
- Internal CHOCH

A lower-timeframe CHOCH can therefore be viewed inside its higher-timeframe context instead of automatically being treated as a complete trend reversal.


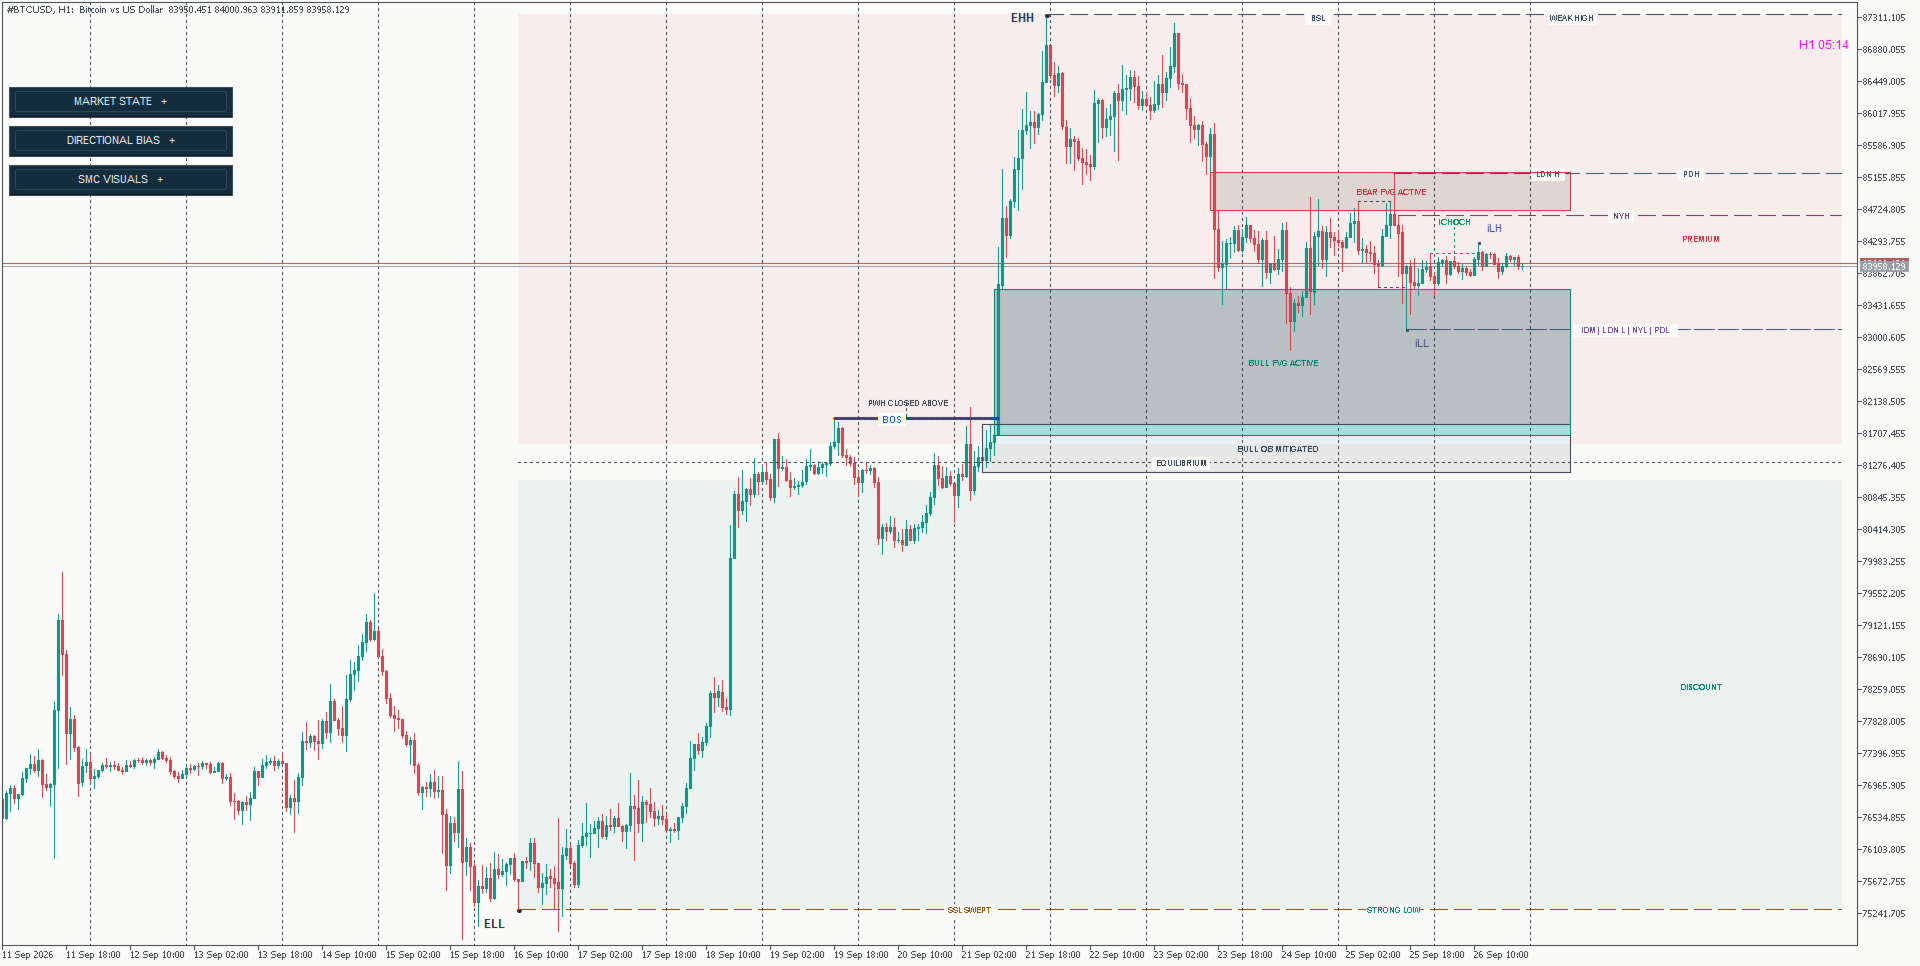
## BOS AND CHOCH

Break of Structure (BOS) is used to identify confirmed continuation through an important structural level.

Change of Character (CHOCH) highlights a structural break that conflicts with the previous directional state and may indicate a transition.

External and internal structural events are tracked separately so that smaller internal changes do not automatically replace the broader structural view.

The structure engine is designed around confirmed price structure rather than unfinished intrabar movement.


## ORDER BLOCKS

The indicator identifies bullish and bearish Order Block areas associated with relevant price movement and structural context.

Instead of treating every opposite candle as an Order Block, the viewer focuses on zones connected with meaningful displacement and structure.

Order Blocks can be evaluated together with:

- Market direction
- Liquidity
- Fair Value Gaps
- Premium / Discount positioning
- Higher-timeframe bias

This helps the trader view each zone as part of the broader market structure rather than as an isolated signal.

Order Block states may update as price interacts with, mitigates or invalidates previously identified zones.


## FAIR VALUE GAPS

Market Structure Viewer detects bullish and bearish Fair Value Gaps created during directional displacement.

Fair Value Gaps can be used as potential areas of interest during retracements or continuation scenarios.

The value of an FVG depends on its context.

For example, a bullish Fair Value Gap located below current price during bullish structure has a different meaning from the same type of gap appearing against bearish higher-timeframe structure.

The viewer allows Fair Value Gaps to be analysed together with structural direction, liquidity and active price zones.

FVG states can update as price interacts with or fills previously identified gaps.


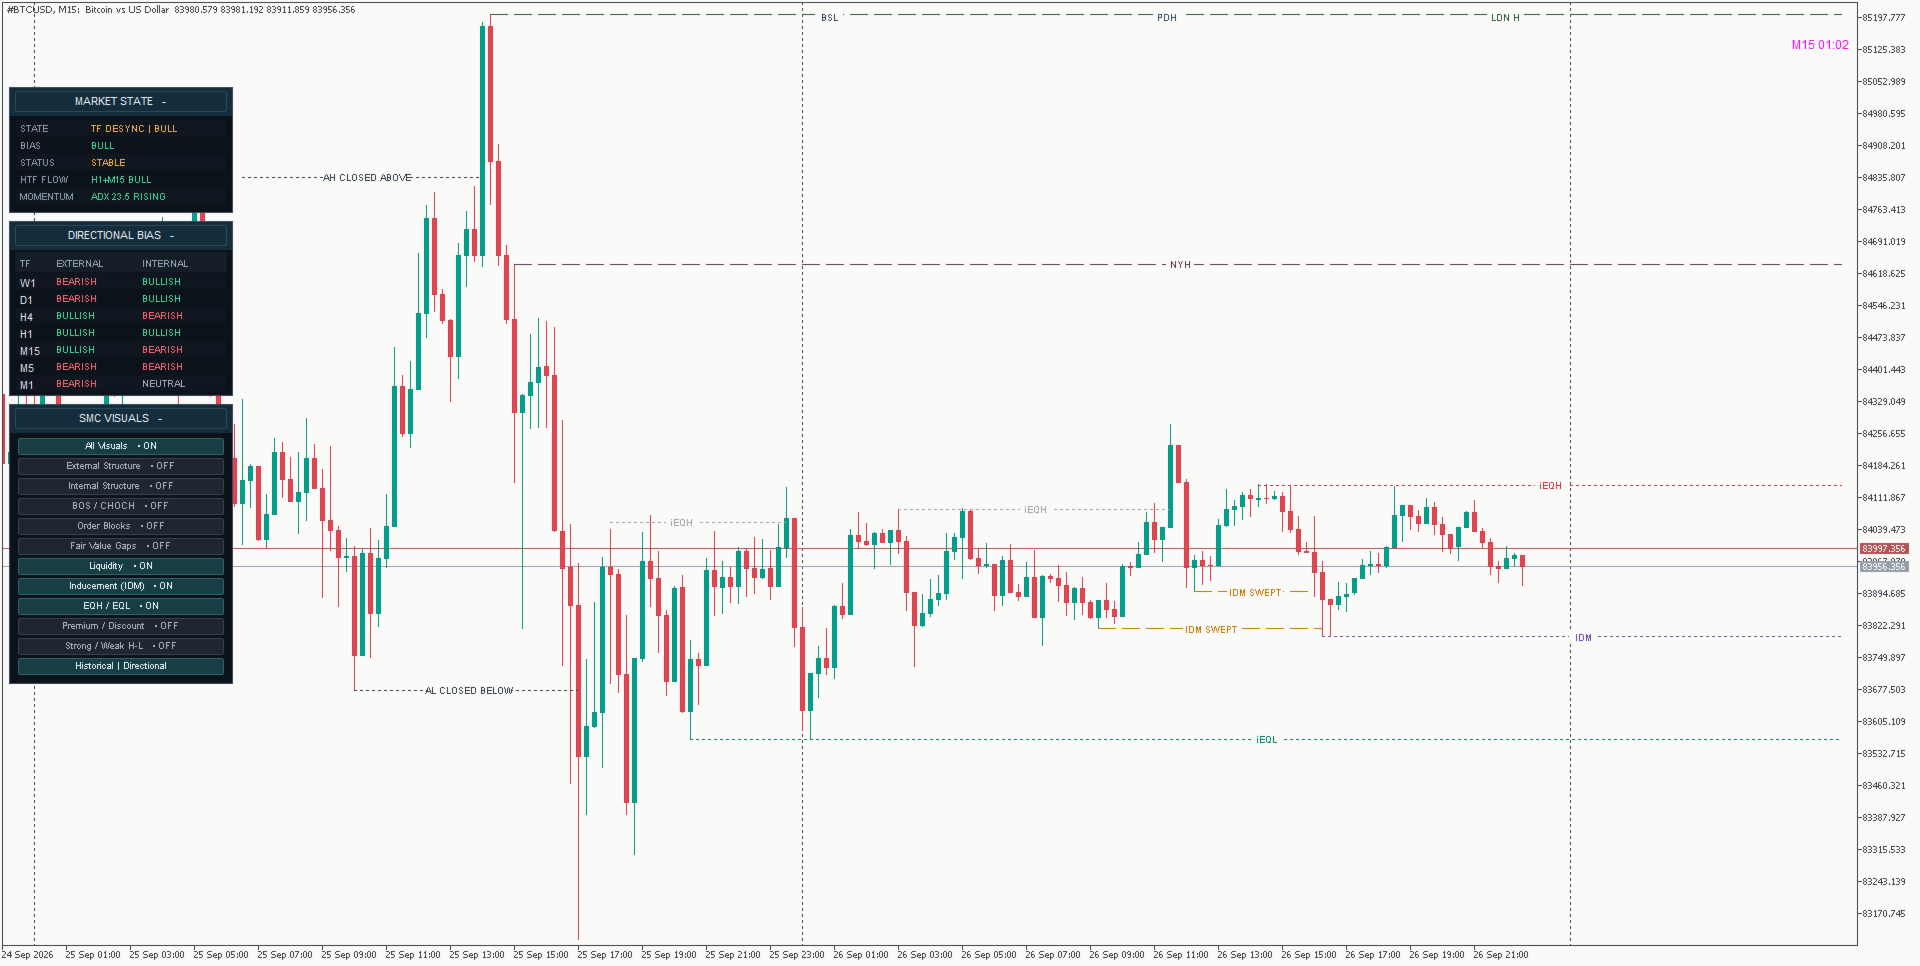
## LIQUIDITY MAPPING

The indicator highlights relevant liquidity levels and tracks how price interacts with them.

Liquidity references can include important structural highs and lows and other significant price levels.

The viewer can distinguish between active liquidity and levels that have already been interacted with.

Liquidity levels can also change state after being:

- Swept
- Broken
- Closed through

This helps prevent previously consumed liquidity from being interpreted in the same way as untouched liquidity.


## INDUCEMENT (IDM)

Inducement levels represent smaller internal structural references that may be targeted before price reaches a larger external objective.

IDM can provide additional context when analysing:

- Pullbacks
- Liquidity sweeps
- Internal structure
- External targets
- Order Blocks
- Fair Value Gaps

The indicator displays inducement separately from broader liquidity so that the trader can distinguish between different structural objectives.


## EQUAL HIGHS AND EQUAL LOWS

Equal Highs (EQH) and Equal Lows (EQL) identify areas where multiple swing points form around similar price levels.

These areas may represent concentrated liquidity.

The viewer marks these levels directly on the chart so they can be analysed together with:

- BOS / CHOCH
- External structure
- Internal structure
- Liquidity
- Order Blocks
- Fair Value Gaps

Previously formed equal levels can also reflect lifecycle changes after price sweeps or closes through them.


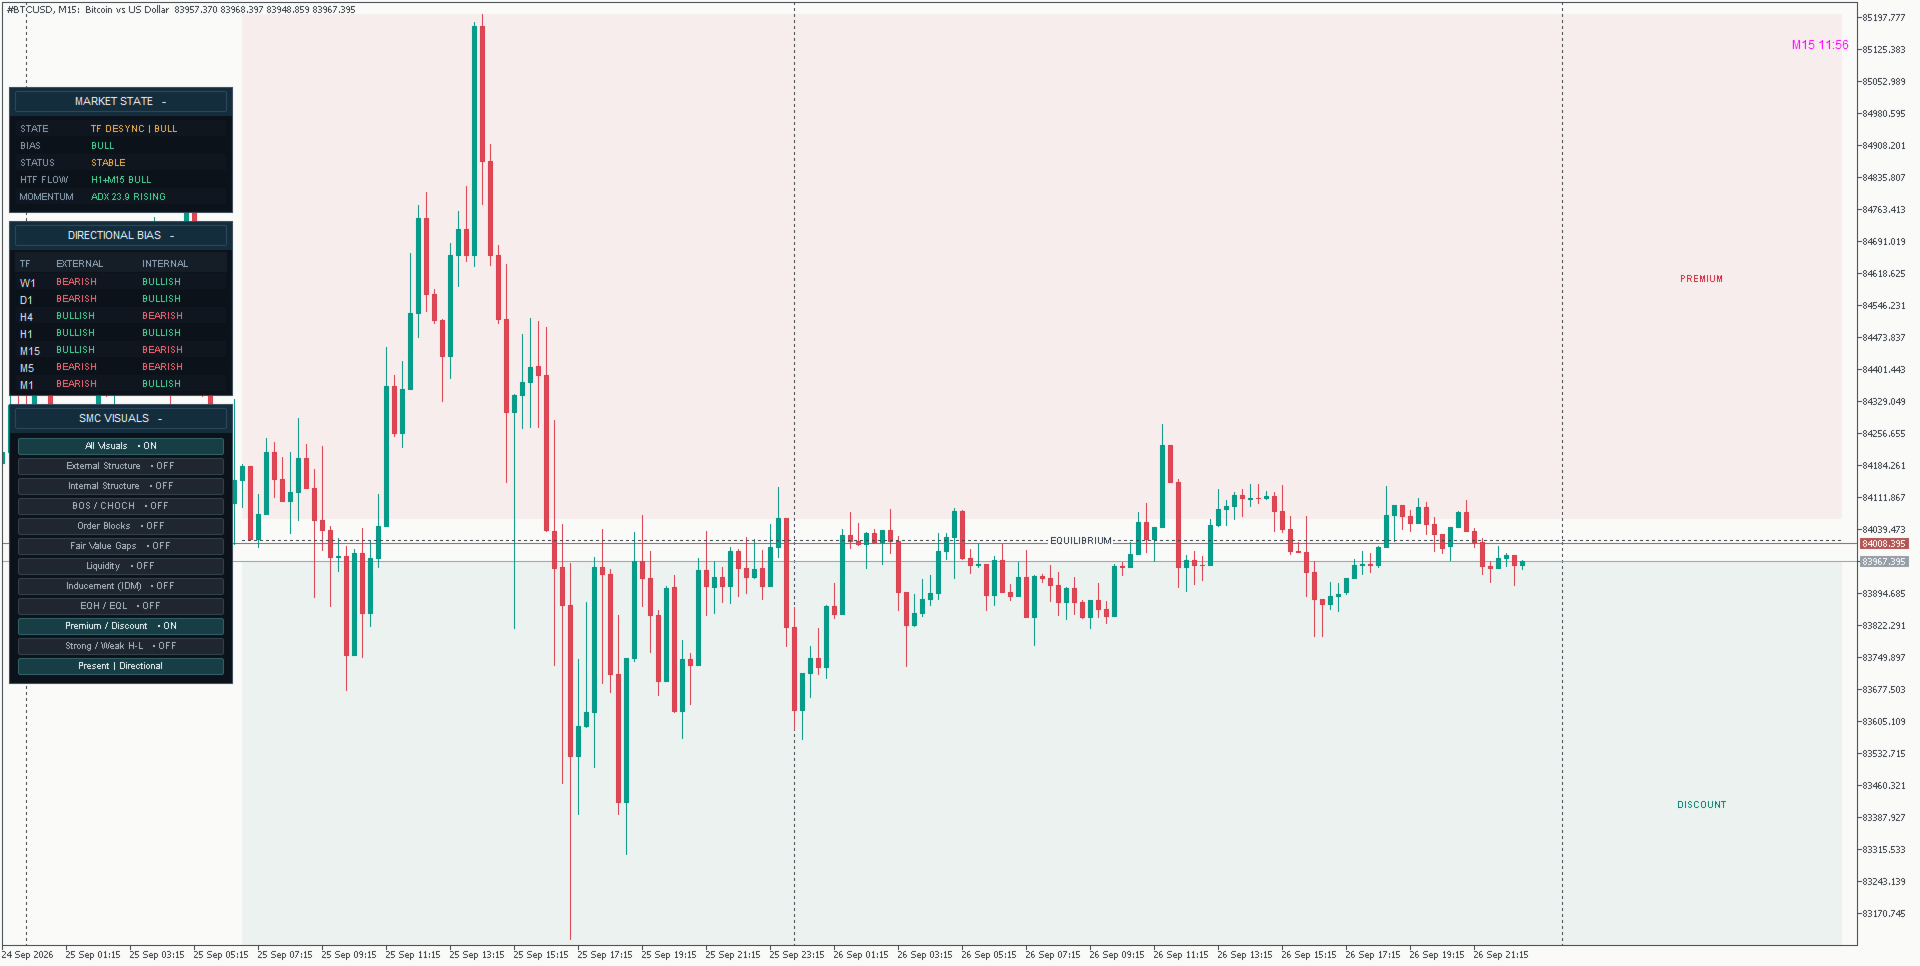
## PREMIUM, DISCOUNT AND EQUILIBRIUM

The active external structural range is divided into:

- Premium
- Equilibrium
- Discount

The midpoint of the current external structural range is used as Equilibrium.

The area above Equilibrium represents Premium, while the area below represents Discount.

These zones are contextual filters, not automatic trading signals.

For example:

A bullish Order Block or Fair Value Gap located in Discount during bullish structure may provide different context from the same zone positioned high in Premium.

Similarly, a bearish area of interest located in Premium may provide more relevant structural context during bearish conditions.


## STRONG AND WEAK HIGHS / LOWS

The viewer can also identify Strong and Weak structural highs and lows.

These levels provide additional information about the current structural range and possible directional objectives.

They can be displayed or hidden independently through the visual control panel.


## HIGHER-TIMEFRAME FLOW

Higher-timeframe flow provides a simplified view of the relationship between H1 and M15 structure.

The panel can display conditions such as:

- H1 + M15 Bull
- H1 + M15 Bear
- H1 / M15 Mixed

This helps quickly identify whether lower-timeframe analysis is aligned with or moving against the broader structural environment.


## MOMENTUM CONTEXT

The Market State panel includes M5 ADX information together with its recent slope.

Momentum can be displayed as:

- Rising
- Falling
- Flat

This provides additional context about whether directional strength is increasing, weakening or remaining relatively stable.

Momentum should be interpreted together with structure and market state rather than used as a standalone signal.


## INTERACTIVE SMC VISUAL CONTROLS

A major challenge with advanced SMC analysis is chart clutter.

Market Structure Viewer includes an interactive control panel that allows analytical layers to be enabled or disabled individually.

Available visual controls include:

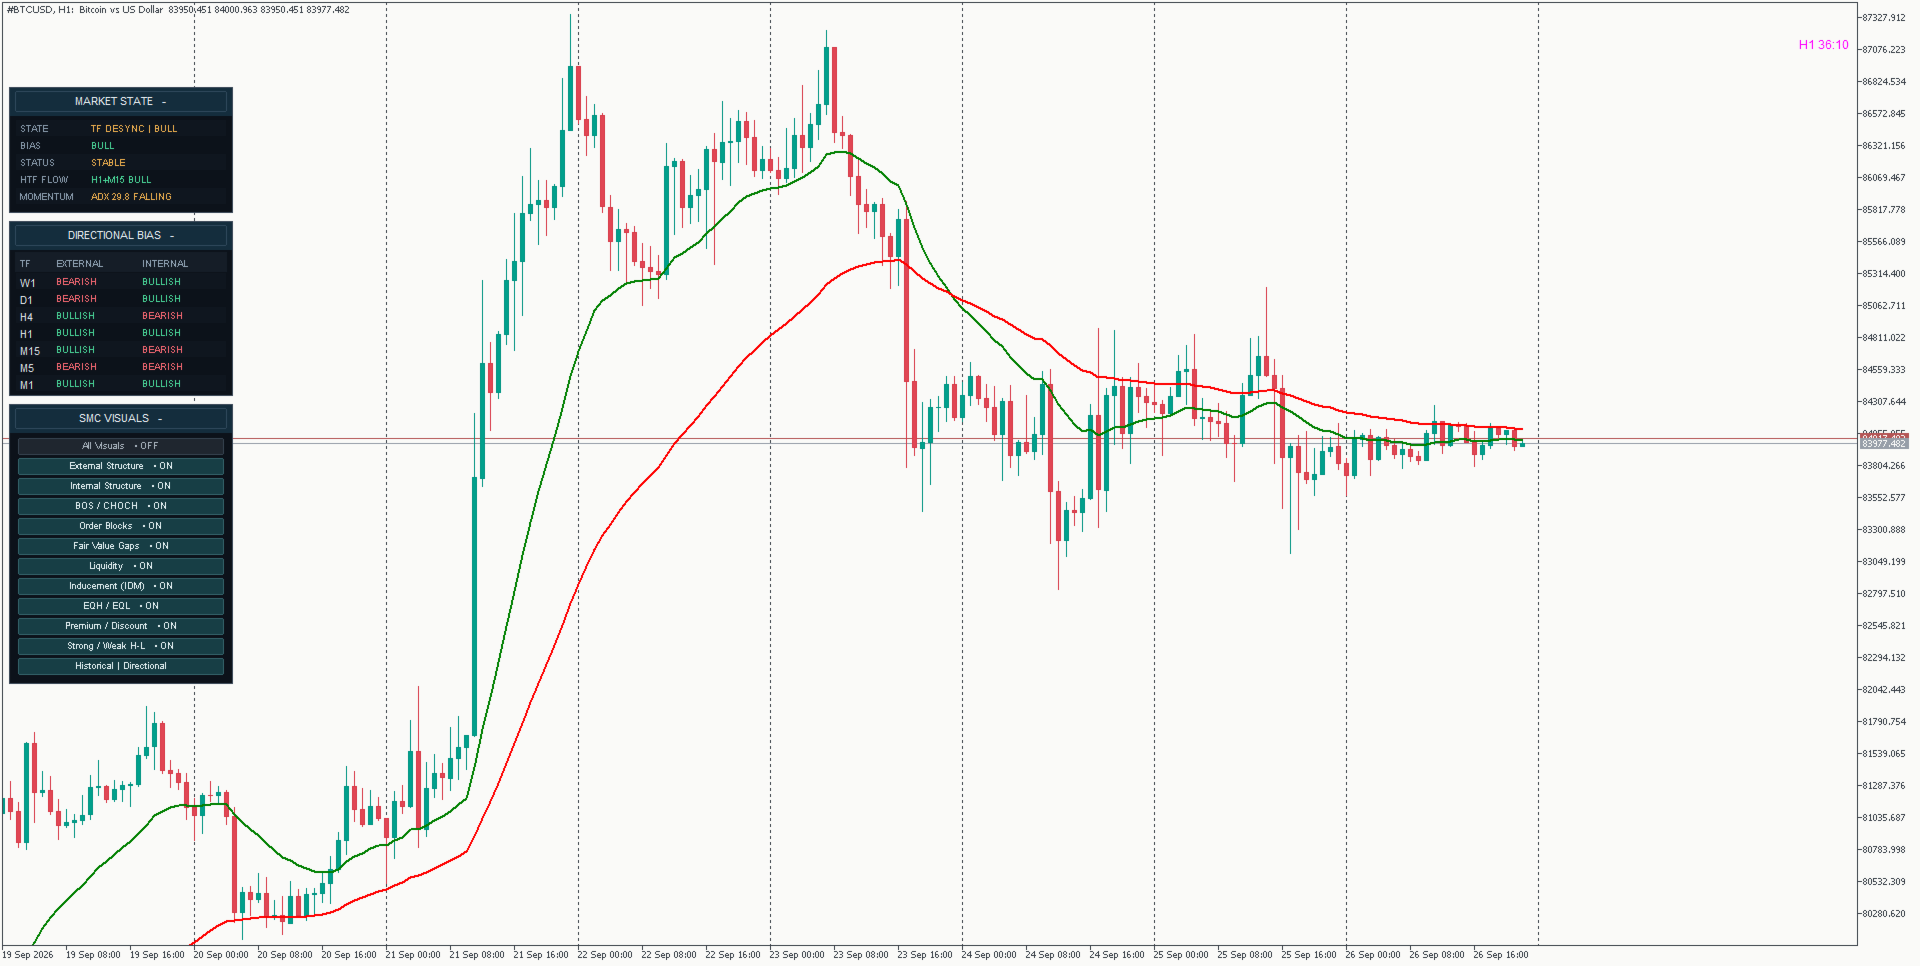
- All Visuals
- External Structure
- Internal Structure
- BOS / CHOCH
- Order Blocks
- Fair Value Gaps
- Liquidity
- Inducement (IDM)
- EQH / EQL
- Premium / Discount
- Strong / Weak Highs and Lows

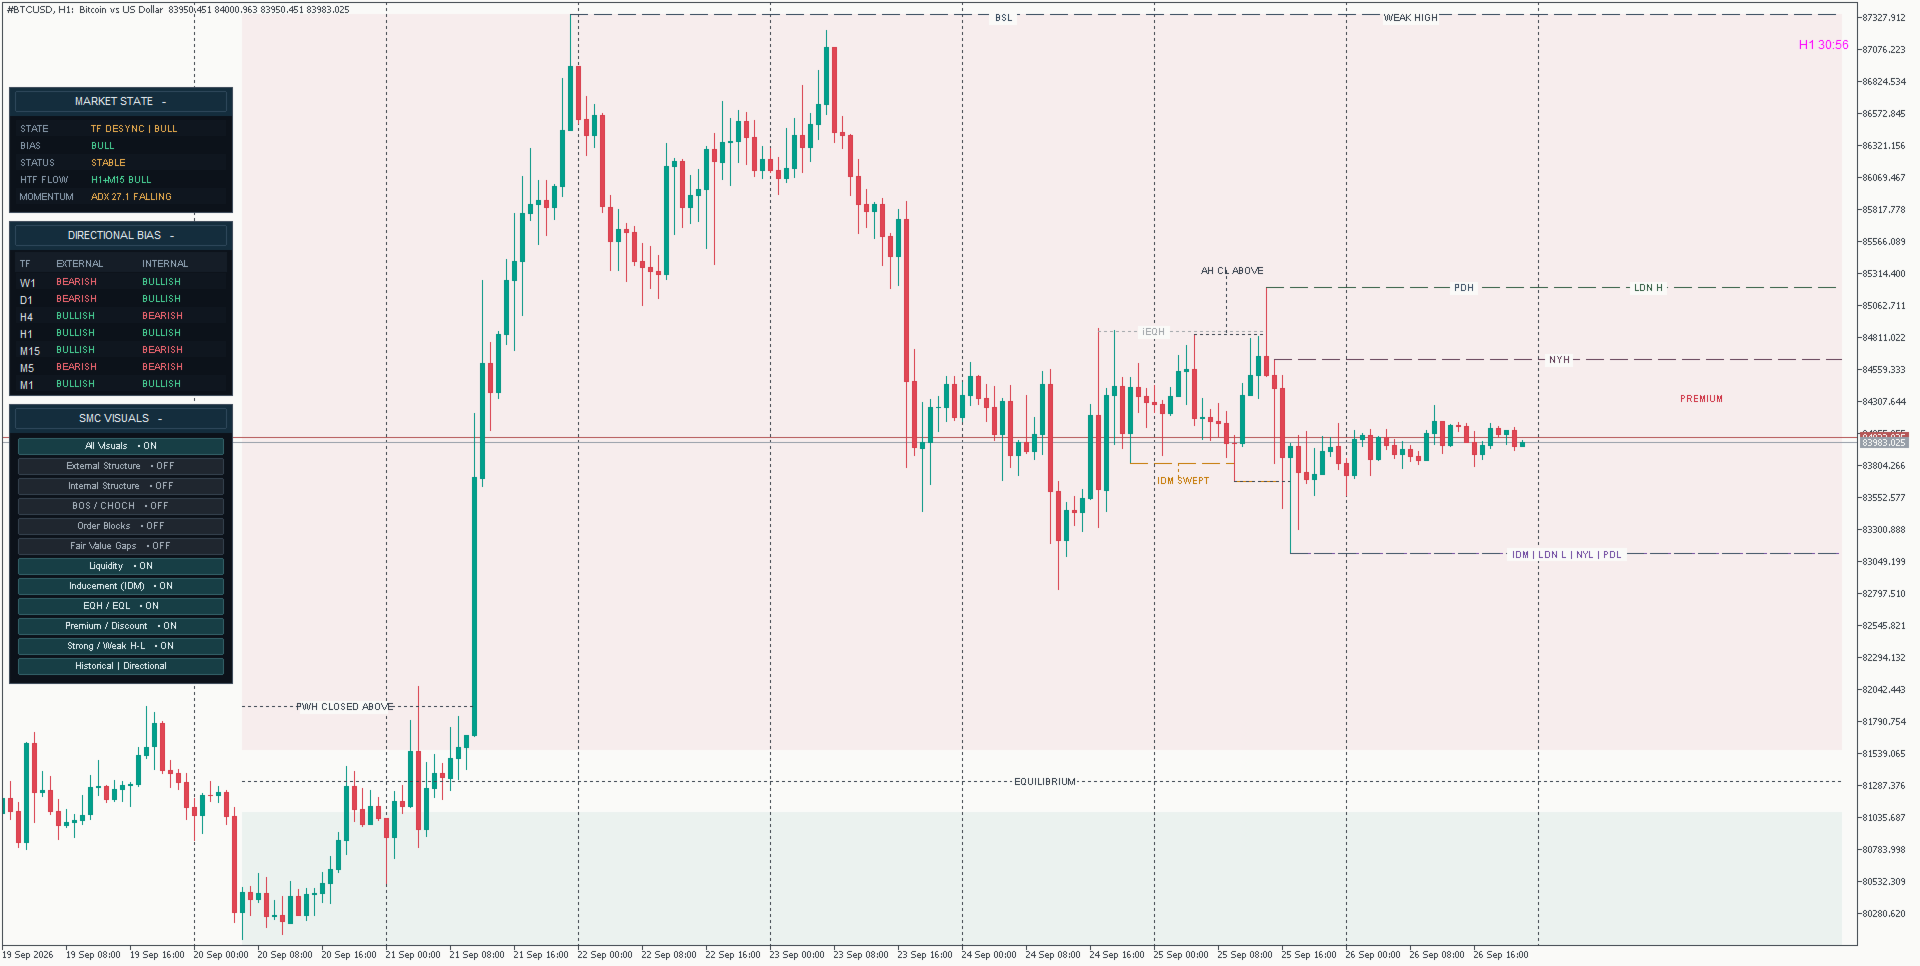
The All Visuals control acts as a master switch for chart overlays.

Turning All Visuals OFF temporarily hides the SMC chart drawings without changing the individual visual-layer selections.

When All Visuals is turned back ON, the previously selected visual settings are restored.

The Market State and Directional Bias panels operate independently from the All Visuals master control.

Individual layers can still be enabled or disabled separately according to the type of analysis currently being performed.

For example, a trader studying liquidity can temporarily hide Order Blocks and Fair Value Gaps and focus only on Liquidity, IDM and EQH/EQL.


## PRESENT AND HISTORICAL DISPLAY MODES

Market Structure Viewer provides two display modes for different types of analysis.


### PRESENT MODE

Present Mode focuses on the most recent and currently relevant market structure.

It reduces historical chart clutter by prioritizing the latest structural highs and lows, BOS/CHOCH events, active Order Blocks, Fair Value Gaps, liquidity references and other current SMC information.

This mode is useful when the main objective is analysing the current market environment.

Present Mode is designed to keep the chart cleaner while preserving the most relevant current structural context.


### HISTORICAL MODE

Historical Mode provides a broader view of previous market structure and structural events.

More historical structural highs and lows, BOS/CHOCH events, Order Blocks, Fair Value Gaps, liquidity references, inducement levels, EQH/EQL and other SMC information can be displayed.

When the chart is scrolled backward, the viewer adapts to the visible historical area and rebuilds relevant SMC information for that part of the chart.

This makes it possible to review previous structural development directly within historical price action.

Historical calculations are designed around the historical area being reviewed instead of simply projecting the latest market state backward across the chart.

This mode is useful for:

- Manual chart review
- Studying previous market behaviour
- Reviewing structural development
- Analysing previous BOS / CHOCH events
- Reviewing historical Order Blocks and Fair Value Gaps
- Studying liquidity interactions
- Comparing different market environments

Present and Historical modes change how chart information is displayed.

They do not change the underlying purpose of the Market State or Directional Bias panels.


## VISUAL THEMES

Different visual themes are available to improve chart readability.

These include:

- Institutional Neutral
- Monochrome
- Directional Color

Changing the visual theme does not change the analytical logic of the indicator.

It only changes how structural information is presented.


## COLLAPSIBLE PANELS

The Market State, Directional Bias and SMC Visuals panels can be collapsed when additional chart space is required.

This is especially useful on lower timeframes where price action develops quickly and screen space is important.

Collapsing a panel changes the interface layout only.

The underlying analytical engine can continue updating independently.


## HOW TO USE

1. Attach Market Structure Viewer to an MT5 chart.

2. Allow sufficient historical data to load for all required timeframes.

3. Begin with the Market State and Directional Bias panels to understand the broader market environment.

4. Review the external and internal structure of the current timeframe.

5. Use BOS and CHOCH to understand structural continuation or possible transition.

6. Analyse nearby liquidity, inducement, EQH/EQL, Order Blocks and Fair Value Gaps.

7. Check whether price is positioned in Premium, Discount or near Equilibrium.

8. Compare lower-timeframe events with higher-timeframe directional bias.

9. Use Present Mode for current-market analysis or Historical Mode when reviewing previous price action and structural development.

10. Use the All Visuals master control or individual visual-layer controls to keep the chart focused on the information required for the current analysis.

11. Make the final trading decision using your own strategy and risk-management rules.


## EXAMPLE 1: TREND ALIGNMENT

Suppose M1 prints a bullish BOS.

If M15 and H1 are also bullish and the market is trading from a relevant Discount area, the lower-timeframe bullish break is occurring in alignment with the broader market structure.

If M15 and H1 remain bearish, the same bullish M1 BOS may instead represent a lower-timeframe retracement.

The viewer helps expose this difference directly on the chart.


## EXAMPLE 2: LIQUIDITY AND PRICE ZONES

Suppose price sweeps an Equal Low and then reacts from a bullish Order Block or Fair Value Gap located in Discount.

The liquidity sweep, structural location and higher-timeframe bias can be evaluated together instead of treating the Order Block or FVG as an independent signal.

This is the main purpose of Market Structure Viewer: combining several structural elements into one coherent analytical framework.


## EXAMPLE 3: PRESENT VS HISTORICAL REVIEW

Suppose the trader is analysing the current H1 market structure.

Present Mode can be used to keep the chart focused on the most recent structural information and active areas of interest.

If the trader wants to study how the same market behaved several days earlier, Historical Mode can be selected and the chart can be scrolled backward.

The viewer then provides historical structural context around the area being reviewed.

This makes the two modes useful for different purposes without requiring separate indicators.


## WHO IS THIS INDICATOR FOR?

Market Structure Viewer may be useful for traders who use:

- Smart Money Concepts
- Market Structure
- BOS / CHOCH analysis
- Order Blocks
- Fair Value Gaps
- Liquidity concepts
- Multi-timeframe analysis
- Premium / Discount analysis
- Discretionary price-action trading

It is designed for traders who want a structured visual workspace rather than an automatic signal generator.


## IMPORTANT INFORMATION

Market Structure Viewer is a discretionary analysis tool.

It does not:

- Automatically open trades
- Automatically close trades
- Manage positions
- Guarantee profitable trades
- Predict future market movement
- Replace risk management

Market conditions can change and structural classifications may update as new candles close and new information becomes available.

Market State classifications, structural levels, liquidity states, Order Blocks, Fair Value Gaps and other displayed information can update as new confirmed market information becomes available.

Historical visualisation is intended for analysis and review. It should not be interpreted as a guarantee that historical market behaviour will repeat.

Results and displayed levels can vary slightly between brokers because of differences in price feeds and available historical data.

Sufficient historical data must be available for multi-timeframe calculations.

The final interpretation, entry decision, position sizing, stop loss, take profit and overall risk management remain the responsibility of the trader.


## FINAL NOTE

Market Structure Viewer is designed to reduce repetitive chart work and organize complex Smart Money Concepts into a clearer multi-timeframe framework.

Instead of switching constantly between charts and manually combining structure, liquidity, zones and directional bias, the indicator brings these elements together in one MT5 workspace.

The goal is simple:

More structured analysis.
Less chart clutter.
Better visibility of the market context.
Önerilen ürünler
Structure King AI Signal Structure King AI Signal is a professional MetaTrader 5 trading indicator designed to help traders analyze market structure, trend direction, multi-timeframe confirmation and trade management from one clean dashboard. Key Features • Market Structure & Trend Analysis • BUY / SELL Signals • Multi-Timeframe (HTF) Confirmation • Entry Price Levels • Dynamic Stop Loss (SL) • TP1 / TP2 / TP3 Levels • ATR Volatility Analysis • ADX Trend Strength Filter • Adaptive Market Filter
RBreaker
Zhong Long Wu
RBreaker Gold Indicators is a short-term intraday trading strategy for gold futures that combines trend following and intraday reversal approaches. It not only captures profits during trending markets but also enables timely profit-taking and counter-trend trading during market reversals. This strategy has been ranked among the top ten most profitable trading strategies by the American magazine   Futures Truth   for 15 consecutive years. It boasts a long lifecycle and remains widely used and st
What Is Trend Master Pro? Trend Master Pro   is a professional-grade trend trading indicator built for MetaTrader 5. It was designed with one goal in mind — to keep you on the right side of the market at all times by combining three powerful technical tools into a single, clean, easy-to-read display directly on your price chart. Instead of cluttering your screen with multiple separate indicators, Trend Master Pro fuses an   EMA Ribbon trend filter , a   ZigZag swing point engine , and a   breako
SPECIAL LAUNCH OFFER: $30 (1-Month Rent) Limited time offer to build our community and gather feedback! AmbM GOLD Institutional Scalper A high-precision M5 algorithm for XAUUSD (Gold) , engineered to trade exclusively at Institutional Liquidity Levels ($5/$10 psychological marks). PERFORMANCE DATA (BUY ONLY) • Win Rate: 87.09%. • Safe Growth: +$4,113 profit on $10k (13.75% Max Drawdown). • Extreme Stress Test: Successfully generated +$22,997 in a 5-year stress test (2020-2026), proving
Your Trend Friend
Luigi Nunes Labigalini
5 (1)
The trend is your friend! Look at the color of the indicator and trade on that direction. It does not  repaint. After each candle is closed, that's the color of the trend. You can focus on shorter faster trends or major trends, just test what's most suitable for the symbol and timeframe you trade. Simply change the "Length" parameter and the indicator will automatically adapt. You can also change the color, thickness and style of the lines. Download and give it a try! There are big movements w
STRICTLY FOR BOOM INDEX ONLY!!!!! Here I bring the Maximum Trend Arrows OT1.0 MT5 indicator. This indicator is made up of a combination of different trend indicators for entries and exits, for entries an orange arrow will paint on the chart below the current market and a red flag for closing of trades and it produces buy arrows only. When the orange arrow appears, it will appear along with it's sound to notify you. The 1H timeframe is recommended, don't use it anywhere else than on the 1H timefr
Noize Absorption Index - is the manual trading system that measures the difference of pressure between bears forces and bulls forces. Green line - is a noize free index that showing curent situation. Zero value of index shows totally choppy/flat market.Values above zero level shows how powerfull bullish wave is and values below zero measures bearish forces.Up arrow appears on bearish market when it's ready to reverse, dn arrow appears on weak bullish market, as a result of reverse expectation.
Mine Farm
Maryna Kauzova
Mine Farm is one of the most classic and time-tested scalping strategies based on the breakdown of strong price levels. Mine Farm is the author's modification of the system for determining entry and exit points into the market... Mine Farm - is the combination of great potential with reliability and safety. Why Mine Farm?! - each order has a short dynamic Stop Loss - the advisor does not use any risky methods (averaging, martingale, grid, locking, etc.) - the advisor tries to get the most
Fabii Half Trend Baseline
Fabien Georges Andre Guillemaud
Üst zaman diliminin trendine karşı işlem yapmayı bırakın. İki baseline, tek grafik. Repaint yok. Her parite, her zaman dilimi. 2 dakikada grafiğinizde. Strategy Tester içinde ücretsiz demo. Get more indicators here Baselines, volatility filters and oscillators. No repaint. Neden ihtiyacınız var Grafiğinizde bir çizgi yeşile döndüğü için işleme girersiniz. Sonra üst zaman dilimini açarsınız ve daha büyük trendin ters yönde olduğunu görürsünüz. Sinyal gerçekti. Ama arkasındaki trend sizin taraf
Fibaction
Abdelkhalek Orabi
Indicator Name: Fibaction – price action candle Detector Description: Fibo Signal Boxes is a powerful Smart Money Concept (SMC)-inspired indicator that auto-detects price action candles. bullish hammers and shooting stars, then draws precise Fibonacci entry zones and multiple take-profit levels directly on the chart. as for the SL personally i use 40 pips rules  Key Features: Detects bullish hammer and shooting star reversal candles. Automatically draws Fibonacci entry and TP boxes. as
Max Min Delta Indicator - Market Volume Imbalance Analysis Gain Deeper Insights into Market Volume Imbalance with Delta Analysis What is the Max Min Delta Indicator? The Max Min Delta Indicator is a powerful market volume analysis tool that visually represents maximum and minimum delta values using a histogram. It helps traders identify market strength, weakness, absorption, and aggressive buying/selling activity with precision. Key Features Histogram Visualization: Displays Max Delta (Green) an
Caicai L&S Yield Histogram Important Notice: This indicator is an integral tool of the automated EA Caicai Long and Short Pair Trading . This indicator visually displays the percentage deviation (Yield %) of a pair's current spread relative to its own historical mean. It is an excellent tool for quickly visualizing the gross financial potential of a market distortion in Long & Short operations. Main Features: Percentage Visualization: Understand the size of the distortion in palpable percentage
ONNYX INDICATOR sürüm 1.14 MetaTrader 5 için onaylanmış ve yeniden boyanmayan sinyallere sahip arz-talep göstergesidir. Onaylı salınımları belirler, bölge genişliğini ATR ile ayarlar, kaliteyi yüzde olarak gösterir ve kapanmış mumlarda BUY/SELL okları çizer. TEMEL ÖZELLİKLER - Bölge içinde yüzde kalite puanı bulunan arz-talep bölgeleri. - Mum kapanışından sonra büyütülmüş BUY/SELL okları. - İsteğe bağlı EMA trend filtresi ve mum reddi onayı. - Trend, fiyat seviyeleri ve piyasa bağlamı paneli. -
BTC Trend Scalper MT5 Trend Capture Edition — BTCUSD için Hassas Momentum Ticareti Merhaba yatırımcılar! Ben   BTC Trend Scalper MT5   — disiplinli risk yönetimi ile momentum hareketlerini yakalamak için tasarlanmış akıllı bir Bitcoin ticaret uzman danışmanıyım. Martingale değilim. Izgara sistemi değilim. Kumar robotu değilim. Her mumun peşinden koşmaktan sermayeyi korumanın daha önemli olduğunu anlayan yatırımcılar için özel olarak oluşturulmuş,   trend takip eden bir scalper'ım . Uzmanlık al
PipFinite Trend PRO MT5
Karlo Wilson Vendiola
4.84 (561)
Breakthrough Solution For Trend Trading And Filtering With All Important Features Built Inside One Tool! Trend PRO's smart algorithm detects the trend, filters out market noise and gives entry signals with exit levels. The new features with enhanced rules for statistical calculation improved the overall performance of this indicator. Important Information Revealed Maximize the potential of Trend Pro, please visit www.mql5.com/en/blogs/post/713938 The Powerful Expert Advisor Version Automatin
EMA256 Fourier Cycle Trader EMA256 Fourier Cycle Trader is an advanced MetaTrader 5 Expert Advisor combining a long-term EMA or TEMA trend model, causal Fourier cycle analysis, configurable averaging and a unified basket take-profit system. The Expert Advisor is designed primarily for CENT accounts and for traders who understand basket recovery strategies, geometric lot progression and the risks associated with trading without a mandatory Stop Loss. RECOMMENDED STARTING CONFIGURATION Recommended
Bollinger Bands are a technical analysis tool that consists of a set of three lines plotted on a price chart. The middle line is a simple moving average, usually of 20 periods, and the upper and lower lines represent the standard deviation of the price from the moving average. The upper band is calculated by adding two standard deviations to the moving average, while the lower band is calculated by subtracting two standard deviations from the moving average. This creates a band around the moving
HAS RSI Signal — Otomatik SL/TP Hesaplamalı Profesyonel Trend Göstergesi HAS RSI Signal , kanıtlanmış klasik yöntemleri modern gürültü filtreleme algoritmalarıyla birleştiren güçlü bir ticaret aracıdır. Gösterge, piyasayı Heiken Ashi Smoothed (HAS) mumları ve RSI osilatörü merceğinden analiz ederek, trend dönüşlerinde veya aşırı alım/satım bölgelerinden çıkışlarda yatırımcıya net giriş sinyalleri sağlar. Temel Avantajlar: Çift Filtreleme: Heiken Ashi Smoothed kullanımı piyasadaki "gürültüyü" ort
Divergent Stochastic Filter II Catch Reversals Early, Filter Noise, Trade with Confidence The Edge: Why This Stochastic is Different  Every trader knows the Stochastic oscillator. But knowing when to trust its signals, that's the real challenge. The Divergent Stochastic Filter II transforms this classic indicator into a precision reversal detection system by adding critical elements: divergence intelligence, signal filtering and exhaustion detection.  While standard Stochastic oscillators fire s
A powerful oscillator that provide Buy and Sell signals by calculating the investor liquidity. The more liquidity the more buy possibilities. The less liquidity the more sell possibilities. Please download the demo and run a backtest! HOW IT WORKS: The oscillator will put buy and sell arrow on the chart in runtime only . Top value is 95 to 100 -> Investors are ready to buy and you should follow. Bottom value is 5 to 0 -> Investors are ready to sell and you should follow. Alert + sound will appe
# DRAWDOWN INDICATOR V4.0 - The Essential Tool to Master Your Trading ## Transform Your Trading with a Complete Real-Time Performance Overview In the demanding world of Forex and CFD trading, **knowing your real-time performance** isn't a luxury—it's an **absolute necessity**. The **Drawdown Indicator V4.0** is much more than a simple indicator: it's your **professional dashboard** that gives you a clear, precise, and instant view of your trading account status. --- ## Why This Indicator
GOLD FIBONACCI SNIPER M5 Description GOLD FIBONACCI SNIPER M5 is a professional MetaTrader 5 indicator specially developed for XAUUSD (Gold) on the M5 timeframe. The indicator uses Fibonacci retracements combined with trend analysis, volatility filters, candle rejection patterns, and market strength confirmation to identify high-probability entry opportunities. The system automatically detects retracement zones between the 38.2, 50, and 61.8 Fibonacci levels, which are commonly considered instit
Visual CrossPulse Dynamics Indicator
AL MOOSAWI ABDULLAH JAFFER BAQER
Visual CrossPulse Dynamics: Trade with the Market's True Rhythm Unlock a new level of market insight with Visual CrossPulse Dynamics, a sophisticated trading indicator designed to adapt to ever-changing volatility and reveal the true direction of the trend. Are you tired of indicators that lag in fast-moving markets or give false signals during consolidation? The Visual CrossPulse Dynamics indicator solves this problem by using an advanced, adaptive algorithm that intelligently adjusts to the m
"Impulses and Corrections 5" is created to help traders navigate the market situation. The indicator shows multi-time frame upward and downward "Impulses" of price movements. These impulses are the basis for determining the "Base" , which is composed of zones of corrections of price movements, as well as "Potential" zones for possible scenarios of price movement. Up and down impulses are determined based on a modified formula of Bill Williams' "Fractals" indicator. The last impulse is always "U
MQL5 Market Listing: Bollinger Pro Bollinger Pro   is an advanced signal-based indicator designed to simplify market analysis by identifying high-probability entry points. Unlike standard Bollinger Band indicators that only show volatility channels, Bollinger Pro utilizes a proprietary algorithm to detect market conditions—whether the market is trending or sideways—and prints direct Buy/Sell signals on the chart. The indicator is designed for traders who seek a "clean chart" experience while mai
Dewa Scalper Feel Good
Pupung Widiyapurnama
Dewa Scalper Feel Good EA Description Dewa Scalper Feel Good EA is an advanced automated trading solution engineered for consistent, stress-free capital growth. Built on precise multi-candle momentum patterns, this Expert Advisor captures high-probability market swings on the H1 timeframe while keeping risk strictly under control. It combines a smart switching entry model with a disciplined Break-Even Point (BEP) recovery algorithm and automated auto-compounding. Unlike conventional high-risk gr
C88 Projected Candle See the Bigger Picture Before the Candle Closes C88 Projected Candle is a professional market visualization indicator that projects the current higher timeframe candle directly onto your active chart. It helps traders understand the evolving market structure without constantly switching between timeframes. Whether you trade Price Action, ICT, Smart Money Concepts (SMC), or Volume Profile, this indicator provides a cleaner and more intuitive way to read market context. Key Fe
Smart Support And Resistance Indicator See the Market Levels That Matter. Make your chart clearer and your technical analysis more organized with Smart Support And Resistance Indicator — a powerful trading tool designed to help traders identify important support and resistance levels directly on their MetaTrader 5 charts. Whether you trade Forex, Gold, Indices, or other available markets, this indicator helps you focus on key price areas, monitor potential market reactions, and analyze price act
SMC Smart Flow Pro
Thitipong Nookhunthod
Short Description: SMC Smart Flow Pro is an advanced Smart Money Concept indicator that automatically detects Break of Structure (BOS), Change of Character (CHoCH), and projects precise TP/SL target levels on all timeframes — built for serious traders who trade with institutional flow. Full Description: SMC Smart Flow Pro is a premium Smart Money Concept (SMC) indicator for MetaTrader 5, engineered for traders who want to trade alongside institutional order flow. By automatically mapping m
NQX Range Edge Hook Weekly Bias, MetaTrader 5 için bir sinyal göstergesidir: aralık kenarı kancası sinyalleri (yalnızca haftalık eğilim yönünde sinyal verir). Fiyatın son aralığının kenarından ayrılmasını mum ile teyit edilmiş şekilde tespit eden özel NQX mantığı. Yalnızca haftalık eğilim yönünde sinyal verir. Önerilen girişi, kısa bir stopu ve uzak hedefleri (3:1, 5:1, 10:1, swing'de 20:1'e kadar) çizer; kararı siz verirsiniz. Grafikte neler çizer - Kapanmış sinyal mumunun üzerinde bir ok (kapa
Bu ürünün alıcıları ayrıca şunları da satın alıyor
Trend Sniper X
Sarvarbek Abduvoxobov
4.86 (44)
Trend Sniper X , tüccarların trend yönünü ve olası dönüş noktalarını netlik ve hassasiyetle belirlemelerine yardımcı olan MetaTrader 5 için çoklu zaman dilimli bir trend takip göstergesidir. MT4 için: https://www.mql5.com/en/market/product/193245 Fiyat Bilgisi: Mevcut fiyat tanıtım amaçlıdır ve gelecek güncellemeler ile yeni özellikler yayınlandıkça değişebilir. Bonus Fırsatı: Bu indikatör için ÜCRETSİZ Oto-Trade Assistant EA'yı almak için lütfen satın aldıktan sonra yazara mesaj gönderin. Code
Entry Points Pro, emri vermeden önce nereden gireceğinizi, stopu nereye koyacağınızı ve hangi lotla işlem yapacağınızı gösterir. FİYAT Şu anda 149 USD ve bu fiyattan satılan son kopya. Sonrasında fiyat 199 USD'ye çıkacak, nihai fiyat ise 349 USD. Paramı piyasalarda işlem yaparak kazanıyorum ve bunu gösteriyorum, bu yüzden bu indikatörü herkese satmak zorunda değilim. Bu, kendi kafasıyla düşünen traderlar için bir araç, sihirli bir düğme değil. Ok mum kapanışında belirir ve repaint olmaz. İki ay
Gann Made Easy , bay teorisini kullanarak ticaretin en iyi ilkelerine dayanan, profesyonel ve kullanımı kolay bir Forex ticaret sistemidir. WD Gann. Gösterge, Zararı Durdur ve Kâr Al Seviyeleri dahil olmak üzere doğru SATIN AL ve SAT sinyalleri sağlar. PUSH bildirimlerini kullanarak hareket halindeyken bile işlem yapabilirsiniz. Satın alma işleminden sonra, alım satım talimatlarını ve harika ek göstergeleri ücretsiz olarak almak için lütfen benimle iletişime geçin! Muhtemelen Gann ticaret yöntem
Ultra Indicator
Ihor Otkydach
5 (1)
ULTRA, “hepsi bir arada” prensibiyle çalışan bir teknik göstergedir; piyasayı bağımsız olarak analiz eder, işlem sinyalleri üretir, stop-loss emirlerinin verileceği seviyeleri gösterir ve kârı garantilemek ya da zararı en aza indirmek için işlemlerin ne zaman kapatılması gerektiğini önerir. Başka bir deyişle, piyasayı nasıl analiz edeceğinizi bilmeseniz, seviyeleri (stop-loss'unuzu nereye koyacağınızı) belirleyemeseniz ya da para yönetimi konusunda zorluk yaşasanız da fark etmez. ULTRA tüm bunla
Boba Analysis Suite
Trade Ready Solutions LLC
5 (2)
Boba Analysis Suite Boba Analysis Suite, MetaTrader 5 için geliştirilmiş bir analiz göstergesidir. Piyasa yapısını, önemli fiyat bölgelerini ve genel piyasa bağlamını tek bir grafik görünümünde bir araya getirir. Trader ve trading eğitmeni olarak edinilen uygulamalı deneyimden yola çıkarak geliştirilmiştir. Piyasanın yönünü değerlendirme, önemli seviyeleri belirleme ve birden fazla zaman dilimini birlikte inceleme gibi adımlardan oluşan sistematik bir analiz sürecini destekler. Piyasa Bağlamını
Sonraki Güncelleme — Sürüm 2.52 Çok Yakında! [YENİ] Piyasa Analizinizi ve İşlem Sürecinizi Geliştirmek İçin Tasarlanmış 4 Büyük Yeni Özelliğe Hazır Olun İşlem ihtiyaçlarınızı karşılamak üzere tasarlanmış 4 yeni özellikle piyasa analizini bir üst seviyeye taşıyoruz. İşte yeni özellikler: 1. TRADE OVERVIEW DASHBOARD 2. CONFLUENCE AT ZONE 3. STRONG & WEAK HIGH/LOW 4. OTE 1. TRADE OVERVIEW DASHBOARD Piyasanın genel görünümünü daha kolay anlamanıza yardımcı olan, işlem kararlarınızı desteklemek için
M1 Sniper MT5
Oleg Rodin
5 (7)
M1 SNIPER   kullanımı kolay bir işlem göstergesi sistemidir. M1 zaman dilimi için tasarlanmış bir ok göstergesidir. Gösterge, M1 zaman diliminde scalping için bağımsız bir sistem olarak kullanılabilir ve mevcut işlem sisteminizin bir parçası olarak kullanılabilir. Bu işlem sistemi özellikle M1'de işlem yapmak için tasarlanmış olsa da, diğer zaman dilimleriyle de kullanılabilir. Başlangıçta bu yöntemi XAUUSD ve BTCUSD ticareti için tasarladım. Ancak bu yöntemi diğer piyasalarda işlem yaparken de
FiboSniper Pro
Van Minh Nguyen
5 (4)
FiboSniper Pro – Multi-Filter Fibonacci System with Auto SL/TP and Control Panel FiboSniper Pro, seçilmiş Buy ve Sell sinyalleri üretmek için dinamik Fibonacci Envelopes ile birden fazla doğrulama filtresini birleştiren teknik bir göstergedir. Fibonacci seviyeleri Moving Average ve ATR temel alınarak hesaplanır ve ardından ADX, EMA, RSI, ATR, Volume, Time ve Candle yapısı ile filtrelenir. Gösterge, ATR tabanlı otomatik Stop Loss ve Take Profit seviyelerini doğrudan grafik üzerinde görüntüler ve
Auto Optimized SpeedAngle , sürekli İleriye Dönük Optimizasyon (Walk-Forward Optimization, WFO) yoluyla eğri uydurmayı (curve-fitting) ortadan kaldıran kurumsal düzeyde bir momentum vektörleme sistemidir. Piyasa rejimleri değiştiğinde etkinliğini yitiren statik girdilere güvenmek yerine, gösterge, örneklem dışı (Out-of-Sample, OOS) doğrulama kullanarak parametrelerini dinamik olarak yeniden kalibre eder ve böylece gösterilen sinyallerin geçmişteki rastgele anomalileri değil, gerçek bir istatisti
Adaptive Price Action Engine Göstergeyi al, EA'sı (Uzman Danışman) bedava gelsin Kendi Kendini Optimize Eden Multi-Timeframe Trend ve Mum Formasyonu Analizi Piyasalar sürekli değişir ve her Price Action formasyonu her piyasa koşulunda aynı değere sahip değildir. Adaptive Price Action Engine , değişen piyasa koşullarına uyum sağlamak amacıyla trend yapısını, Multi-Timeframe analizini, mum formasyonlarını ve istatistiksel optimizasyonu tek bir analiz sistemi içerisinde birleştirir. İki Adaptif Mod
Crystal Heikin Ashi Signals
Muhammad Jawad Shabir
5 (5)
Crystal Heikin Ashi Signals—Professional Trend & Signal Detection Indicator Advanced Heikin Ashi Visualization with Intelligent Signal System for Manual & Automated Trading Final Price: $149 ---------> Price goes up $10 after every 10 sales . Limited slots available — act fast . Overview User Guide PDF Crystal Heikin Ashi Signals is a professional-grade MetaTrader 5 indicator that combines pure Heikin Ashi candle visualization with an advanced momentum-shift detection system. Designed for both m
Scalper Vault, gün içi işlemlerde istikrar yakalamak isteyen yatırımcılar için tasarlanmış, güçlü ve tam donanımlı bir alım satım sistemidir. Bu yüksek hassasiyetli gösterge; hem Forex hem de İkili Opsiyon yatırımcıları için kurumsal düzeyde analizler sunan, bağımsız ve eksiksiz bir alım satım sistemi işlevi görür. SATIN ALIM İŞLEMİNDEN SONRA BENİMLE İLETİŞİME GEÇİN; ALIM SATIM İPUÇLARIMI VE HARİKA BİR BONUSU ALIN! Tahmin yürütme zorunluluğunu ve karmaşık manuel analiz süreçlerini ortadan kaldı
SIO Oscillator: Kendi Kendini Optimize Eden Yarı Varyans Dengesizlik Osilatörü İndikatörü satın alın, ona dayalı Uzman Danışmanı (EA) ÜCRETSİZ edinin. Çoğu osilatör, tüm fiyat hareketlerini aynı şekilde değerlendirir. SIO ise yükseliş ve düşüş baskısını birbirinden ayırır ve aralarındaki dengesizliği ölçerek piyasayı gerçekte kimin kontrol ettiğini gösterir: alıcılar mı, satıcılar mı. Dengesizlik bir uç noktaya ulaştığında SIO, giriş, Stop Loss ve Take Profit seviyeleriyle birlikte net bir sinya
Volatility Master for MetaTrader is a real-time dashboard tool that scans up to  50 symbols  to identify high-volatility , trending markets instantly. With bullish/bearish signals, customizable alerts, and a user-friendly interface, it helps you avoid range-bound conditions and focus on high-probability trades. Clarity leads to confidence. Trade confidently and protect your capital effectively with this powerful dashboard. We don't offer free or bonus indicators in exchange of reviews from you.
Çoklu Para Birimi Güç ve Momentum Göstergesi MT5 Dynamic Forex28 Navigator, uzun süredir popüler olan göstergelerimizin gelişmiş halidir ve üç aracın gücünü tek bir araçta birleştirir: Advanced Currency Strength28 Indicator (700 değerlendirme) Advanced Currency IMPULSE with ALERT (530 değerlendirme) CS28 Combo Signals (güncel bonus) İki önceki gösterge MQL5 Market'te birlikte 1.200'den fazla değerlendirme aldı ve 2016'dan bu yana MT4 topluluğunun vazgeçilmez araçlarından biri. Dynamic Forex28 Na
AriFocus
Temirlan Kdyrkhan
AriFocus - Non-Repainting Buy/Sell Signals AriFocus - one clear signal. AriFocus marks buy and sell signals directly on the chart and suggests a stop-loss level for each one. Every signal is confirmed on bar close and never repaints. - Buy/sell arrows, confirmed on bar close - Suggested stop-loss level for every signal - Trend band and candle coloring to show direction at a glance - 10 ready-made presets, or your own settings (14 calculation methods) - Pop-up, push and email alerts with entr
Neuro Poseidon MT5
Daria Rezueva
4.68 (53)
Neuro Poseidon is a new indicator by Daria Rezueva. It combines precise trading signals with adaptive TP/SL levels - creating best possible trades as a result! Message me and get  Neuro Poseidon Assistant  as a gift to automize your trading process! What makes it stand out? 1. Proven profitability on all assets and timeframes 2. Only confirmed BUY and SELL signals present on the chart 3. Adaptive TP & SL levels generated by the software for each trade 4. Easy to understand - suitable for al
Protect against whipsaws: revolutionize your swing trading approach Swing Trading is the first indicator designed to detect swings in the direction of the trend and possible reversal swings. It uses the baseline swing trading approach, widely described in trading literature. The indicator studies several price and time vectors to track the aggregate trend direction and detects situations in which the market is oversold or overbought and ready to correct. [ Installation Guide | Update Guide | Tro
Azimuth Pro
Ottaviano De Cicco
5 (7)
Azimuth Pro V2: Synthetic Fractal Structure and Confirmed Entries for MT5 Overview Azimuth Pro is a multi-level swing structure indicator by Merkava Labs . Four nested swing layers, swing-anchored VWAP, ABC pattern detection, three-timeframe structural filtering, and closed-bar confirmed entries — one chart, one workflow from micro-swings to macro-cycles. This is not a blind signal product. It is a structure-first workflow for traders who care about location, context, and timing. Halloween P
SkyHammer Signal Pro Entry, SL ve TP seviyeleri kilitlenen profesyonel no-repaint trend sinyal indikatörü SkyHammer Signal Pro, net, sabit ve doğrulanabilir sinyaller isteyen yatırımcılar için tasarlanmış yapılandırılmış bir trend ve momentum sinyal indikatörüdür. En iyi M1 ve M5 gibi düşük zaman dilimlerinde çalışır. İndikatör piyasanın tepe veya dip noktalarını tahmin etmeye çalışmaz. Bunun yerine sinyal üretmeden önce onaylanmış piyasa yapısı, trend yönü, momentum gücü, sağlıklı volatilite ve
Advance AI Scanner
Mohamed Samsudeen
5 (1)
Advance AI Scanner is a multi-symbol analysis indicator for MetaTrader 5. It scans Forex pairs, metals, energy, stock indices and cryptocurrencies at the same time and rates each instrument with its own self-training model. It explains in plain English what moved each market and why, and it estimates how far upcoming economic news usually moves each symbol, measured on your broker's own price history. $199 instead of $499. 10 copies left at this price. One time purchase  Installation and User
DayTrader PRO
Davit Beridze
5 (4)
DayTrader PRO DayTrader PRO, John Ehlers'in Laguerre filtresini güçlü bir otomatik optimizasyon motoruyla birleştiren gelişmiş bir alım satım indikatörüdür. Sabit parametreler kullanmak yerine, indikatör yakın piyasa koşullarına göre en iyi ayarları otomatik olarak arar ve sürekli manuel ayarlamalar yapmadan değişen piyasa volatilitesine uyum sağlamanıza yardımcı olur. İndikatör, net ALIM (BUY) ve SATIM (SELL) sinyallerinin yanı sıra mevcut piyasa volatilitesinden hesaplanan adaptif Stop Loss ve
Bill Williams Advanced
Siarhei Vashchylka
5 (11)
Bill Williams Advanced is designed for automatic chart analysis using Bill Williams' "Profitunity" system. The indicator analyzes four timeframes at once. Manual (Be sure to read before purchasing) Advantages 1. Analyzes the chart using Bill Williams' "Profitunity" system. Signals are displayed in a table in the corner of the screen and on the price chart. 2. Finds all known AO and AC signals, as well as zone signals. Equipped with a trend filter based on the Alligator. 3. Finds "Divergence Bar
Apex Patterns PRO İndikatörü Satın Alın - Üzerine Kurulu Expert Advisor'a ÜCRETSİZ Sahip Olun. Kendini Optimize Eden Grafik Formasyonu ve Kırılım Zekası Geleneksel formasyon tarayıcıları sabit girdilere dayanır ve piyasa volatilitesi ile yapıları değiştiğinde genellikle düşük performans gösterir. Apex Patterns PRO, yapısal grafik formasyon tanımayı, momentum filtrelemeyi ve istatistiksel kendi kendini optimizasyonu tek bir analitik çerçevede birleştirerek değişen piyasa koşullarına uyum sağlama
Power Candles MT5
Daniel Stein
4.58 (12)
Power Candles V3 - Kendi Kendini Optimize Eden Güç Göstergesi Power Candles V3, döviz ve enstrüman gücünü, eklendiği her grafikte eyleme geçirilebilir bir ticaret planına dönüştürür. Sadece mumları renklendirmek yerine, arka planda canlı bir otomatik optimizasyon çalıştırır ve önünüzdeki sembol için en iyi Stop Loss, Take Profit ve sinyal eşiğini size sunar. Tek bir tıklama ile canlı ticarete uyarlanır - giriş, Stop Loss ve Take Profit ışınları grafikte tam fiyatlarla görünür ve uyarılar yön bil
Apollo SR Master , Destek/Direnç bölgelerinde alım satımı daha kolay ve güvenilir hale getiren özelliklere sahip bir Destek/Direnç göstergesidir. Gösterge, yerel fiyat zirvelerini ve diplerini tespit ederek Destek/Direnç bölgelerini herhangi bir gecikme olmadan gerçek zamanlı olarak hesaplar. Ardından, yeni oluşan Destek/Direnç bölgesini doğrulamak için, Destek/Direnç bölgesinin dikkate alınabileceğini ve gerçek bir SAT veya AL sinyali olarak kullanılabileceğini gösteren özel bir sinyal gösterir
Divergence Bomber
Ihor Otkydach
4.89 (94)
Bu göstergeyi satın alan herkese aşağıdaki ekstra içerikler ücretsiz olarak sunulmaktadır: Her işlemi otomatik olarak yöneten, Stop Loss ve Take Profit seviyelerini ayarlayan ve işlemleri strateji kurallarına göre kapatan özel yardımcı araç: "Bomber Utility" Göstergenin farklı varlıklar üzerinde kullanılmasına yönelik ayar dosyaları (set dosyaları) Bomber Utility için 3 farklı modda kullanım sunan ayar dosyaları: "Minimum Risk", "Dengeli Risk" ve "Bekle-Gör Stratejisi" Bu ticaret stratejisini
Superhero
Ihor Otkydach
5 (3)
SUPERHERO göstergesi, "her şeyi kapsayan" bir temele dayalı olarak tasarlanmış çoklu para birimli bir işlem sistemidir. Gösterge, piyasayı bağımsız olarak analiz eder ve işlemlerin ne zaman açılıp kapatılacağına dair sinyaller verir. Stop Loss ve Take Profit emirlerini kullanır. R:R oranı 1:1'dir. Bu sistem akıllı telefonunuza anlık bildirimler gönderebilir; böylece bir bilgisayara bağlı kalmanıza gerek kalmadan "hareket halindeyken" işlem yapabilirsiniz. Bu, özel ticaret şirketleri için idealdi
TREND ÇİZGİLERİ PRO     Piyasanın gerçek yön değişimini anlamaya yardımcı olur. Gösterge, gerçek trend dönüşlerini ve büyük oyuncuların piyasaya yeniden girdiği noktaları gösterir. Anlıyorsun     BOS hatları  Daha yüksek zaman dilimlerindeki trend değişiklikleri ve önemli seviyeler, karmaşık ayarlar veya gereksiz gürültü olmadan gösterilir. Sinyaller yeniden çizilmez ve çubuk kapandıktan sonra grafikte kalır. VERSION MT 4     -    RFI LEVELS PRO  göstergesiyle birlikte kullanıldığında maksimum p
Murrey Math Classic
Sarvarbek Abduvoxobov
5 (2)
Murrey Math Classic Murrey Math Classic , finansal piyasalardaki fiyat hareketlerini matematiksel bir kesinlikle tahmin etmek için tasarlanmış profesyonel ve dinamik bir ticaret (trading) indikatörüdür. Sistem, efsanevi fiyat-zaman geometrisini modernize ederek, günümüz finansal piyasalarına uygun, son derece yapılandırılmış bir matematiksel modele dönüştürür. Murrey Math'in arkasındaki temel mantık, finansal piyasaların rastgele hareket etmediği; belirli bir ritimle hareket ettiğidir. Müziğin b
Filtrele:
Değerlendirme yok
Değerlendirmeye yanıt