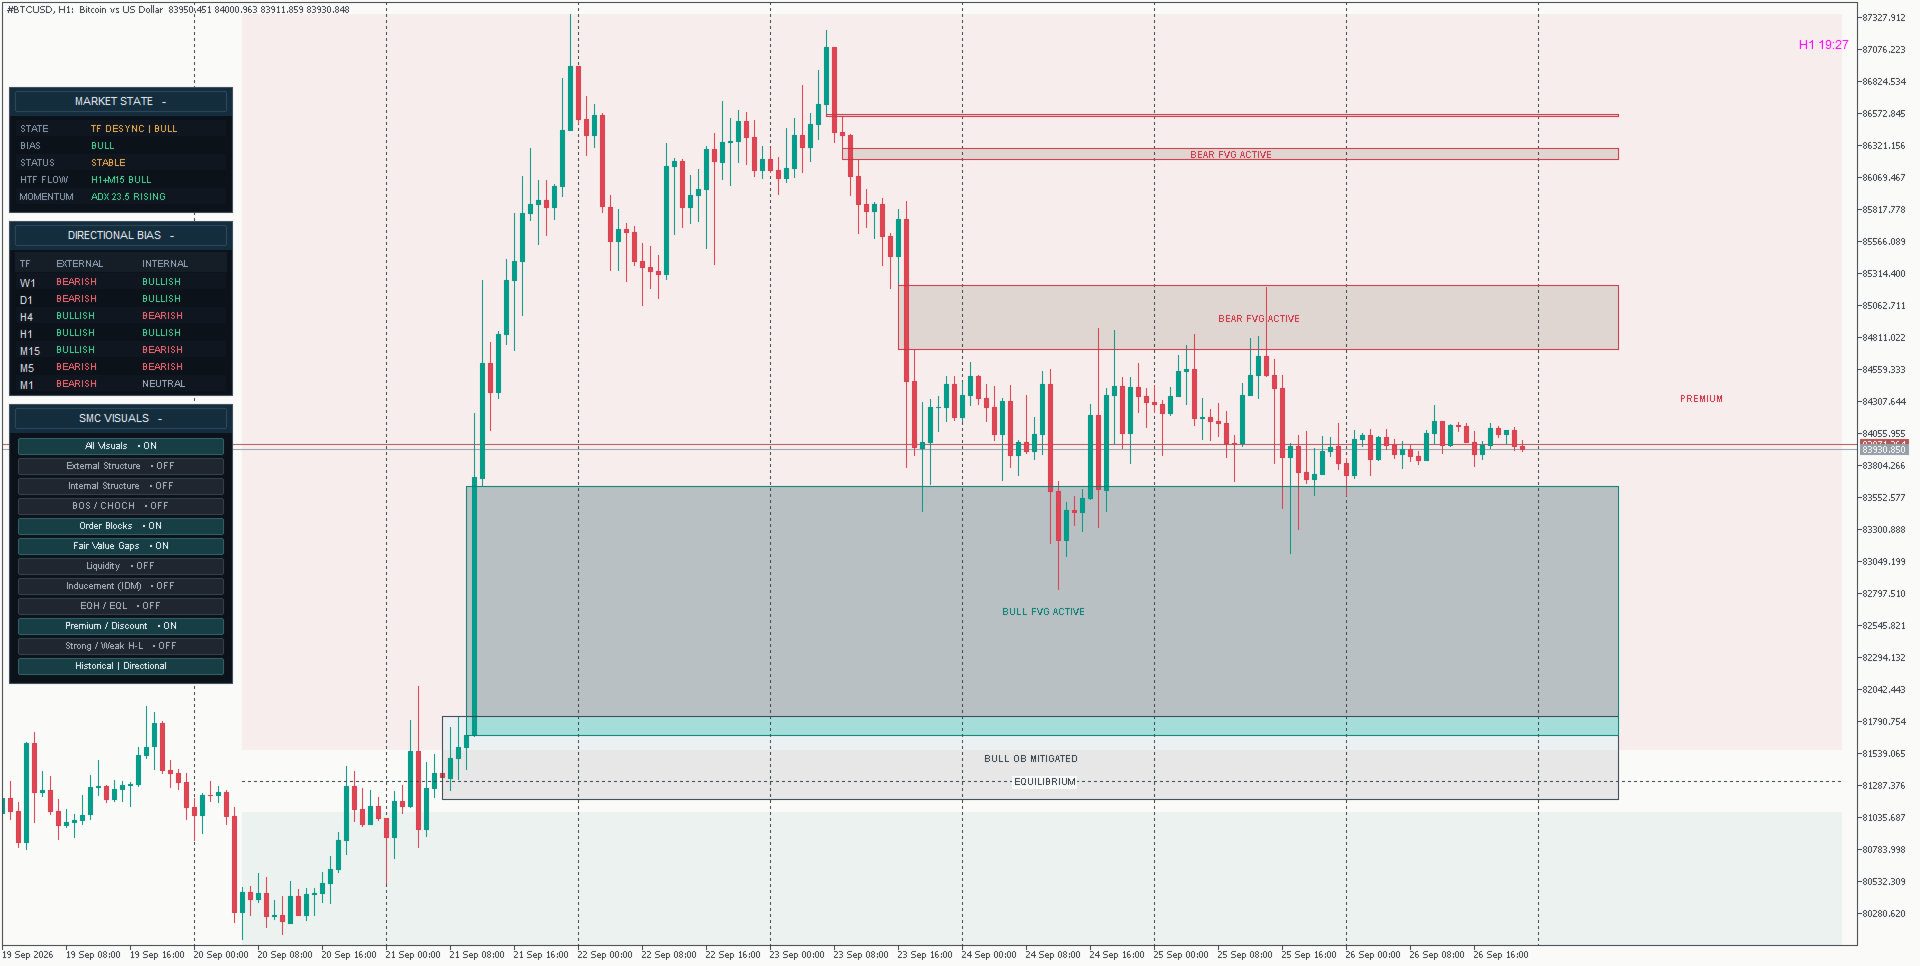
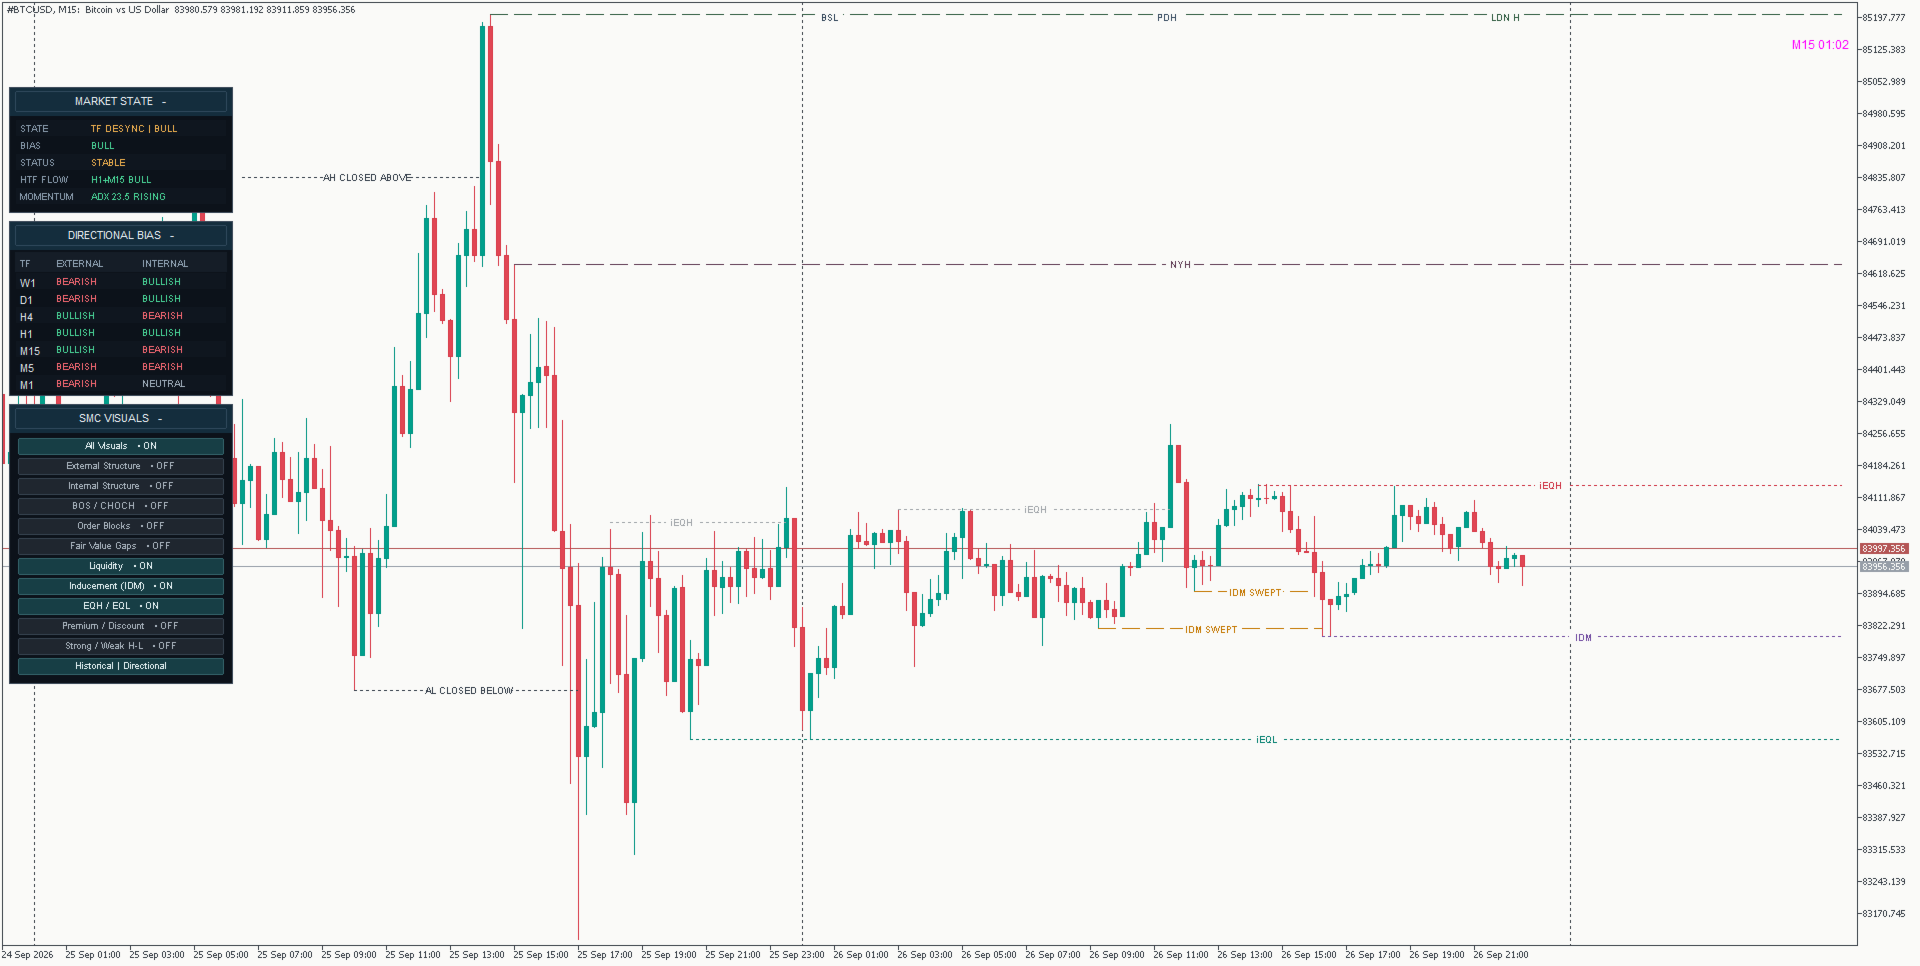
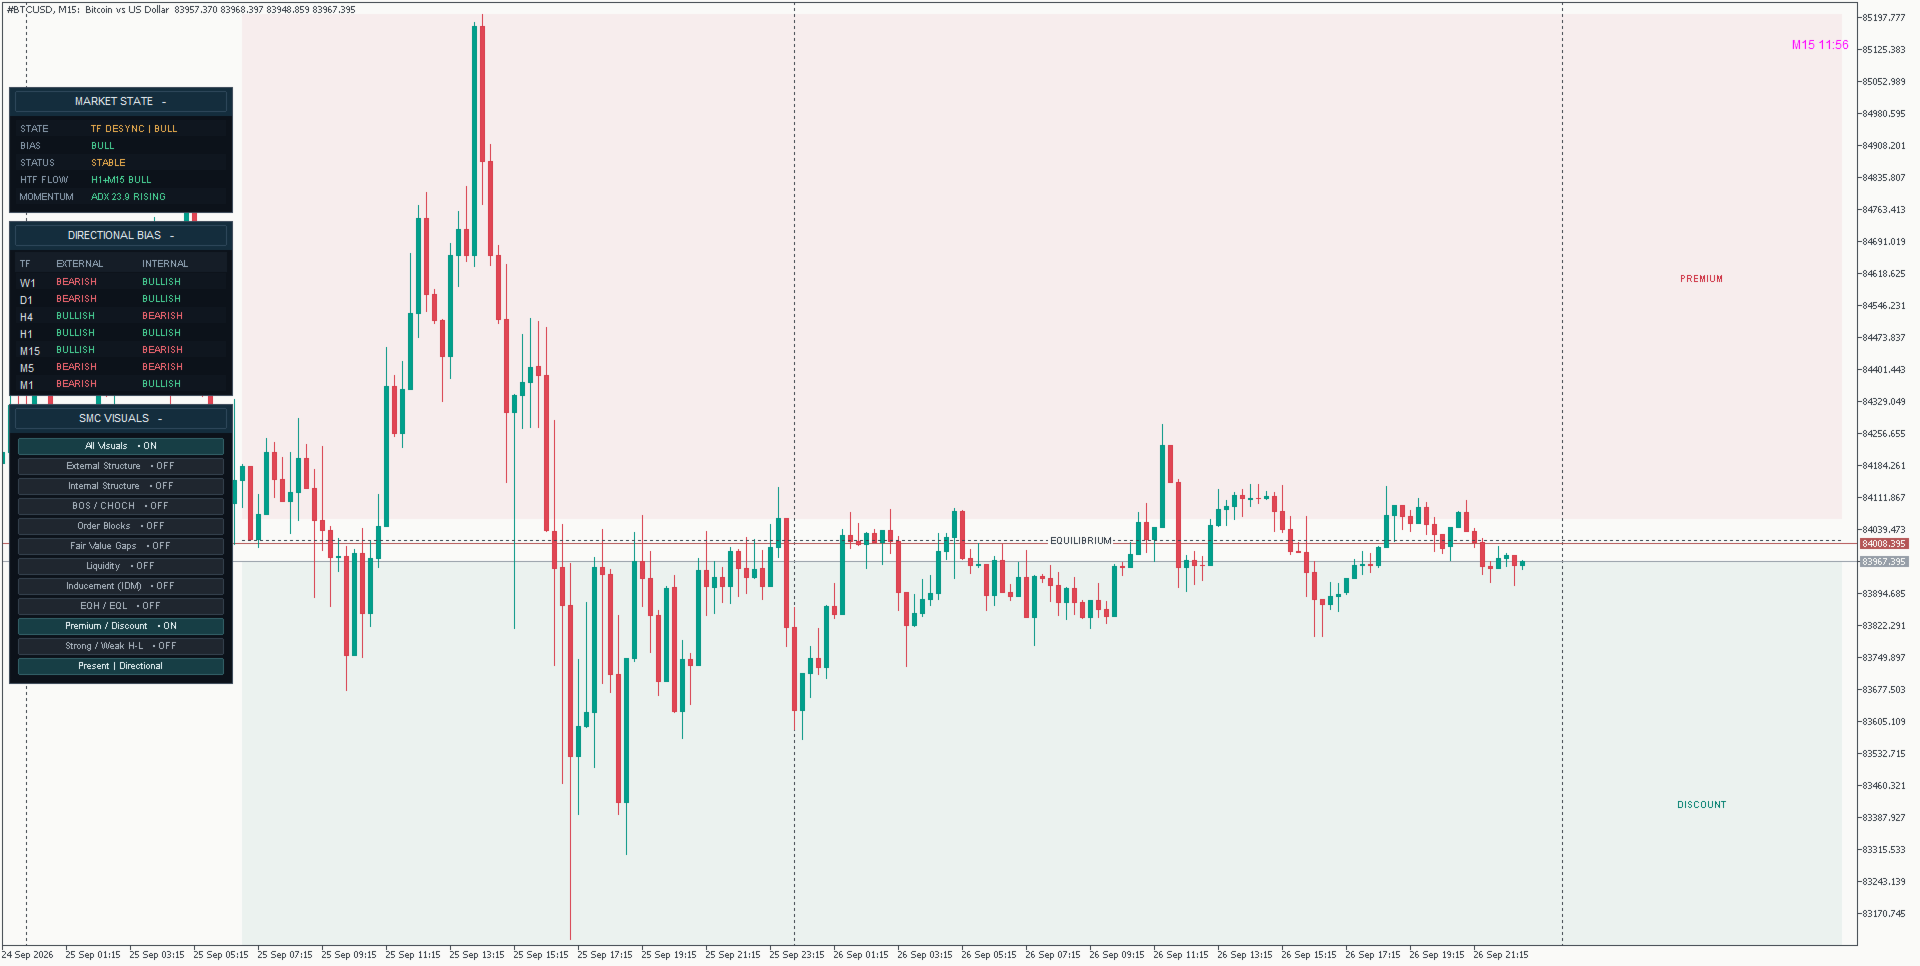
Market Structure Viewer

  • Indicateurs
  • Adari Manohar
    Adari Manohar
    • Self Employed à  Visakhapatnam, India
    • Inde
    • 185
    Forex trader and MQL5 developer focused on market structure, Smart Money Concepts, multi-timeframe analysis and automated trading systems. I build practical MetaTrader 5 tools that convert complex market analysis into structured visual and algorithmic workflows. My work includes market structure
  • Version: 1.30
  • Mise à jour: 26 septembre 2026
  • Activations: 5
MARKET STRUCTURE VIEWER FOR MT5

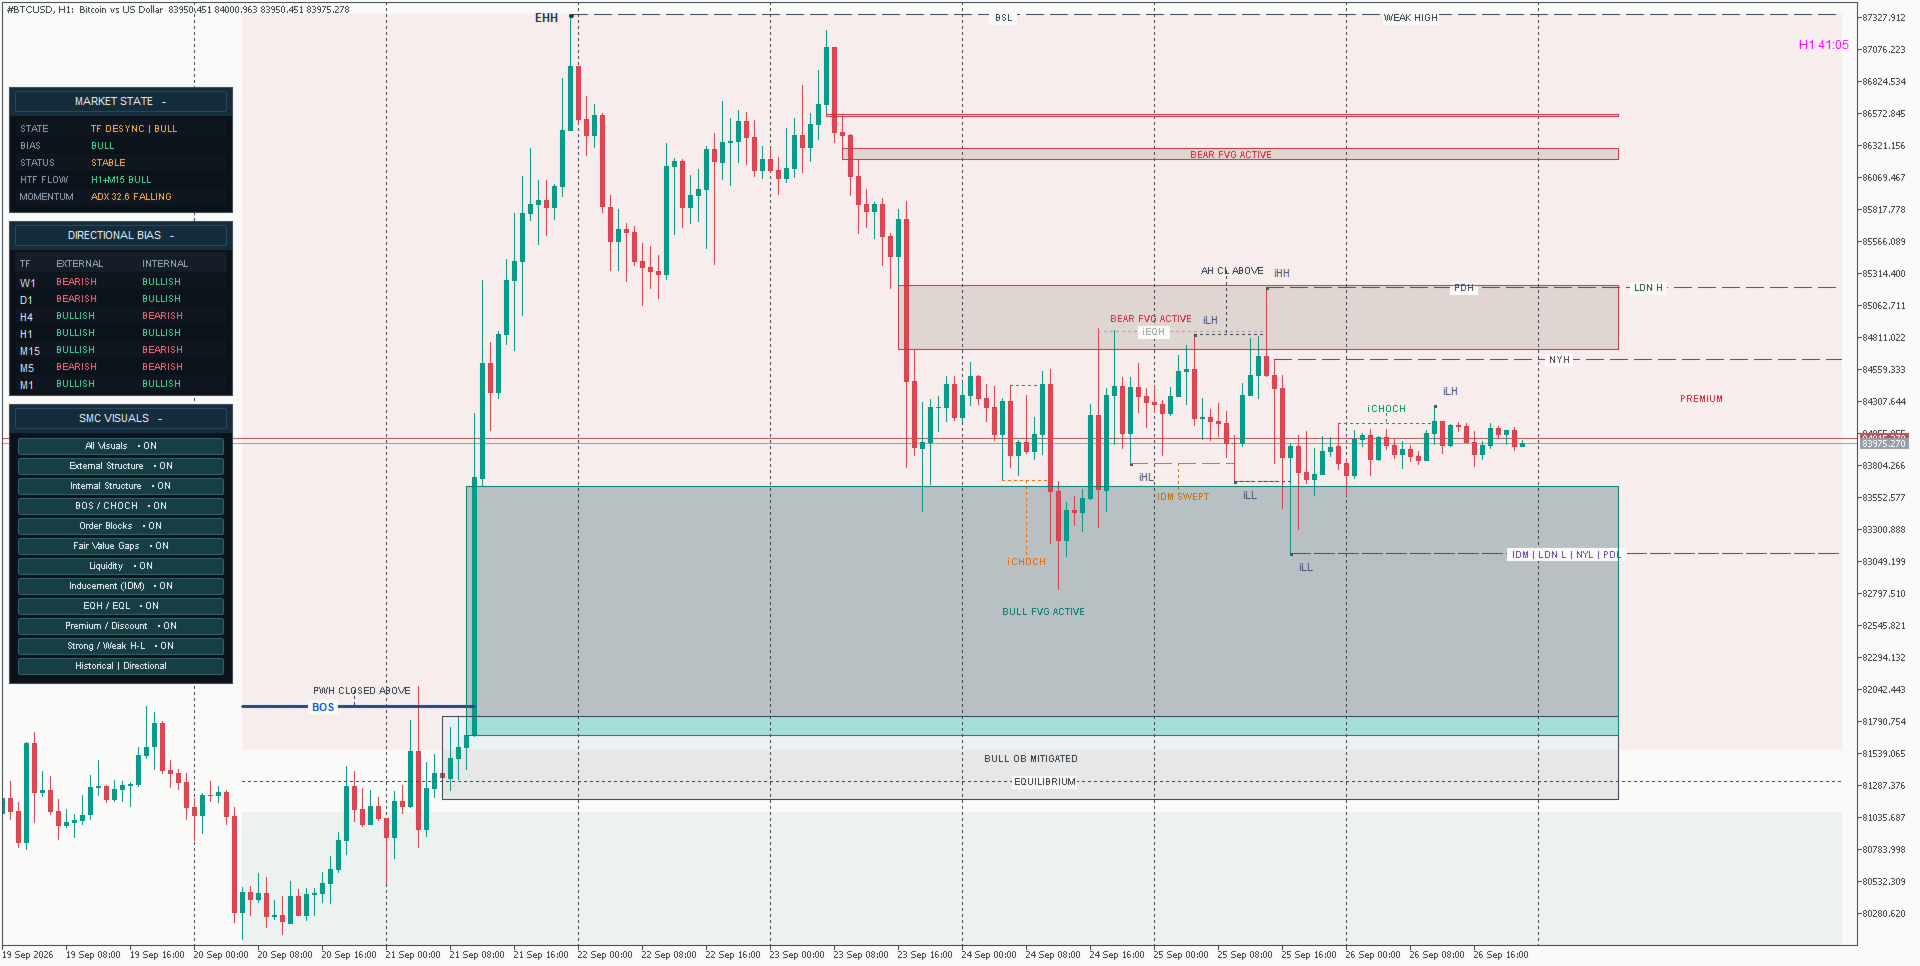
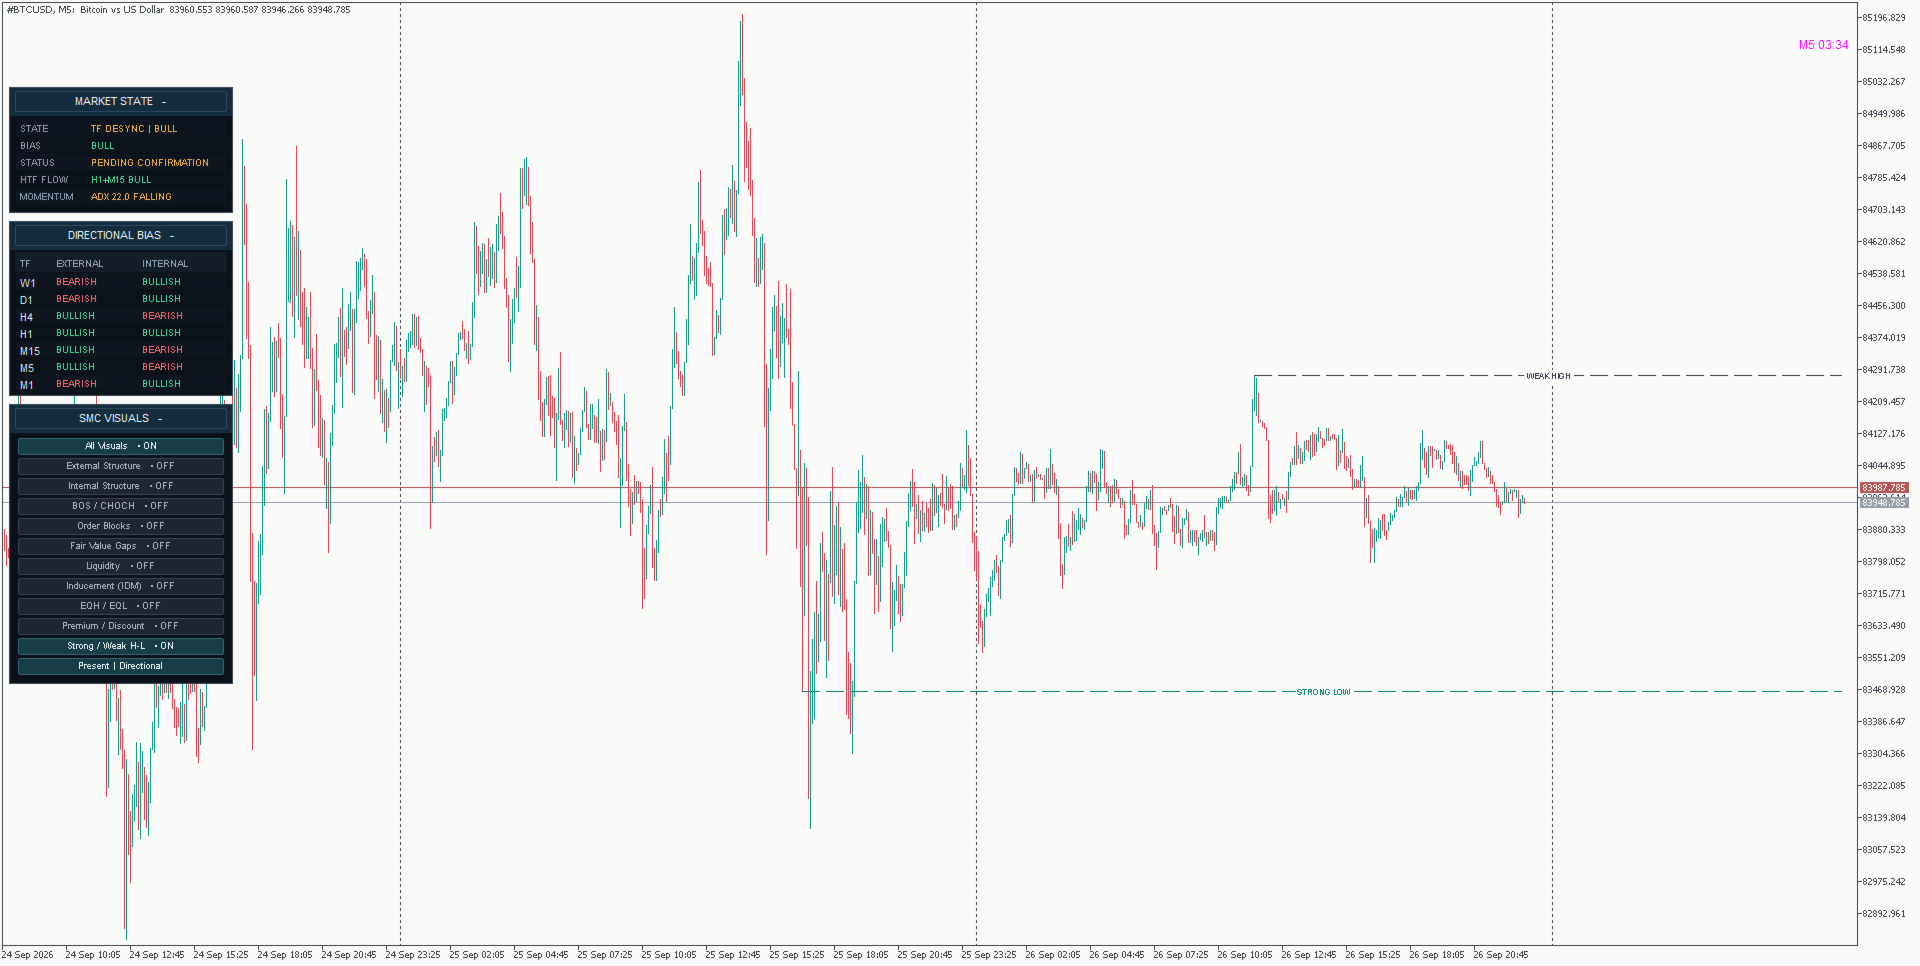
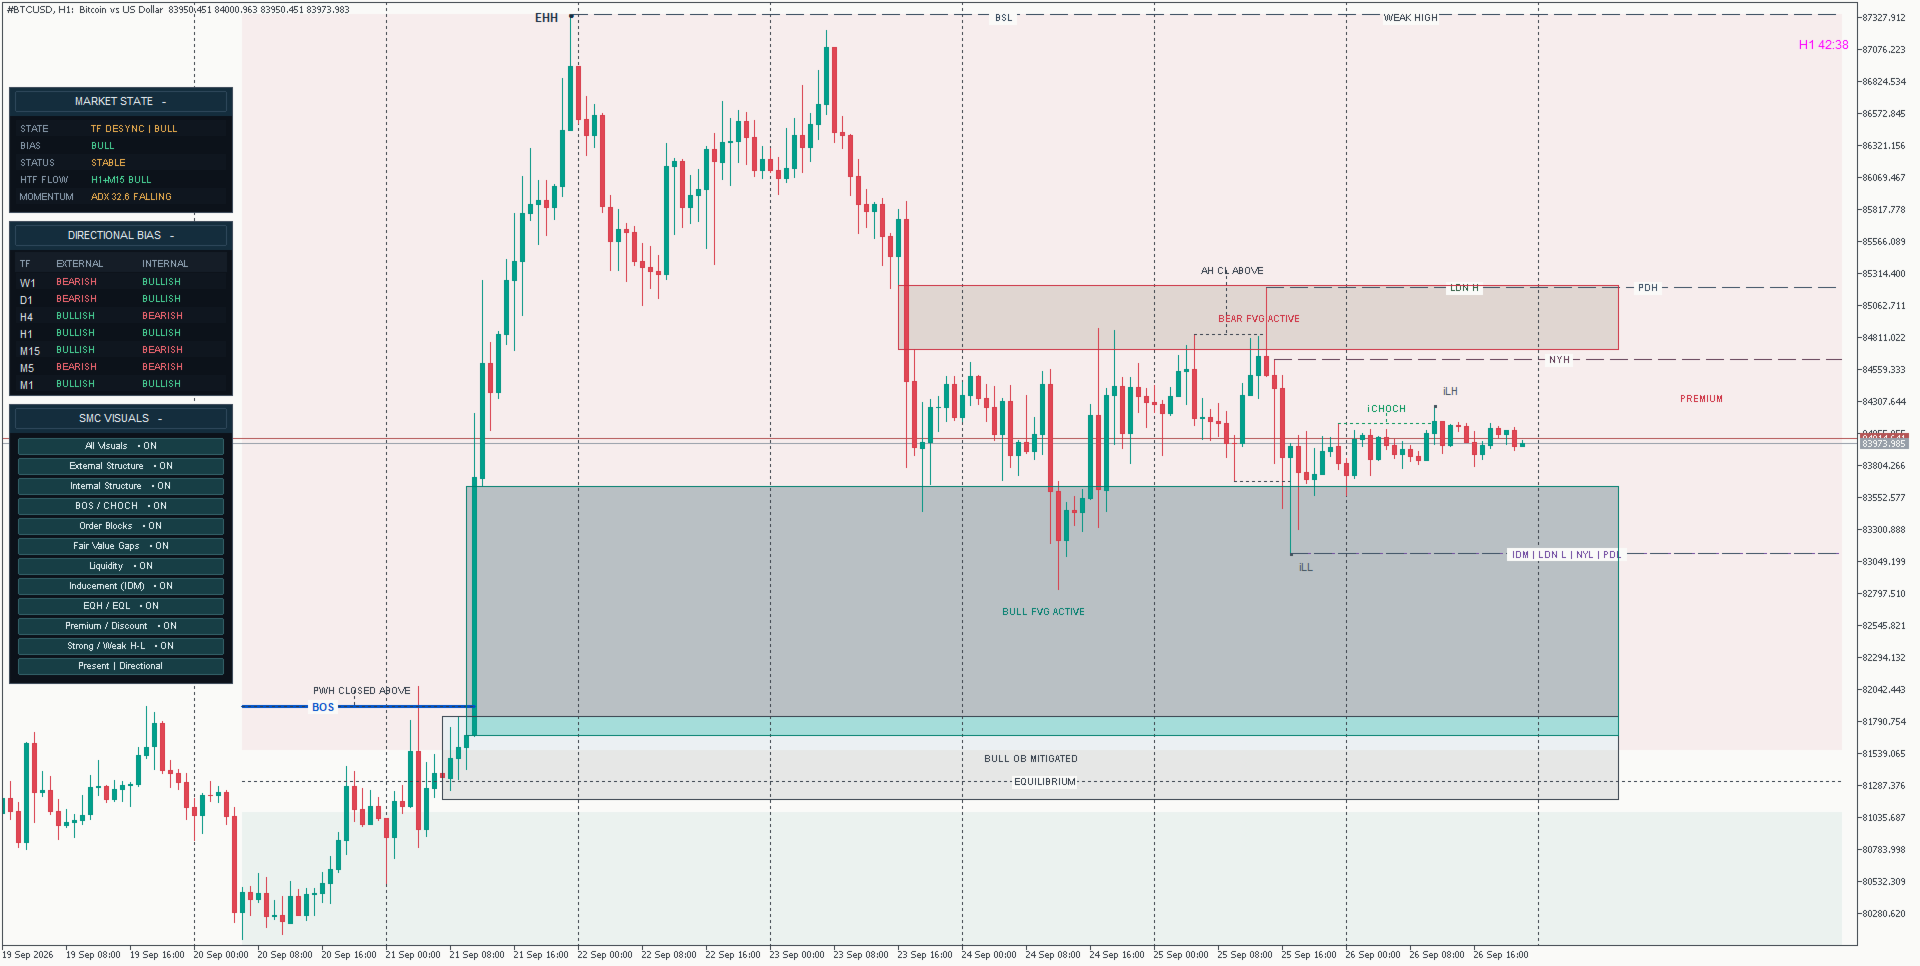
Market Structure Viewer is a multi-timeframe Smart Money Concepts (SMC) analysis workspace for MetaTrader 5.

Instead of displaying BOS, CHOCH, Order Blocks, Fair Value Gaps or liquidity as isolated chart elements, the indicator combines external and internal market structure, multi-timeframe directional bias, market-state context, liquidity, price zones and momentum into one structured workflow.

The objective is to help discretionary traders understand not only what structural event has occurred, but also where that event sits inside the broader market context.

Market Structure Viewer is an analysis and visualization tool only. It does not automatically open, modify or close trades.


## WHY MARKET STRUCTURE VIEWER IS DIFFERENT

Many SMC indicators focus mainly on drawing individual concepts such as BOS, CHOCH, Order Blocks and Fair Value Gaps.

Market Structure Viewer is designed around the relationship between those concepts.

For example, a bullish M1 BOS has a very different context when M15 and H1 are also bullish compared with the same M1 BOS appearing against bearish higher-timeframe structure.

The viewer therefore combines:

- Market structure
- Multi-timeframe directional bias
- Market state
- Liquidity
- Inducement
- Order Blocks
- Fair Value Gaps
- Premium / Discount positioning
- Higher-timeframe flow
- Momentum context

This provides a more complete view of the current market environment without requiring the trader to constantly switch between multiple charts.


## MULTI-TIMEFRAME DIRECTIONAL BIAS

The Directional Bias panel monitors both External and Internal market structure across:

- W1
- D1
- H4
- H1
- M15
- M5
- M1

External structure represents the broader directional structure of each timeframe, while internal structure shows the more recent movement developing inside that larger structure.

This makes it easier to identify:

- Higher-timeframe alignment
- Lower-timeframe pullbacks
- Counter-directional movement
- Possible structural transitions
- External and internal disagreement

A lower-timeframe bullish move does not automatically mean that the higher-timeframe structure has turned bullish.

The panel helps keep both layers visible at the same time.


## MARKET STATE PANEL

The Market State panel provides a compact summary of the current market environment.

Depending on current conditions, the viewer can classify the market into states such as:

- Strong Bull Trend
- Healthy Bull Trend
- Strong Bear Trend
- Healthy Bear Trend
- Early Expansion
- Decaying Chop
- Compression / Range
- Timeframe Desynchronization

The panel also displays:

BIAS
Current directional tendency.

STATUS
Current classification, trend condition or transition status.

HTF FLOW
Relationship between H1 and M15 structural direction.

MOMENTUM
M5 ADX value together with rising, falling or relatively flat momentum behaviour.

The Market State panel is designed as a context layer, not as an automatic entry signal.

The classification engine uses confirmation and transition logic to avoid treating every short-term change as a complete market-state reversal.


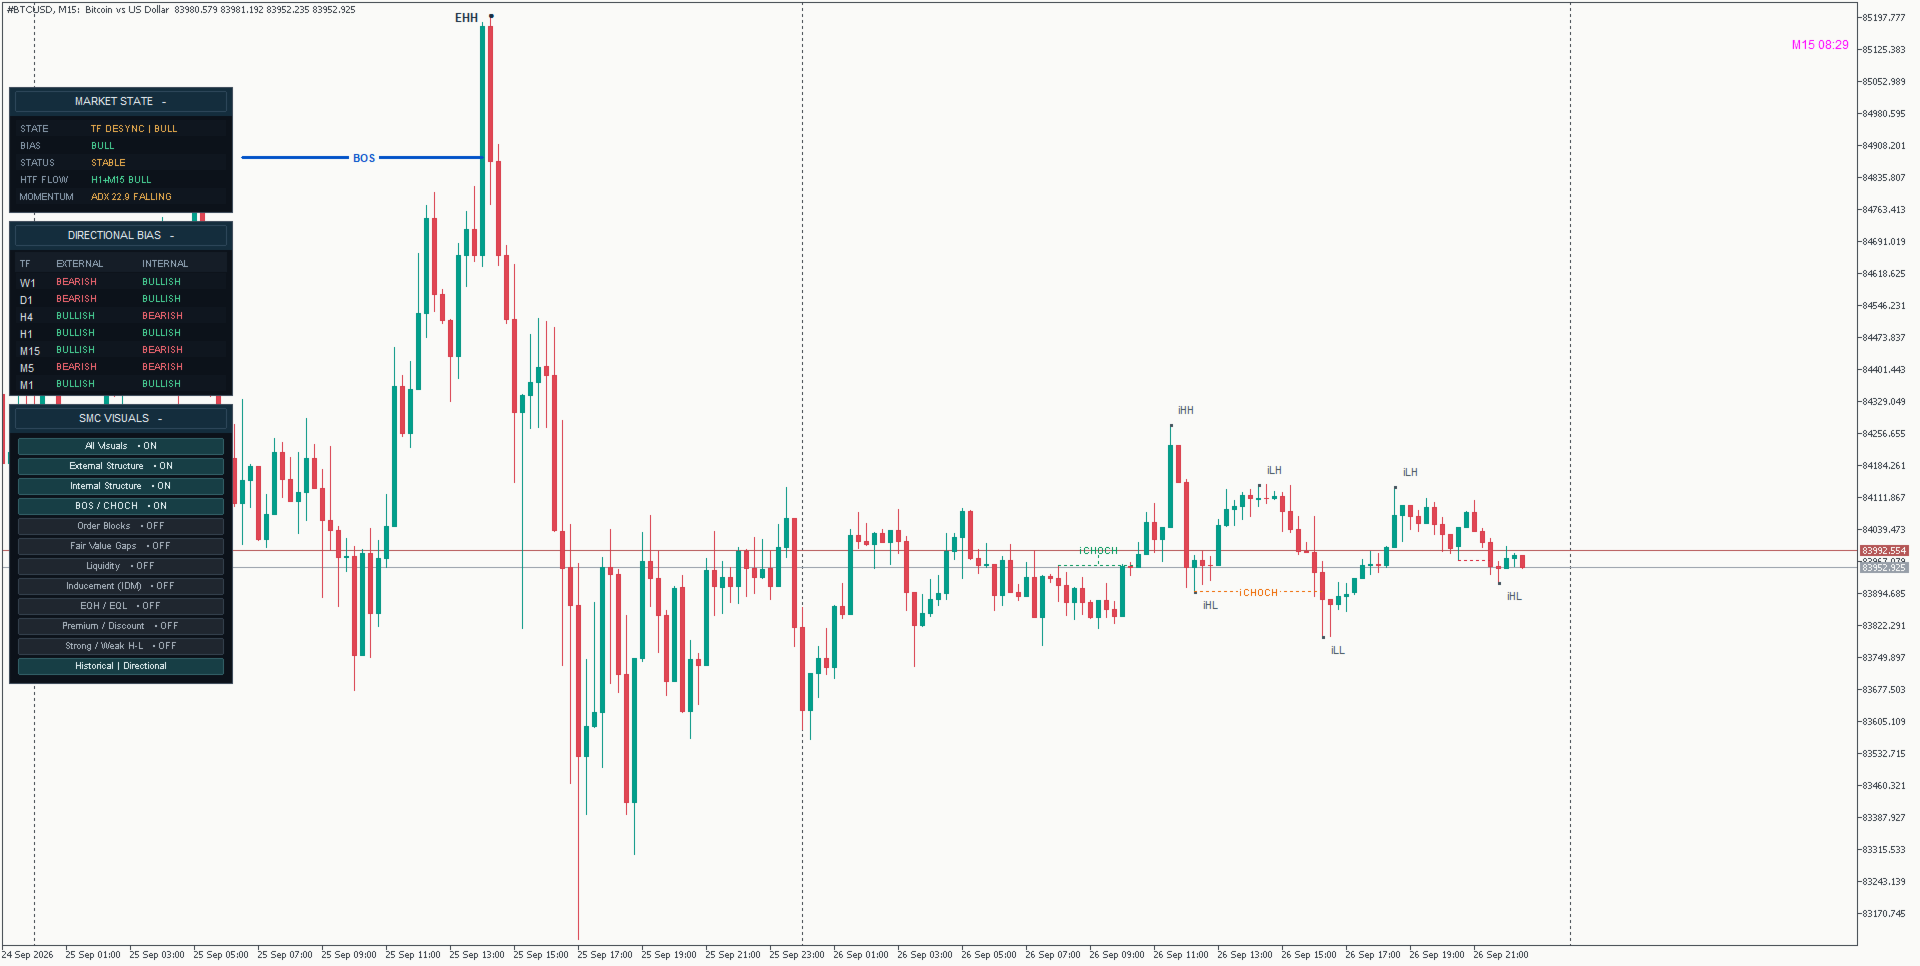
## EXTERNAL AND INTERNAL MARKET STRUCTURE

Market Structure Viewer separates broader external structure from faster internal structure.

This helps distinguish between:

- Structural continuation
- Internal corrections
- Pullbacks
- Potential directional transitions

The indicator displays:

- External structural highs and lows
- Internal structural highs and lows
- Bullish and bearish BOS
- Bullish and bearish CHOCH
- Internal BOS
- Internal CHOCH

A lower-timeframe CHOCH can therefore be viewed inside its higher-timeframe context instead of automatically being treated as a complete trend reversal.


## BOS AND CHOCH

Break of Structure (BOS) is used to identify confirmed continuation through an important structural level.

Change of Character (CHOCH) highlights a structural break that conflicts with the previous directional state and may indicate a transition.

External and internal structural events are tracked separately so that smaller internal changes do not automatically replace the broader structural view.

The structure engine is designed around confirmed price structure rather than unfinished intrabar movement.


## ORDER BLOCKS

The indicator identifies bullish and bearish Order Block areas associated with relevant price movement and structural context.

Instead of treating every opposite candle as an Order Block, the viewer focuses on zones connected with meaningful displacement and structure.

Order Blocks can be evaluated together with:

- Market direction
- Liquidity
- Fair Value Gaps
- Premium / Discount positioning
- Higher-timeframe bias

This helps the trader view each zone as part of the broader market structure rather than as an isolated signal.

Order Block states may update as price interacts with, mitigates or invalidates previously identified zones.


## FAIR VALUE GAPS

Market Structure Viewer detects bullish and bearish Fair Value Gaps created during directional displacement.

Fair Value Gaps can be used as potential areas of interest during retracements or continuation scenarios.

The value of an FVG depends on its context.

For example, a bullish Fair Value Gap located below current price during bullish structure has a different meaning from the same type of gap appearing against bearish higher-timeframe structure.

The viewer allows Fair Value Gaps to be analysed together with structural direction, liquidity and active price zones.

FVG states can update as price interacts with or fills previously identified gaps.


## LIQUIDITY MAPPING

The indicator highlights relevant liquidity levels and tracks how price interacts with them.

Liquidity references can include important structural highs and lows and other significant price levels.

The viewer can distinguish between active liquidity and levels that have already been interacted with.

Liquidity levels can also change state after being:

- Swept
- Broken
- Closed through

This helps prevent previously consumed liquidity from being interpreted in the same way as untouched liquidity.


## INDUCEMENT (IDM)

Inducement levels represent smaller internal structural references that may be targeted before price reaches a larger external objective.

IDM can provide additional context when analysing:

- Pullbacks
- Liquidity sweeps
- Internal structure
- External targets
- Order Blocks
- Fair Value Gaps

The indicator displays inducement separately from broader liquidity so that the trader can distinguish between different structural objectives.


## EQUAL HIGHS AND EQUAL LOWS

Equal Highs (EQH) and Equal Lows (EQL) identify areas where multiple swing points form around similar price levels.

These areas may represent concentrated liquidity.

The viewer marks these levels directly on the chart so they can be analysed together with:

- BOS / CHOCH
- External structure
- Internal structure
- Liquidity
- Order Blocks
- Fair Value Gaps

Previously formed equal levels can also reflect lifecycle changes after price sweeps or closes through them.


## PREMIUM, DISCOUNT AND EQUILIBRIUM

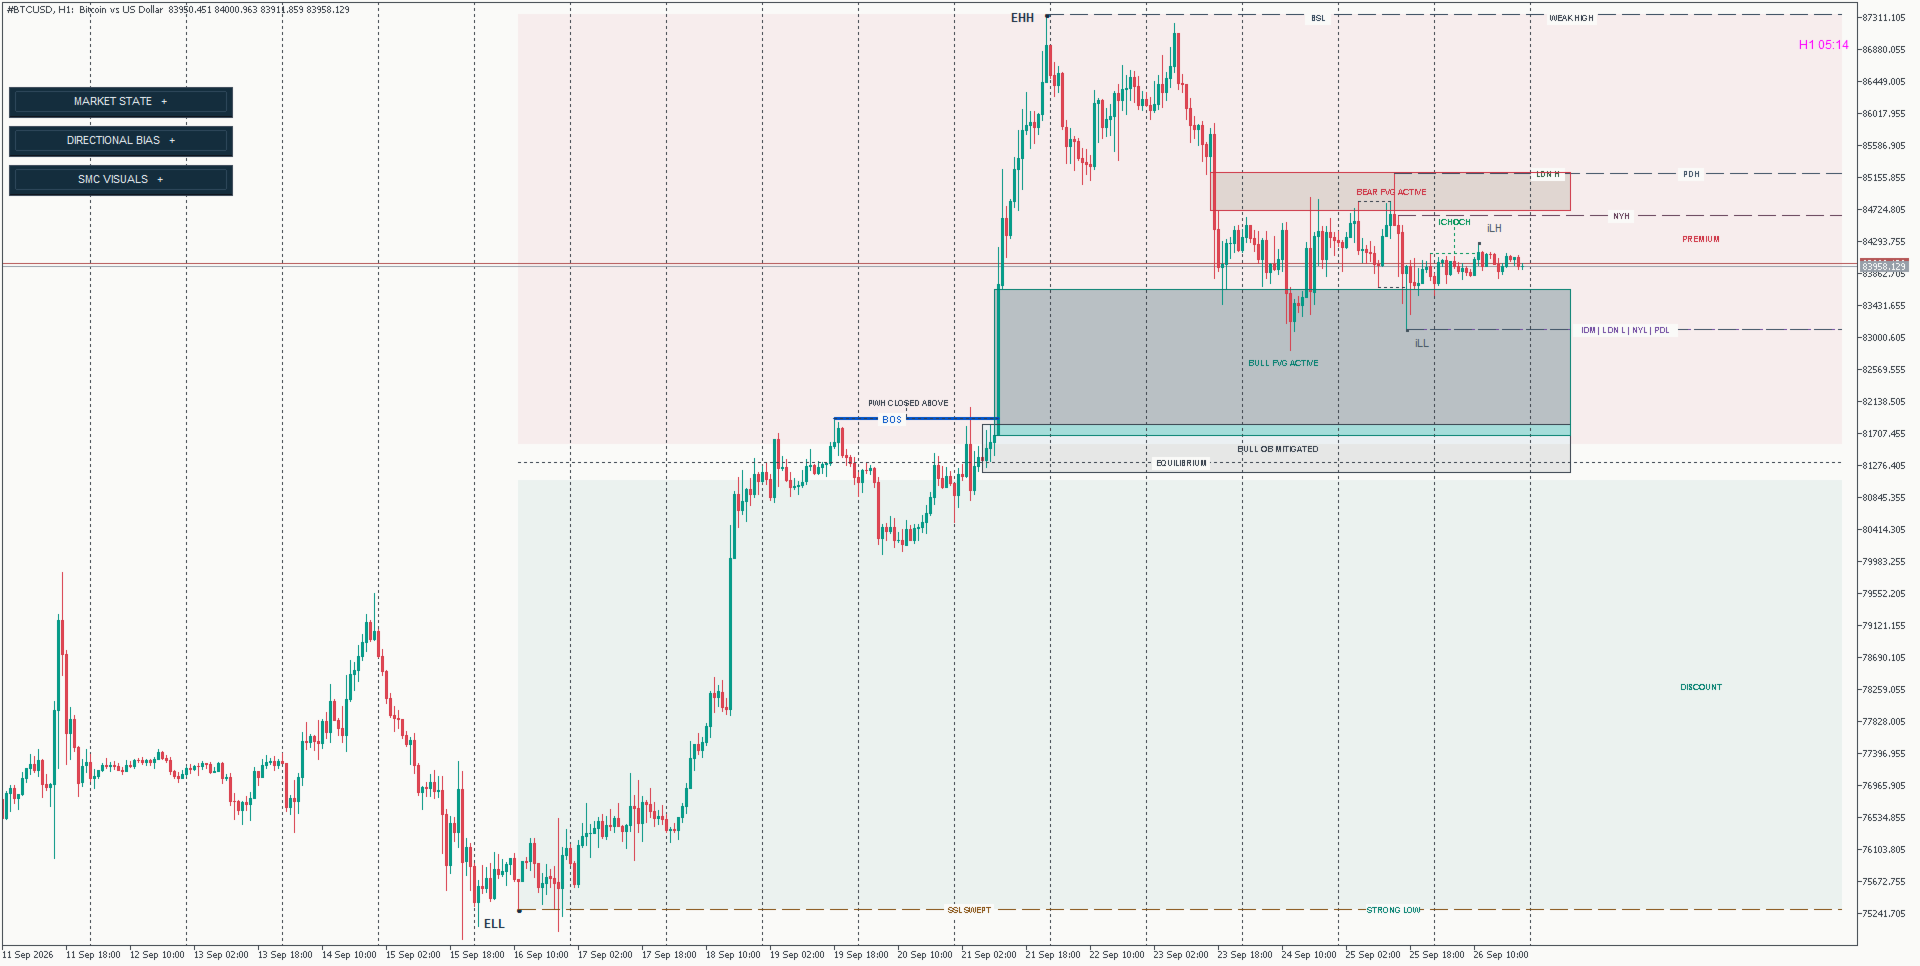
The active external structural range is divided into:

- Premium
- Equilibrium
- Discount

The midpoint of the current external structural range is used as Equilibrium.

The area above Equilibrium represents Premium, while the area below represents Discount.

These zones are contextual filters, not automatic trading signals.

For example:

A bullish Order Block or Fair Value Gap located in Discount during bullish structure may provide different context from the same zone positioned high in Premium.

Similarly, a bearish area of interest located in Premium may provide more relevant structural context during bearish conditions.


## STRONG AND WEAK HIGHS / LOWS

The viewer can also identify Strong and Weak structural highs and lows.

These levels provide additional information about the current structural range and possible directional objectives.

They can be displayed or hidden independently through the visual control panel.


## HIGHER-TIMEFRAME FLOW

Higher-timeframe flow provides a simplified view of the relationship between H1 and M15 structure.

The panel can display conditions such as:

- H1 + M15 Bull
- H1 + M15 Bear
- H1 / M15 Mixed

This helps quickly identify whether lower-timeframe analysis is aligned with or moving against the broader structural environment.


## MOMENTUM CONTEXT

The Market State panel includes M5 ADX information together with its recent slope.

Momentum can be displayed as:

- Rising
- Falling
- Flat

This provides additional context about whether directional strength is increasing, weakening or remaining relatively stable.

Momentum should be interpreted together with structure and market state rather than used as a standalone signal.


## INTERACTIVE SMC VISUAL CONTROLS

A major challenge with advanced SMC analysis is chart clutter.

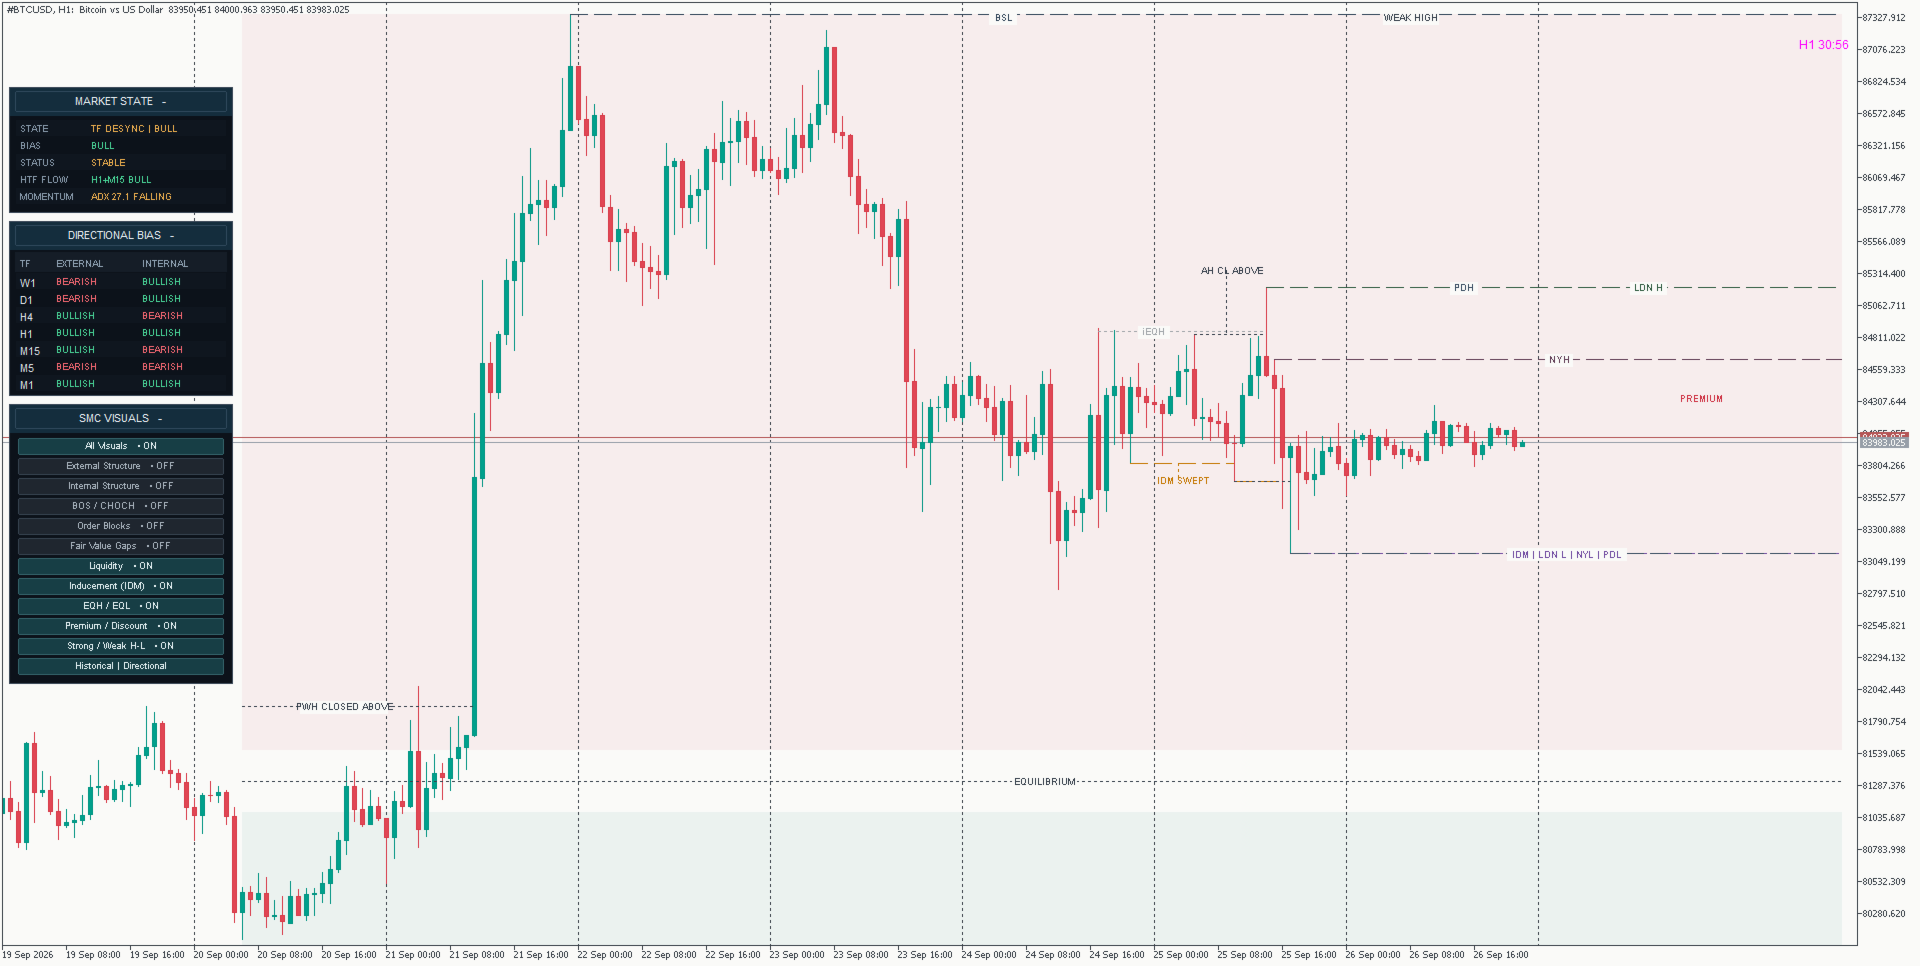
Market Structure Viewer includes an interactive control panel that allows analytical layers to be enabled or disabled individually.

Available visual controls include:

- All Visuals
- External Structure
- Internal Structure
- BOS / CHOCH
- Order Blocks
- Fair Value Gaps
- Liquidity
- Inducement (IDM)
- EQH / EQL
- Premium / Discount
- Strong / Weak Highs and Lows

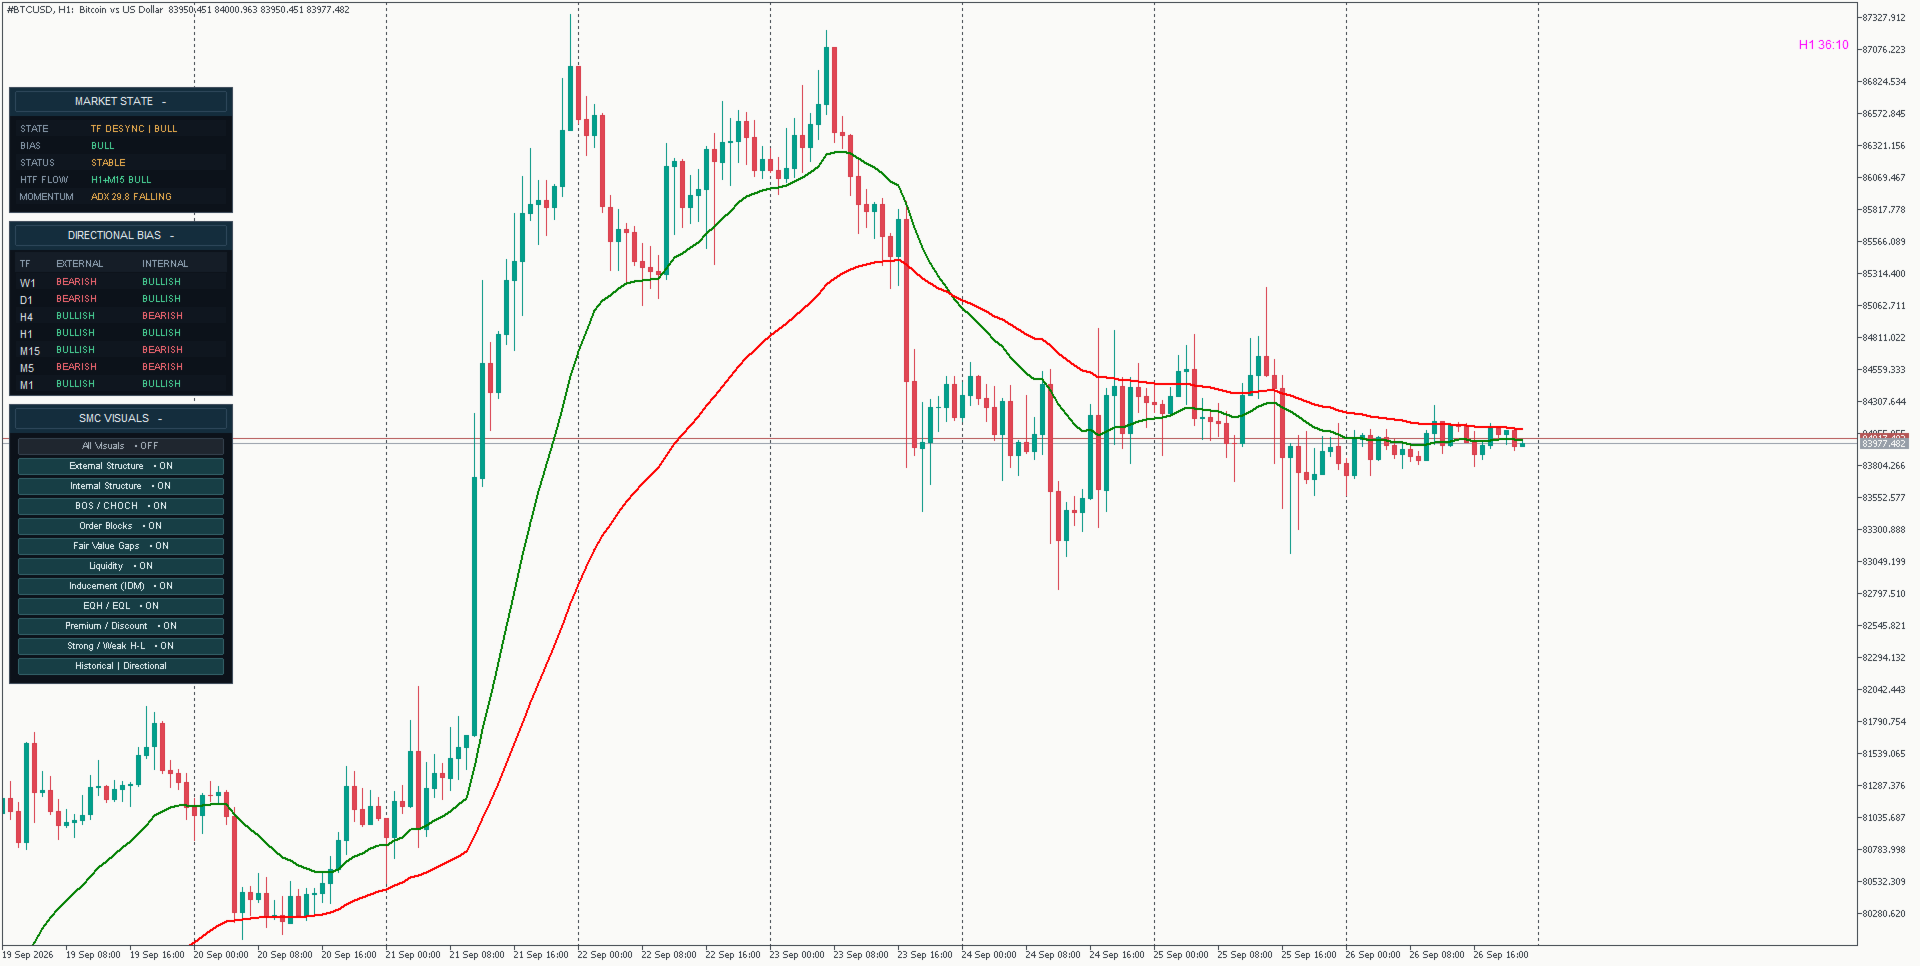
The All Visuals control acts as a master switch for chart overlays.

Turning All Visuals OFF temporarily hides the SMC chart drawings without changing the individual visual-layer selections.

When All Visuals is turned back ON, the previously selected visual settings are restored.

The Market State and Directional Bias panels operate independently from the All Visuals master control.

Individual layers can still be enabled or disabled separately according to the type of analysis currently being performed.

For example, a trader studying liquidity can temporarily hide Order Blocks and Fair Value Gaps and focus only on Liquidity, IDM and EQH/EQL.


## PRESENT AND HISTORICAL DISPLAY MODES

Market Structure Viewer provides two display modes for different types of analysis.


### PRESENT MODE

Present Mode focuses on the most recent and currently relevant market structure.

It reduces historical chart clutter by prioritizing the latest structural highs and lows, BOS/CHOCH events, active Order Blocks, Fair Value Gaps, liquidity references and other current SMC information.

This mode is useful when the main objective is analysing the current market environment.

Present Mode is designed to keep the chart cleaner while preserving the most relevant current structural context.


### HISTORICAL MODE

Historical Mode provides a broader view of previous market structure and structural events.

More historical structural highs and lows, BOS/CHOCH events, Order Blocks, Fair Value Gaps, liquidity references, inducement levels, EQH/EQL and other SMC information can be displayed.

When the chart is scrolled backward, the viewer adapts to the visible historical area and rebuilds relevant SMC information for that part of the chart.

This makes it possible to review previous structural development directly within historical price action.

Historical calculations are designed around the historical area being reviewed instead of simply projecting the latest market state backward across the chart.

This mode is useful for:

- Manual chart review
- Studying previous market behaviour
- Reviewing structural development
- Analysing previous BOS / CHOCH events
- Reviewing historical Order Blocks and Fair Value Gaps
- Studying liquidity interactions
- Comparing different market environments

Present and Historical modes change how chart information is displayed.

They do not change the underlying purpose of the Market State or Directional Bias panels.


## VISUAL THEMES

Different visual themes are available to improve chart readability.

These include:

- Institutional Neutral
- Monochrome
- Directional Color

Changing the visual theme does not change the analytical logic of the indicator.

It only changes how structural information is presented.


## COLLAPSIBLE PANELS

The Market State, Directional Bias and SMC Visuals panels can be collapsed when additional chart space is required.

This is especially useful on lower timeframes where price action develops quickly and screen space is important.

Collapsing a panel changes the interface layout only.

The underlying analytical engine can continue updating independently.


## HOW TO USE

1. Attach Market Structure Viewer to an MT5 chart.

2. Allow sufficient historical data to load for all required timeframes.

3. Begin with the Market State and Directional Bias panels to understand the broader market environment.

4. Review the external and internal structure of the current timeframe.

5. Use BOS and CHOCH to understand structural continuation or possible transition.

6. Analyse nearby liquidity, inducement, EQH/EQL, Order Blocks and Fair Value Gaps.

7. Check whether price is positioned in Premium, Discount or near Equilibrium.

8. Compare lower-timeframe events with higher-timeframe directional bias.

9. Use Present Mode for current-market analysis or Historical Mode when reviewing previous price action and structural development.

10. Use the All Visuals master control or individual visual-layer controls to keep the chart focused on the information required for the current analysis.

11. Make the final trading decision using your own strategy and risk-management rules.


## EXAMPLE 1: TREND ALIGNMENT

Suppose M1 prints a bullish BOS.

If M15 and H1 are also bullish and the market is trading from a relevant Discount area, the lower-timeframe bullish break is occurring in alignment with the broader market structure.

If M15 and H1 remain bearish, the same bullish M1 BOS may instead represent a lower-timeframe retracement.

The viewer helps expose this difference directly on the chart.


## EXAMPLE 2: LIQUIDITY AND PRICE ZONES

Suppose price sweeps an Equal Low and then reacts from a bullish Order Block or Fair Value Gap located in Discount.

The liquidity sweep, structural location and higher-timeframe bias can be evaluated together instead of treating the Order Block or FVG as an independent signal.

This is the main purpose of Market Structure Viewer: combining several structural elements into one coherent analytical framework.


## EXAMPLE 3: PRESENT VS HISTORICAL REVIEW

Suppose the trader is analysing the current H1 market structure.

Present Mode can be used to keep the chart focused on the most recent structural information and active areas of interest.

If the trader wants to study how the same market behaved several days earlier, Historical Mode can be selected and the chart can be scrolled backward.

The viewer then provides historical structural context around the area being reviewed.

This makes the two modes useful for different purposes without requiring separate indicators.


## WHO IS THIS INDICATOR FOR?

Market Structure Viewer may be useful for traders who use:

- Smart Money Concepts
- Market Structure
- BOS / CHOCH analysis
- Order Blocks
- Fair Value Gaps
- Liquidity concepts
- Multi-timeframe analysis
- Premium / Discount analysis
- Discretionary price-action trading

It is designed for traders who want a structured visual workspace rather than an automatic signal generator.


## IMPORTANT INFORMATION

Market Structure Viewer is a discretionary analysis tool.

It does not:

- Automatically open trades
- Automatically close trades
- Manage positions
- Guarantee profitable trades
- Predict future market movement
- Replace risk management

Market conditions can change and structural classifications may update as new candles close and new information becomes available.

Market State classifications, structural levels, liquidity states, Order Blocks, Fair Value Gaps and other displayed information can update as new confirmed market information becomes available.

Historical visualisation is intended for analysis and review. It should not be interpreted as a guarantee that historical market behaviour will repeat.

Results and displayed levels can vary slightly between brokers because of differences in price feeds and available historical data.

Sufficient historical data must be available for multi-timeframe calculations.

The final interpretation, entry decision, position sizing, stop loss, take profit and overall risk management remain the responsibility of the trader.


## FINAL NOTE

Market Structure Viewer is designed to reduce repetitive chart work and organize complex Smart Money Concepts into a clearer multi-timeframe framework.

Instead of switching constantly between charts and manually combining structure, liquidity, zones and directional bias, the indicator brings these elements together in one MT5 workspace.

The goal is simple:

More structured analysis.
Less chart clutter.
Better visibility of the market context.
Produits recommandés
Zic Zac De Midas
Job Israel Vargas Sarabia
ZIC ZAC DE MIDAS — Expert Advisor pour les indices américains ZIC ZAC DE MIDAS est un système de trading automatisé conçu spécifiquement pour le trading des indices américains (US500, US30, US100 et similaires). Il combine une logique de réentrée par paliers avec une gestion des risques à plusieurs niveaux afin de protéger votre capital en cas de conditions défavorables. Le robot est préconfiguré avec un ensemble optimisé pour le S&P 500, axé sur les transactions à faible capital (1 000 $)
Pare de seguir as "sardinhas" e comece a operar como big player, de forma automática. O robô Imbalance Autotrader é a mais recente tecnologia de trade que monitora os big players (grandes investidores) do mercado financeiro. Com estratégia de rompimento ( breakout ) ou pullback (Fair Value Gap FVG e Order Block) , você consegue configurar o robô para o ativo, conforme condições que você deseja operar. Além disso, o robô pode ter stops configuráveis, dinâmicos ou fixos. Na questão de gerenciamen
Win43 Scalper
Eadvisors Software Inc.
O novo s43 Scalper para Mini-Índice (WIN-IND) faz operações de curto prazo no timeframe 1min buscando pequenas variações do mercado, utiliza nova tecnologia de trade, os resultados no intraday são íncríveis, confira:      Após a instalação adicione no gráfico dos instrumentos win para visualizar os resultados no backteste. Recomendamos o timeframe de 1min.
Ranked Zone Trader
Attapong Pintasri
Ranked Zone Trader is an Expert Advisor for MetaTrader 5. It detects non-repainting fair value gap zones on closed bars, ranks active zones by strength, and waits for a retest before placing a trade. The EA is designed around price-zone retests rather than grid or recovery logic. Each trade uses a hard stop-loss and a fixed reward-to-risk target. Position size can be fixed or calculated from a risk percentage. Main features: - Closed-bar fair value gap zone detection - Strength ranking for ac

AI Forecast MT5
Leonardo Antonio Camacaro Armas
The "AI Forecast" indicator is the result of a unique experiment in which I asked an AI how to create the best indicator to anticipate the market. The AI suggested measuring the past history of the price and its reactions to different levels, and then calculating the probabilities of the price reaction in the future. With this idea, I designed with the help of another AI the "AI Forecast" indicator, which adapts to any MetaTrader chart and shows you three lines: one for entry and two for possi
Chart Patterns Builder Premium
Florea E. Sorin-Mihai Persoana Fizica Autorizata
The Chart Patterns Builder Premium expert advisor is an extension of the freely available Chart Patterns Builder Basic :         it provides 1 new chart pattern: the rectangle breakout (besides the double top & bottom pattern already provided in the basic edition);         in most configurations, backtesting usually shows more than double (2x) average yearly return rate;         the account growth curve is also smoother, due to approximately double number of trades,  compared to the free version
CRT Candle Range Theory HTF MT5 - Ultimate CRT Indicator : Concepts ICT avancés et système de trading Malaysian SnR Maîtrisez les traces des Market Makers avec l'indicateur Candle Range Theory le plus avancé. Libérez la véritable puissance des Smart Money Concepts (SMC) et tradez avec la même précision que les institutions grâce à l'Ultimate CRT Indicator. Conçu exclusivement pour les traders sérieux, cet indicateur automatise la théorie CRT, un pilier central des concepts ICT (Inner Circle Trad
Caicai L&S Yield Histogram Important Notice: This indicator is an integral tool of the automated EA Caicai Long and Short Pair Trading . This indicator visually displays the percentage deviation (Yield %) of a pair's current spread relative to its own historical mean. It is an excellent tool for quickly visualizing the gross financial potential of a market distortion in Long & Short operations. Main Features: Percentage Visualization: Understand the size of the distortion in palpable percentage
MiniFullIndexTrader
Francisco Eugenio Martoni M De Andrada
FA MiniFullIndexTrader: Scalper versátil para índices mini e completos Este Expert Advisor (EA) é uma estratégia de scalping automatizada para MetaTrader 5, otimizada para contratos de índice como WIN@, WINQ25, WINFUT e WIN$. Ele utiliza rompimentos diários para entradas rápidas, com gerenciamento de risco avançado para proteger o capital. Principais vantagens: Rentável e consistente: Em backtests, gera lucro líquido de até 14.310 pontos com fator de lucro de 1,44 e Sharpe 16,77 (alto retorno p
Overview The Market Perspective Structure Indicator is a comprehensive MetaTrader indicator designed to provide traders with a detailed analysis of market structure across multiple timeframes. It identifies and visualizes key price action elements, including swing highs and lows, Break of Structure (BOS), Change of Character (CHOCH), internal structures, equal highs/lows, premium/discount levels, previous levels from higher timeframes, and trading session zones. With extensive customization opt
PREngulfing
Slobodan Manovski
PR EA - Système de trading basé sur les motifs Engulfing Détection automatique des chandeliers Engulfing avec confirmation par moyenne mobile Le PR EA est un expert advisor pour MetaTrader 5 qui identifie et trade les motifs Engulfing haussiers/baissiers lorsqu'ils sont confirmés par un filtre de moyenne mobile. Optimisé pour le timeframe M30, compatible avec M15 et H1. Caractéristiques principales : Reconnaissance de motifs - Détecte les formations Engulfing valides Confirmation de tend
MarkerElliottWave is a panel for rapid and user-friendly manual markup of Elliott waves. One can select a color and a font of marks. There are also functions for removing the last markup and the entire markup made by the indicator. Markup is made in one click. Click five times - have five waves! MarkerElliottWave will be a great instrument both for beginners and professional analysts of Elliott waves.
INVI Hunting Gold
Niruban Chakravarthy R
INVI Hunting Gold is one of the straightforward tool to analysis the volatile market of Gold with demands precision, in-depth analysis, strong risk management and eliminating the need for constant market monitoring. INVI Hunting Gold will hunt the good trade position with precise risk management on all market conditions on Gold.  Hunting Gold  plug-and-play functionality means you can get started with minimal effort, Simply install me and let me handle the rest. We will diligently monitor the m
Tma Poc Gold
Ignacio Agustin Mene Franco
POC + TMA SCALPER GOLD - Expert Advisor Professional DESCRIPTION: Automated trading system designed specifically for XAU/USD, combining Point of Control (POC) with Triangular Moving Average (TMA) to identify high-volume and trending zones. It uses advanced risk management with dynamic trailing stops and an intelligent grid system. TECHNICA
Sparking Gold
Jethava Nileshbhai Pankajbhai
Métadonnées des onglets du navigateur Edge Remarque : L’onglet avec IsCurrent=true est l’onglet actuellement actif/affiché par l’utilisateur. Les onglets avec IsCurrent=false sont d’autres onglets ouverts en arrière‑plan. Données brutes des onglets ouverts edge_all_open_tabs = [ {"pageTitle":"<WebsiteContent_fGNiAt96suZWjo8jPLRqr></WebsiteContent_fGNiAt96suZWjo8jPLRqr>","pageUrl":"<WebsiteContent_fGNiAt96suZWjo8jPLRqr></WebsiteContent_fGNiAt96suZWjo8jPLRqr>","tabId":-1,"isCurrent":true}, {"pageT
TradeForge AlphaGain AI
Akshay Chunilal Patil
AlphaGain AI – Précision de niveau expert avec IA nouvelle génération AlphaGain AI est un Expert Advisor (EA) haut de gamme pour MetaTrader 5, alimenté par l’intelligence artificielle et plus de 10 ans de données historiques pour des signaux fiables et une gestion des risques avancée. Caractéristiques principales : Noyau IA : détecte les figures de chandeliers, zones de volatilité et impulsion du marché ; Entraîné sur 10+ années de données ; Stratégie intelligente d’entrée/sortie : SL/T
Harmonic Trader V4 Premium Professional Harmonic Pattern Trading System for MetaTrader 5 Overview Harmonic Trader V4 Premium is a fully automated trading system designed to identify and trade high-quality harmonic reversal structures. The robot continuously scans the market and evaluates pattern quality before opening any position. Unlike many pattern-based systems, Harmonic Trader does not trade every detected structure. Additional confirmation and filtering layers are applied before any order
My Trendline
Ashok Kumar Singha
My Trendline is an Indicator based on Upper and Lower Trendline which will Plot Automatically into the Chart. This Indicator will perfectly indicate you the Trend of the Market. It can be use in any Time Frame. The Indicator will automatically adjust according to the Current Time Frame. Steps to Setup the Indicator: Install the Custom Indicator; Set all the Inputs, Line Color, Width and Styles etc. (Can use the Default Setting also); Set visualization to All Timeframe; and DONE It can
Auto SL TP MT5
KEENBASE SOFTWARE SOLUTIONS
5 (2)
Auto SL TP place automatiquement des niveaux de Stop Loss et de Take Profit sur les positions ouvertes manuellement et les ordres en attente. Définissez une fois les distances de SL et de TP souhaitées, puis l'utilitaire les appliquera lorsqu'il détectera une opération correspondant à la portée choisie. Depuis un seul graphique, vous pouvez gérer le symbole actuel ou tous les symboles, choisir les positions, les ordres en attente ou les deux, et utiliser le trailing stop configurable lorsque cel
ProEngulfing For MT5
Ashkan Hazegh Nikrou
Version gratuite de ProEngulfing : QualifiedEngulfing, avec une limitation d'un signal par jour et des fonctionnalités réduites. Pour suivre les dernières actualités sur tous les produits Koala, rejoignez le canal Koala Trading Solution dans la communauté mql5 en cliquant sur le lien ci-dessous : https ://www .mql5 .com /en /channels /koalatradingsolution La version MT4 de ce produit est téléchargeable via le lien suivant : https ://www .mql5 .com /en /market /product /52023 Présentation de Pro
Babel Assistant
Iurii Bazhanov
4.33 (9)
Babel assistant 1 Le robot de compensation (netting) MT5 "Babel_assistant_1" utilise l'indicateur ZigZag pour générer des niveaux de Fibonacci sur les unités de temps M1, M5, M15, H1, H4, D1 et W1, et calcule la force des tendances d'achat et de vente. Il ouvre une position en utilisant le paramètre "Lot for open a position" si le niveau de tendance spécifié de 4,925 est dépassé. Ensuite, Babel place des ordres en attente à certains niveaux de Fibonacci et définit les lignes de Stop Loss et de T
FREE
Chỉ báo này sẽ thông báo cho bạn nếu cấu hình xu hướng thành công. Tín hiệu theo xu hướng không nên được tăng theo, nhưng tín hiệu mua ở mức giá thấp theo mô hình giao dịch thông thường của bạn, hoặc tín hiệu bán ở mức giá tốt, là một lựa chọn rất tốt. Hãy thiết lập nó trên khung thời gian lớn hơn và theo dõi các khung thời gian nhỏ hơn, bám sát các xu hướng chính. Tôi thường thiết lập ba khung thời gian gần nhau nhất và không bao giờ đi ngược tín hiệu của INdicator này. INdicator   này không có
TSO Bollinger Bandit Strategy is an indicator based on the Bollinger Bandit Trading Strategy as presented in the book Building Winning Trading Systems with TradeStation by G. Pruitt and J. R. Hill. SCANNER is included . Now with Scanner you can find trading opportunities and setups easily and faster.   Features A complete entry and exit strategy for trending markets. Get email / push notifications when an entry signal occurs. The indicator is not repainting. Can easily be used in an EA. (see Fo
Candle EA MT5
Mansour Babasafary
4.14 (22)
This expert is based on patterns The main patterns of this specialist are candlestick patterns Detects trends with candlestick patterns It has a profit limit and a loss limit, so it has a low risk The best time frame to use this expert is M30 time frame The best currency pairs to use with this expert is the EURUSD, GBPUSD, AUDUSD, USDCAD currency pairs Attributes: Can be used in the EURUSD, GBPUSD, AUDUSD, USDCAD  currency pairs Can be used in M30, H1, H4 time frames Has profit limit and loss
Gold Liquidity Master Pro H4
Oscar Dario Murillo Delgado
Gold Liquidity Master Pro is a high-precision algorithmic trading system designed exclusively for Gold (XAUUSD). Unlike conventional bots that use lagging indicators, this Expert Advisor (EA) operates based on Price Action and Institutional Liquidity Taking, identifying false breakouts on 4-hour (H4) candles where large banks typically "clean up" weak hands before a major move. Recommendations Symbol: XAUUSD (Gold) Timeframe: H4 Minimum Deposit: $500  Account Type: ECN / Raw Spread with low
SuperAgent v7.0 Diamond Pro - Quantitative Scoring & Dynamic Risk Description: SuperAgent v7.0 Diamond Pro is a high-fidelity MT5 adaptation of an advanced Python financial algorithm. This Expert Advisor (EA) combines a   Quantitative Scoring Engine   with   Dynamic Risk Management   to provide professional-grade portfolio management. Key Features: Multi-Layered Decision Engine:   Evaluates the market through three dimensions: Low-Lag Signal Processing, Trend Bias Confirmation, and Momentum Sco
SPECIAL LAUNCH OFFER: $30 (1-Month Rent) Limited time offer to build our community and gather feedback! AmbM GOLD Institutional Scalper A high-precision M5 algorithm for XAUUSD (Gold) , engineered to trade exclusively at Institutional Liquidity Levels ($5/$10 psychological marks). PERFORMANCE DATA (BUY ONLY) • Win Rate: 87.09%. • Safe Growth: +$4,113 profit on $10k (13.75% Max Drawdown). • Extreme Stress Test: Successfully generated +$22,997 in a 5-year stress test (2020-2026), proving
Unlock powerful breakout opportunities The 123 Pattern is one of the most popular, powerful and flexible chart patterns. The pattern is made up of three price points: a bottom, a peak or valley, and a Fibonacci retracement between 38.2% and 71.8%. A pattern is considered valid when the price breaks beyond the last peak or valley, moment at which the indicator plots an arrow, rises an alert, and the trade can be placed. [ Installation Guide | Update Guide | Troubleshooting | FAQ | All Products  ]
Gold Crazy EA MT5
Nguyen Nghiem Duy
Gold Crazy EA   is an Expert Advisor designed specifically for trading Gold H1/ EU M15. It use some indicators to find the good Entry. And you can set SL or you can DCA if you want. It can be an Scalping or an Grid/ Martingale depend yours setting. This EA can Auto lot by Balance, set risk per trade. You also can set TP/ SL for earch trade or for basket of trade. - RSI_PERIOD - if = -1, then the default strategy works, if >0, then the RSI strategy works - MAX_ORDERS - to trade with only 1 order,
Pivot Day Master is an automated, lightweight, and highly reliable technical analysis tool designed for MetaTrader 5. It automatically calculates and draws Daily Pivot Points, key Resistance and Support levels (R1-R3, S1-S3), as well as the Daily Open Price line directly on your chart. Whether you are a day trader, scalper, or swing trader, key Pivot levels serve as high-probability reaction zones for price action, breakouts, and trend reversals. Key Features: Automatic Daily Calculation: Automa
Les acheteurs de ce produit ont également acheté
SMART TREND TRADING SYSTEM — OFFRE SPÉCIALE Votre système de trading. Votre EA d’automatisation. Votre formation et votre accompagnement. Achetez Smart Trend Trading System pour MT5 à 99 USD et recevez Smart Universal Expert Advisor GRATUITEMENT pour automatiser ses signaux. STTS réunit la direction de la tendance, les signaux d’entrée et de sortie, les zones de retournement et les niveaux de prix importants directement sur votre graphique. Suivez le système manuellement ou connectez l’EA inclus
Trend Sniper X
Sarvarbek Abduvoxobov
4.9 (39)
Trend Sniper X est un indicateur de suivi de tendance multi-unités de temps pour MetaTrader 5 qui aide les traders à identifier la direction de la tendance et les points d'inversion potentiels avec clarté et précision. pour MT4: https://www.mql5.com/en/market/product/193245 Informations sur le prix : Le prix actuel est un prix promotionnel et est susceptible de changer lors des prochaines mises à jour et nouvelles fonctionnalités. Offre bonus : Pour obtenir GRATUITEMENT l'Auto-Trade Assistant E
Neuro Poseidon MT5
Daria Rezueva
4.75 (53)
Neuro Poseidon is a new indicator by Daria Rezueva. It combines precise trading signals with adaptive TP/SL levels - creating best possible trades as a result! Message me and get  Neuro Poseidon Assistant  as a gift to automize your trading process! What makes it stand out? 1. Proven profitability on all assets and timeframes 2. Only confirmed BUY and SELL signals present on the chart 3. Adaptive TP & SL levels generated by the software for each trade 4. Easy to understand - suitable for al
Gann Made Easy   est un système de trading Forex professionnel et facile à utiliser qui est basé sur les meilleurs principes de trading en utilisant la théorie de mr. WD Gann. L'indicateur fournit des signaux d'ACHAT et de VENTE précis, y compris les niveaux Stop Loss et Take Profit. Vous pouvez échanger même en déplacement en utilisant les notifications PUSH. VEUILLEZ ME CONTACTER APRÈS L'ACHAT POUR RECEVOIR GRATUITEMENT DES INSTRUCTIONS DE TRADING ET D'EXCELLENTS INDICATEURS SUPPLÉMENTAIRES! V
Unix Scalper
Issam Kassas
4 (4)
UNIX SCALPER — OFFRE SPÉCIALE Repérez la configuration. Consultez le plan. Choisissez comment intervenir. Achetez UNIX Scalper pour MT5 à 99 USD et recevez Smart Universal Expert Advisor GRATUITEMENT pour automatiser ses signaux. UNIX Scalper réunit l’analyse du marché, les décisions BUY/SELL/WAIT et les niveaux Entry, Stop Loss, TP1 et TP2 dans un panneau organisé. Suivez le plan de trading manuellement ou connectez l’EA inclus pour une exécution automatique selon vos paramètres. Le prix actuel
M1 Sniper MT5
Oleg Rodin
5 (7)
M1 SNIPER   est un système d'indicateurs de trading facile à utiliser. Il s'agit d'un indicateur à flèche conçu pour l'unité de temps M1. Cet indicateur peut être utilisé seul pour le scalping sur l'unité de temps M1 ou intégré à votre système de trading existant. Bien que conçu spécifiquement pour le trading sur l'unité de temps M1, ce système peut également être utilisé avec d'autres unités de temps. Initialement, j'avais conçu cette méthode pour le trading du XAUUSD et du BTCUSD. Cependant, j
La légende est de retour : Entry Points Pro 10. La relance de l'indicateur légendaire qui s'est maintenu 3 ans dans le Top-3 du MQL5 Market. Des centaines d'avis enthousiastes (589 sur les deux versions), des milliers de traders l'utilisent chaque jour, 31 000+ téléchargements de la démo   MT4+MT5 . J'ai lu chacun de vos avis publiés en cinq ans — et au lieu de promettre, j'ai intégré les réponses directement dans la version 10. Par un auteur présent sur les marchés depuis 1999, qui tient à l'ho
Welcome to ENTRY IN THE ZONE AND SMC MULTI TIMEFRAME Entry In The Zone and SMC Multi Timeframe is a real-time market analysis tool based on Smart Money Concepts (SMC), designed to analyze market structure, price direction, and key trading zones. It supports both Single-Timeframe Analysis and Multi-Timeframe Analysis, providing a clearer view of the overall market structure across multiple timeframes, with real-time BUY / SELL signals that do not repaint. It is designed to help filter trading opp
Adaptive Price Action Engine Achetez un indicateur, obtenez l'EA gratuitement Analyse auto-optimisée des tendances et des figures de chandeliers Multi-Timeframe Les marchés évoluent constamment, et tous les modèles de Price Action n’ont pas la même valeur dans toutes les conditions de marché. Adaptive Price Action Engine a été conçu pour s’adapter aux changements du marché en combinant structure de tendance, analyse Multi-Timeframe, figures de chandeliers et optimisation statistique au sein d’un
Currency Strength Wizard   est un indicateur très puissant qui vous offre une solution tout-en-un pour un trading réussi. L'indicateur calcule la puissance de telle ou telle paire de devises en utilisant les données de toutes les devises sur plusieurs périodes. Ces données sont représentées sous la forme d'un indice de devise facile à utiliser et de lignes électriques de devise que vous pouvez utiliser pour voir la puissance de telle ou telle devise. Tout ce dont vous avez besoin est d'attacher
Atomic Analyst MT5
Issam Kassas
4.45 (58)
ATOMIC ANALYST — OFFRE SPÉCIALE Votre analyse de marché. Votre EA d’automatisation. Votre formation et votre accompagnement. Achetez Atomic Analyst pour MT5 à 99 USD et recevez Smart Universal Expert Advisor GRATUITEMENT pour automatiser ses signaux. Atomic Analyst réunit l’action des prix, la direction de la tendance, les signaux d’entrée et de sortie, le Stop Loss et plusieurs niveaux de Take Profit directement sur votre graphique. Tradez manuellement à l’aide de son analyse ou connectez l’EA
Divergence Bomber
Ihor Otkydach
4.89 (94)
Chaque acheteur de cet indicateur reçoit également gratuitement : L’outil exclusif « Bomber Utility », qui accompagne automatiquement chaque opération de trading, fixe les niveaux de Stop Loss et de Take Profit, et clôture les positions selon les règles de la stratégie Des fichiers de configuration (set files) pour adapter l’indicateur à différents actifs Des set files pour configurer le Bomber Utility selon différents modes : « Risque Minimum », « Risque Équilibré » et « Stratégie d’Attente »
Superhero
Ihor Otkydach
5 (3)
L'indicateur SUPERHERO est un système de trading multidevises conçu selon un principe « tout compris ». Cet indicateur analyse le marché de manière autonome et fournit des signaux indiquant quand ouvrir et clôturer des positions. Il utilise des ordres Stop Loss et Take Profit. Le rapport R:R est de 1:1. Ce système peut envoyer des notifications push sur votre smartphone, ce qui vous permet de passer des ordres « où que vous soyez », sans avoir à rester devant un ordinateur. C'est la solution idé
Volatility Master for MetaTrader is a real-time dashboard tool that scans up to  50 symbols  to identify high-volatility , trending markets instantly. With bullish/bearish signals, customizable alerts, and a user-friendly interface, it helps you avoid range-bound conditions and focus on high-probability trades. Clarity leads to confidence. Trade confidently and protect your capital effectively with this powerful dashboard. We don't offer free or bonus indicators in exchange of reviews from you.
Power Candles MT5
Daniel Stein
4.58 (12)
Power Candles V3 - Indicateur de force à optimisation automatique Power Candles V3 transforme la force des devises et des instruments en un plan de trading exploitable sur chaque graphique auquel il est associé. Au lieu de se contenter de colorer les bougies, il effectue une optimisation automatique en temps réel en arrière-plan et vous fournit les meilleurs niveaux de Stop Loss, Take Profit et seuils de signal pour le symbole que vous avez sous les yeux. Un simple clic suffit pour l'adopter en
IQ FX Gann Levels a precision trading indicator based on W.D. Gann’s square root methods . It plots real-time, non-repainting support and resistance levels to help traders confidently spot intraday and scalping opportunities with high accuracy. William Delbert Gann (W.D. Gann) was an exceptional market analyst, whose trading technique was based on a complex blend of mathematics, geometry, astrology, and ancient mathematics which proved to be extremely accurate. We don't offer free or bonus indic
RelicusRoad Pro MT5
Relicus LLC
4.96 (24)
RelicusRoad Pro : Système d'Exploitation Quantitatif du Marché 70% DE RÉDUCTION ACCÈS À VIE (DURÉE LIMITÉE) - REJOIGNEZ 2 000+ TRADERS Pourquoi la plupart des traders échouent-ils même avec des indicateurs "parfaits" ? Parce qu'ils tradent des concepts isolés dans le vide. Un signal sans contexte est un pari. Pour gagner, il faut de la CONFLUENCE . RelicusRoad Pro est un Écosystème Quantitatif complet . Il cartographie la "Fair Value Road", distinguant le bruit des cassures structurelles. Arrête
First time on MetaTrader, introducing IQ Star Lines - an original Vedic Astrology based indicator. "Millionaires don't use astrology, billionaires do" . - J.P. Morgan, Legendary American financier and banker. We don't offer free or bonus indicators in exchange of reviews from you. You won't need any free products with this indicator to make it work. ;) Enjoy! Welcome to  the new and updated  IQ Star Lines , the ultimate fusion of ancient planetary harmonic cycles and modern quantitative trading.
L'indicateur UZFX {SSS} Scalping Smart Signals v5.0 MT5 est un indicateur de trading haute performance sans « repaint », conçu pour les scalpers, les day traders et les swing traders qui recherchent des signaux précis et en temps réel sur des marchés très volatils. Développé par (UZFX-LABS), cet indicateur combine l'analyse de l'action des cours, la confirmation des tendances et un filtrage intelligent pour générer des signaux d'achat et de vente à forte probabilité, des signaux d'alerte et des
PZ Trend Trading MT5
PZ TRADING SLU
3.8 (5)
Capture every opportunity: your go-to indicator for profitable trend trading Trend Trading is an indicator designed to profit as much as possible from trends taking place in the market, by timing pullbacks and breakouts. It finds trading opportunities by analyzing what the price is doing during established trends. [ Installation Guide | Update Guide | Troubleshooting | FAQ | All Products ] Trade financial markets with confidence and efficiency Profit from established trends without getting whips
M1 Quantum MT5
Hamed Dehgani
4.2 (10)
Signaux de Trading en Direct avec M1 Quantum : Signal   (L’opération est exécutée automatiquement par le Quantum Trade Assistant , inclus gratuitement avec ce produit.) Dernières nouvelles : La version 1.64 a été publiée. Toutes les transactions disposent désormais d’un Stop Loss placé derrière les zones de support/résistance correspondantes. La fonction Smart Close a également été améliorée afin d’augmenter les performances de l’EA dans cette version. Depuis le 9 août, le signal en direct fonc
Scalper Vault   est un système de scalpage professionnel qui vous fournit tout ce dont vous avez besoin pour un scalpage réussi. Cet indicateur est un système de trading complet qui peut être utilisé par les traders de forex et d'options binaires. Le délai recommandé est M5. Le système vous fournit des signaux fléchés précis dans le sens de la tendance. Il vous fournit également des signaux supérieurs et inférieurs et des niveaux de marché Gann. Les indicateurs fournissent tous les types d'alert
Shock Pullback
Suleiman Alhawamdah
5 (1)
Tout simplement, vous pouvez commencer à trader lorsque le mouvement des chiffres blancs — appelés « pips » — commence à apparaître à côté de la bougie actuelle. Les « pips » blancs indiquent qu’un ordre d’achat ou de vente est actuellement actif et évolue dans la bonne direction, comme le montre leur couleur blanche. Lorsque le mouvement des pips blancs s’arrête et devient vert statique, cela signale la fin de la dynamique en cours. La couleur verte des chiffres représente le profit total réal
Volume Profile Multiple — Profils de Volume Multiples avec Buffers pour le Trading Algorithmique Fatigué de redessiner le Volume Profile bloc par bloc, en devant tout recalculer à chaque changement de timeframe ? Volume Profile Multiple trace automatiquement plusieurs profils de volume consécutifs sur le graphique, révélant où l'intérêt institutionnel s'est réellement concentré dans chaque section du marché — et pas seulement sur la dernière plage visible. Ce que l'indicateur fait pour vous L'in
Azimuth Pro
Ottaviano De Cicco
5 (7)
Azimuth Pro V2: Synthetic Fractal Structure and Confirmed Entries for MT5 Overview Azimuth Pro is a multi-level swing structure indicator by Merkava Labs . Four nested swing layers, swing-anchored VWAP, ABC pattern detection, three-timeframe structural filtering, and closed-bar confirmed entries — one chart, one workflow from micro-swings to macro-cycles. This is not a blind signal product. It is a structure-first workflow for traders who care about location, context, and timing. ️ Summer Sale
Crystal Heikin Ashi Signals
Muhammad Jawad Shabir
5 (4)
Crystal Heikin Ashi Signals - Professional Trend & Signal Detection Indicator Advanced Heikin Ashi Visualization with Intelligent Signal System for Manual & Automated Trading Final Price: $149 ---------> Price goes up $10 after every 10 sales . Limited slots available — act fast . Overview Crystal Heikin Ashi Signals is a professional-grade MetaTrader 5 indicator that combines pure Heikin Ashi candle visualization with an advanced momentum-shift detection system. Designed for both manual traders
Presenting one-of-a-kind Gann Indicator for XAUUSD IQ Gold Gann Levels is a non-repainting, precision tool designed exclusively for XAUUSD intraday trading. It uses W.D. Gann’s square root method to plot real-time support and resistance levels, helping traders spot high-probability entries with confidence and clarity. William Delbert Gann (W.D. Gann) was an exceptional market analyst whose trading technique was based on a complex blend of mathematics, geometry, astrology, and ancient calculation
The SyntheticaFX Scalper Pro Indicator is a versatile and user-friendly tool designed to assist traders in identifying high-accuracy entry points across multiple timeframes and all currency pairs. This indicator provides clear visual signals on the chart, along with recommended Stop Loss (SL) and Take Profit (TP) levels, making it easier for traders to plan their trades with confidence. With its built-in dashboard, the SyntheticaFX Scalper Pro Indicator offers real-time trade statistics, helpin
Hydra Trend Rider   is a premium multi-timeframe dashboard that instantly reveals the market trend across 9 timeframes (M1 to Monthly). Using a highly accurate, non-repainting AI-Powered algorithm, it helps you trade in the direction of the dominant market momentum. We don't offer free or bonus indicators in exchange of reviews from you. You won't need any free products with this indicator to make it work. ;) Enjoy! User Manual: Here MT4 Version: Here MQL5 Channel - For daily market insight
Currency Strength Anchor – force relative adaptée aux sessions, ancrée sur les ouvertures quotidienne, hebdomadaire et mensuelle. Sans repaint. La plupart des indicateurs de force comparent les instruments sur une période fixe. Le sens du résultat change au fur et à mesure que la journée de trading passe d’une session à l’autre : un classement basé sur les données de la session asiatique dit peu de choses une fois que Londres et New York sont ouverts. Currency Strength Anchor utilise une référe
Filtrer:
Aucun avis
Répondre à l'avis