Market Structure Viewer
- 指标
-
Adari Manohar
 Forex trader and MQL5 developer focused on market structure, Smart Money Concepts, multi-timeframe analysis and automated trading systems. I build practical MetaTrader 5 tools that convert complex market analysis into structured visual and algorithmic workflows. My work includes market structure
 - 版本: 1.28
- 更新: 24 九月 2026
- 激活: 5
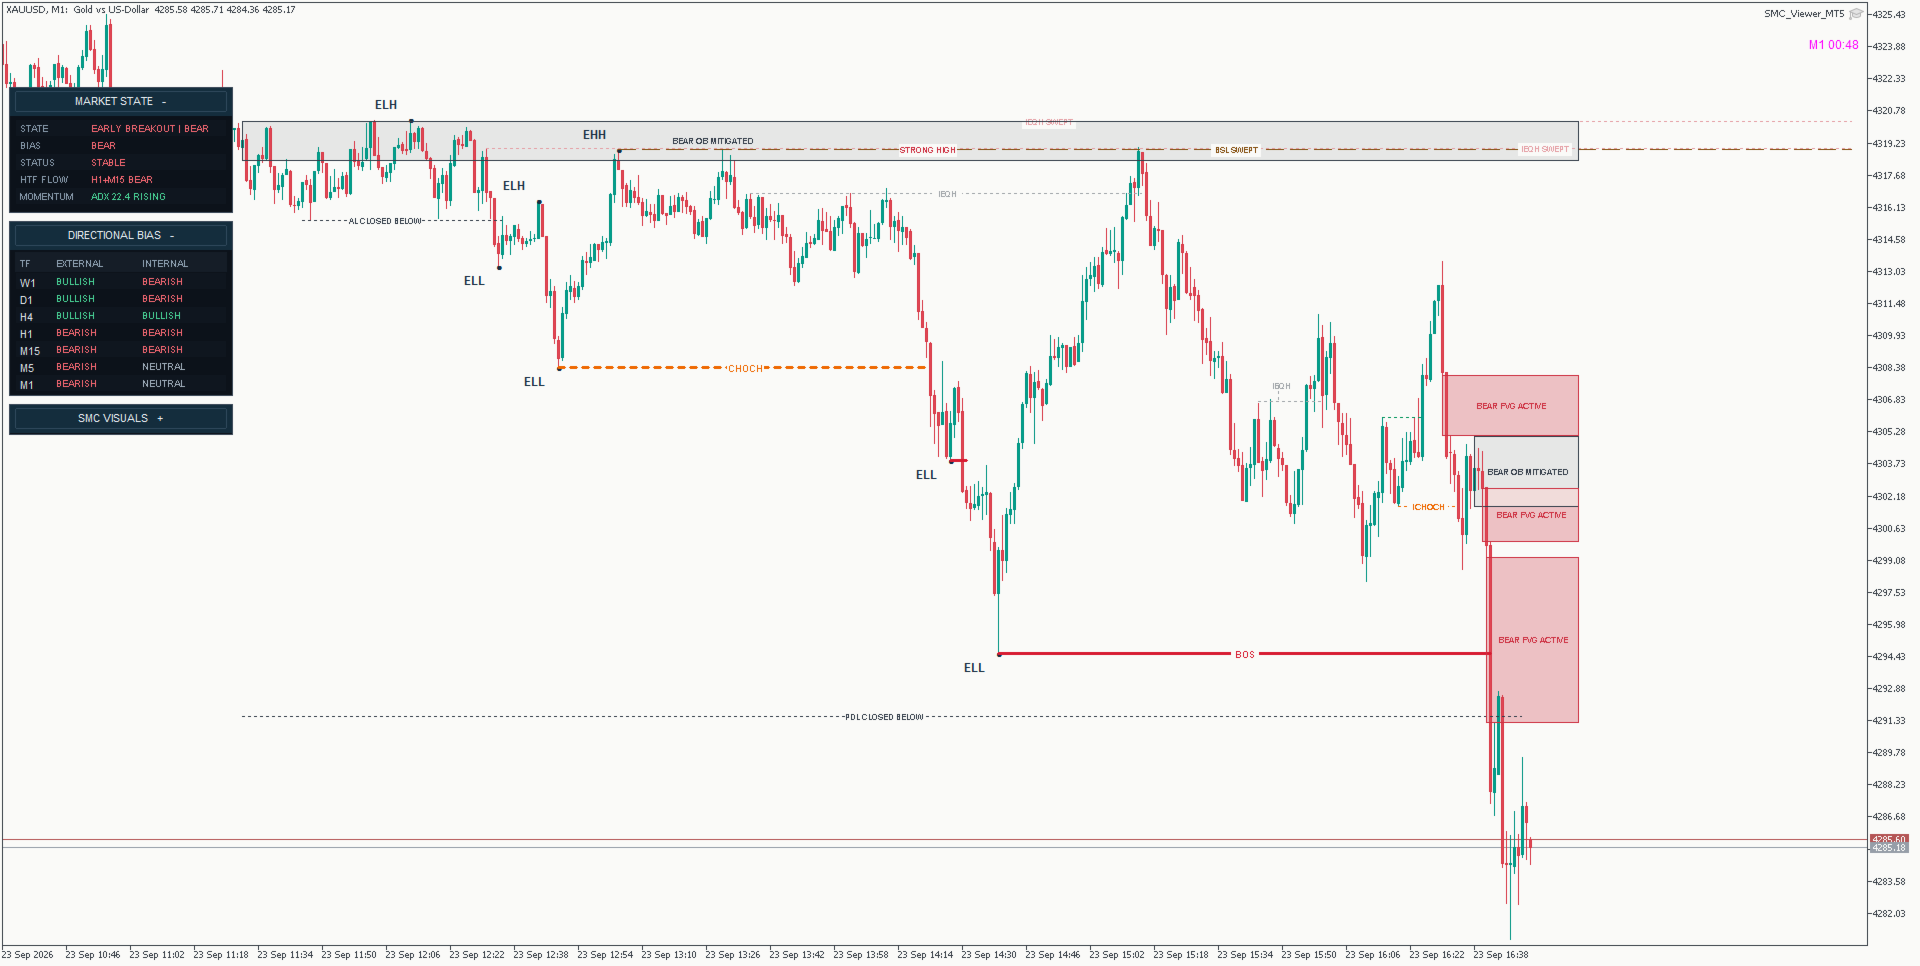
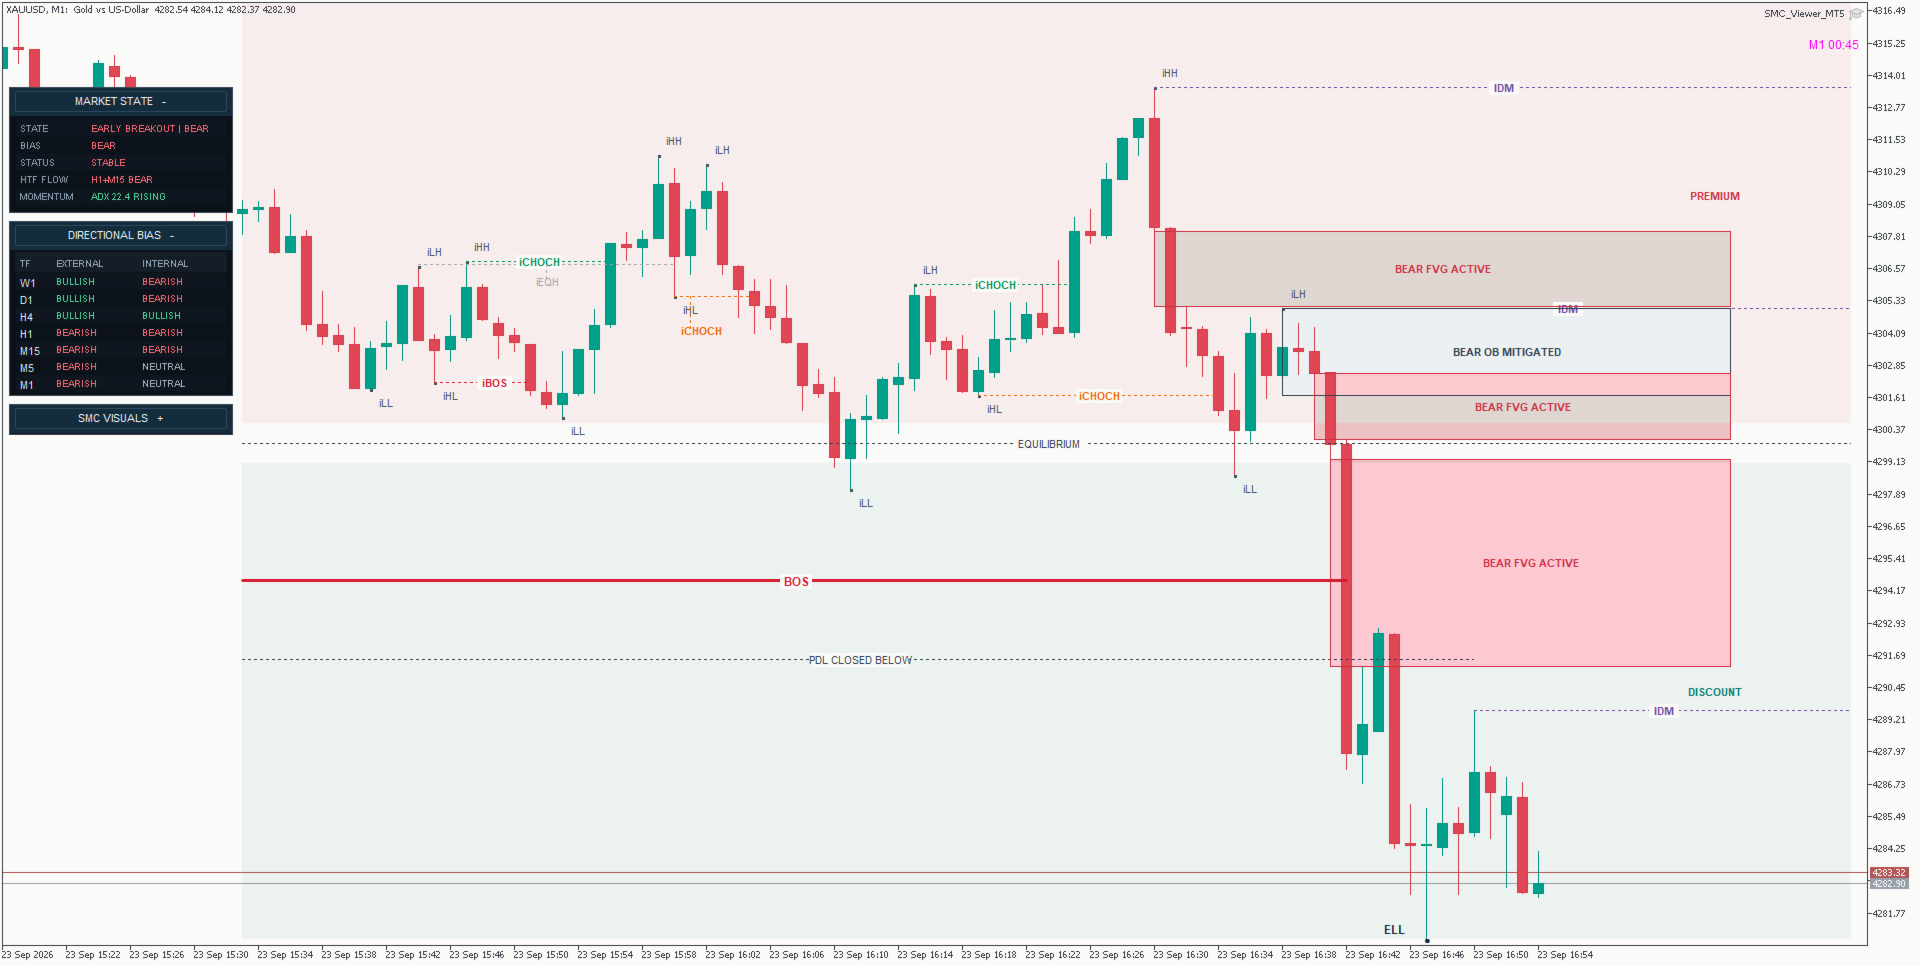
Market Structure Viewer is a multi-timeframe Smart Money Concepts (SMC) analysis workspace for MetaTrader 5.
Instead of displaying BOS, CHOCH, Order Blocks, Fair Value Gaps or liquidity as isolated chart elements, the indicator combines external and internal market structure, multi-timeframe directional bias, market-state context, liquidity, price zones and momentum into one structured workflow.
The objective is to help discretionary traders understand not only what structural event has occurred, but also where that event sits inside the broader market context.
Market Structure Viewer is an analysis and visualization tool only. It does not automatically open, modify or close trades.
WHY MARKET STRUCTURE VIEWER IS DIFFERENT
Many SMC indicators focus mainly on drawing individual concepts such as BOS, CHOCH, Order Blocks and Fair Value Gaps.
Market Structure Viewer is designed around the relationship between those concepts.
For example, a bullish M1 BOS has a very different context when M15 and H1 are also bullish compared with the same M1 BOS appearing against bearish higher-timeframe structure.
The viewer therefore combines:
- Market structure
- Multi-timeframe directional bias
- Market state
- Liquidity
- Inducement
- Order Blocks
- Fair Value Gaps
- Premium / Discount positioning
- Higher-timeframe flow
- Momentum context
This provides a more complete view of the current market environment without requiring the trader to constantly switch between multiple charts.
MULTI-TIMEFRAME DIRECTIONAL BIAS
The Directional Bias panel monitors both External and Internal market structure across:
- W1
- D1
- H4
- H1
- M15
- M5
- M1
External structure represents the broader directional structure of each timeframe, while internal structure shows the more recent movement developing inside that larger structure.
This makes it easier to identify:
- Higher-timeframe alignment
- Lower-timeframe pullbacks
- Counter-directional movement
- Possible structural transitions
- External and internal disagreement
A lower-timeframe bullish move does not automatically mean that the higher-timeframe structure has turned bullish. The panel helps keep both layers visible at the same time.
MARKET STATE PANEL
The Market State panel provides a compact summary of the current market environment.
Depending on current conditions, the viewer can classify the market into states such as:
- Strong Bull Trend
- Healthy Bull Trend
- Strong Bear Trend
- Healthy Bear Trend
- Early Expansion
- Decaying Chop
- Compression / Range
- Timeframe Desynchronization
The panel also displays:
BIAS
Current directional tendency.
STATUS
Current classification or transition status.
HTF FLOW
Relationship between H1 and M15 structural direction.
MOMENTUM
M5 ADX value together with rising, falling or relatively flat momentum behaviour.
The Market State panel is designed as a context layer, not as an automatic entry signal.
EXTERNAL AND INTERNAL MARKET STRUCTURE
Market Structure Viewer separates broader external structure from faster internal structure.
This helps distinguish between:
- Structural continuation
- Internal corrections
- Pullbacks
- Potential directional transitions
The indicator displays:
- External structural highs and lows
- Internal structural highs and lows
- Bullish and bearish BOS
- Bullish and bearish CHOCH
- Internal BOS
- Internal CHOCH
A lower-timeframe CHOCH can therefore be viewed inside its higher-timeframe context instead of automatically being treated as a complete trend reversal.
BOS AND CHOCH
Break of Structure (BOS) is used to identify confirmed continuation through an important structural level.
Change of Character (CHOCH) highlights a structural break that conflicts with the previous directional state and may indicate a transition.
External and internal structural events are tracked separately so that smaller internal changes do not automatically replace the broader structural view.
ORDER BLOCKS
The indicator identifies bullish and bearish Order Block areas associated with relevant price movement and structural context.
Instead of treating every opposite candle as an Order Block, the viewer focuses on zones connected with meaningful displacement and structure.
Order Blocks can be evaluated together with:
- Market direction
- Liquidity
- Fair Value Gaps
- Premium / Discount positioning
- Higher-timeframe bias
This helps the trader view each zone as part of the broader market structure rather than as an isolated signal.
FAIR VALUE GAPS
Market Structure Viewer detects bullish and bearish Fair Value Gaps created during directional displacement.
Fair Value Gaps can be used as potential areas of interest during retracements or continuation scenarios.
The value of an FVG depends on its context.
For example, a bullish Fair Value Gap located below current price during bullish structure has a different meaning from the same type of gap appearing against bearish higher-timeframe structure.
The viewer allows Fair Value Gaps to be analysed together with structural direction, liquidity and active price zones.
LIQUIDITY MAPPING
The indicator highlights relevant liquidity levels and tracks how price interacts with them.
Liquidity references can include important structural highs and lows and other significant price levels.
The viewer can distinguish between active liquidity and levels that have already been interacted with.
Liquidity levels can also change state after being:
- Swept
- Broken
- Closed through
This helps prevent previously consumed liquidity from being interpreted in the same way as untouched liquidity.
INDUCEMENT (IDM)
Inducement levels represent smaller internal structural references that may be targeted before price reaches a larger external objective.
IDM can provide additional context when analysing:
- Pullbacks
- Liquidity sweeps
- Internal structure
- External targets
- Order Blocks
- Fair Value Gaps
The indicator displays inducement separately from broader liquidity so that the trader can distinguish between different structural objectives.
EQUAL HIGHS AND EQUAL LOWS
Equal Highs (EQH) and Equal Lows (EQL) identify areas where multiple swing points form around similar price levels.
These areas may represent concentrated liquidity.
The viewer marks these levels directly on the chart so they can be analysed together with:
- BOS / CHOCH
- External structure
- Internal structure
- Liquidity
- Order Blocks
- Fair Value Gaps
PREMIUM, DISCOUNT AND EQUILIBRIUM
The active external structural range is divided into:
- Premium
- Equilibrium
- Discount
The midpoint of the current external structural range is used as Equilibrium.
The area above Equilibrium represents Premium, while the area below represents Discount.
These zones are contextual filters, not automatic trading signals.
For example:
A bullish Order Block or Fair Value Gap located in Discount during bullish structure may provide different context from the same zone positioned high in Premium.
Similarly, a bearish area of interest located in Premium may provide more relevant structural context during bearish conditions.
STRONG AND WEAK HIGHS / LOWS
The viewer can also identify Strong and Weak structural highs and lows.
These levels provide additional information about the current structural range and possible directional objectives.
They can be displayed or hidden independently through the visual control panel.
HIGHER-TIMEFRAME FLOW
Higher-timeframe flow provides a simplified view of the relationship between H1 and M15 structure.
The panel can display conditions such as:
- H1 + M15 Bull
- H1 + M15 Bear
- H1 / M15 Mixed
This helps quickly identify whether lower-timeframe analysis is aligned with or moving against the broader structural environment.
MOMENTUM CONTEXT
The Market State panel includes M5 ADX information together with its recent slope.
Momentum can be displayed as:
- Rising
- Falling
- Flat
This provides additional context about whether directional strength is increasing, weakening or remaining relatively stable.
Momentum should be interpreted together with structure and market state rather than used as a standalone signal.
INTERACTIVE SMC VISUAL CONTROLS
A major challenge with advanced SMC analysis is chart clutter.
Market Structure Viewer includes an interactive control panel that allows individual analytical layers to be enabled or disabled.
Available visual controls include:
- Market Structure
- External Structure
- Internal Structure
- BOS / CHOCH
- Order Blocks
- Fair Value Gaps
- Liquidity
- Inducement (IDM)
- EQH / EQL
- Premium / Discount
- Strong / Weak Highs and Lows
This allows the chart to be configured according to the type of analysis currently being performed.
For example, a trader studying liquidity can temporarily hide Order Blocks and Fair Value Gaps and focus only on Liquidity, IDM and EQH/EQL.
PRESENT AND HISTORICAL DISPLAY MODES
The viewer includes different display modes for analysing current and historical structure.
Present Mode focuses on the most relevant current structural information and helps reduce unnecessary chart objects.
Historical Mode provides additional historical structural context for reviewing how previous events developed.
VISUAL THEMES
Different visual themes are available to improve chart readability.
These include:
- Institutional Neutral
- Monochrome
- Directional Color
Changing the visual theme does not change the analytical logic of the indicator. It only changes how structural information is presented.
COLLAPSIBLE PANELS
The Market State, Directional Bias and SMC Visuals panels can be collapsed when additional chart space is required.
This is especially useful on lower timeframes where price action develops quickly and screen space is important.
HOW TO USE
-
Attach Market Structure Viewer to an MT5 chart.
-
Allow sufficient historical data to load for all required timeframes.
-
Begin with the Market State and Directional Bias panels to understand the broader environment.
-
Review the external and internal structure of the current timeframe.
-
Use BOS and CHOCH to understand structural continuation or possible transition.
-
Analyse nearby liquidity, inducement, EQH/EQL, Order Blocks and Fair Value Gaps.
-
Check whether price is positioned in Premium, Discount or near Equilibrium.
-
Compare lower-timeframe events with higher-timeframe directional bias.
-
Use the SMC Visuals panel to hide unnecessary layers and keep the chart focused.
-
Make the final trading decision using your own strategy and risk-management rules.
EXAMPLE 1: TREND ALIGNMENT
Suppose M1 prints a bullish BOS.
If M15 and H1 are also bullish and the market is trading from a relevant Discount area, the lower-timeframe bullish break is occurring in alignment with the broader market structure.
If M15 and H1 remain bearish, the same bullish M1 BOS may instead represent a lower-timeframe retracement.
The viewer helps expose this difference directly on the chart.
EXAMPLE 2: LIQUIDITY AND PRICE ZONES
Suppose price sweeps an Equal Low and then reacts from a bullish Order Block or Fair Value Gap located in Discount.
The liquidity sweep, structural location and higher-timeframe bias can be evaluated together instead of treating the Order Block or FVG as an independent signal.
This is the main purpose of Market Structure Viewer: combining several structural elements into one coherent analytical framework.
WHO IS THIS INDICATOR FOR?
Market Structure Viewer may be useful for traders who use:
- Smart Money Concepts
- Market Structure
- BOS / CHOCH analysis
- Order Blocks
- Fair Value Gaps
- Liquidity concepts
- Multi-timeframe analysis
- Premium / Discount analysis
- Discretionary price-action trading
It is designed for traders who want a structured visual workspace rather than an automatic signal generator.
IMPORTANT INFORMATION
Market Structure Viewer is a discretionary analysis tool.
It does not:
- Automatically open trades
- Automatically close trades
- Manage positions
- Guarantee profitable trades
- Predict future market movement
- Replace risk management
Market conditions can change and structural classifications may update as new candles close and new information becomes available.
Results and displayed levels can vary slightly between brokers because of differences in price feeds and available historical data.
Sufficient historical data must be available for multi-timeframe calculations.
The final interpretation, entry decision, position sizing, stop loss, take profit and overall risk management remain the responsibility of the trader.
FINAL NOTE
Market Structure Viewer is designed to reduce repetitive chart work and organize complex Smart Money Concepts into a clearer multi-timeframe framework.
Instead of switching constantly between charts and manually combining structure, liquidity, zones and directional bias, the indicator brings these elements together in one MT5 workspace.
The goal is simple:
More structured analysis. Less chart clutter. Better visibility of the market context.