Market Structure Viewer

  • Indicadores
  • Adari Manohar
    Adari Manohar
    • Self Employed em  Visakhapatnam, India
    • Índia
    • 185
    Forex trader and MQL5 developer focused on market structure, Smart Money Concepts, multi-timeframe analysis and automated trading systems. I build practical MetaTrader 5 tools that convert complex market analysis into structured visual and algorithmic workflows. My work includes market structure
  • Versão: 1.30
  • Atualizado: 26 setembro 2026
  • Ativações: 5
MARKET STRUCTURE VIEWER FOR MT5

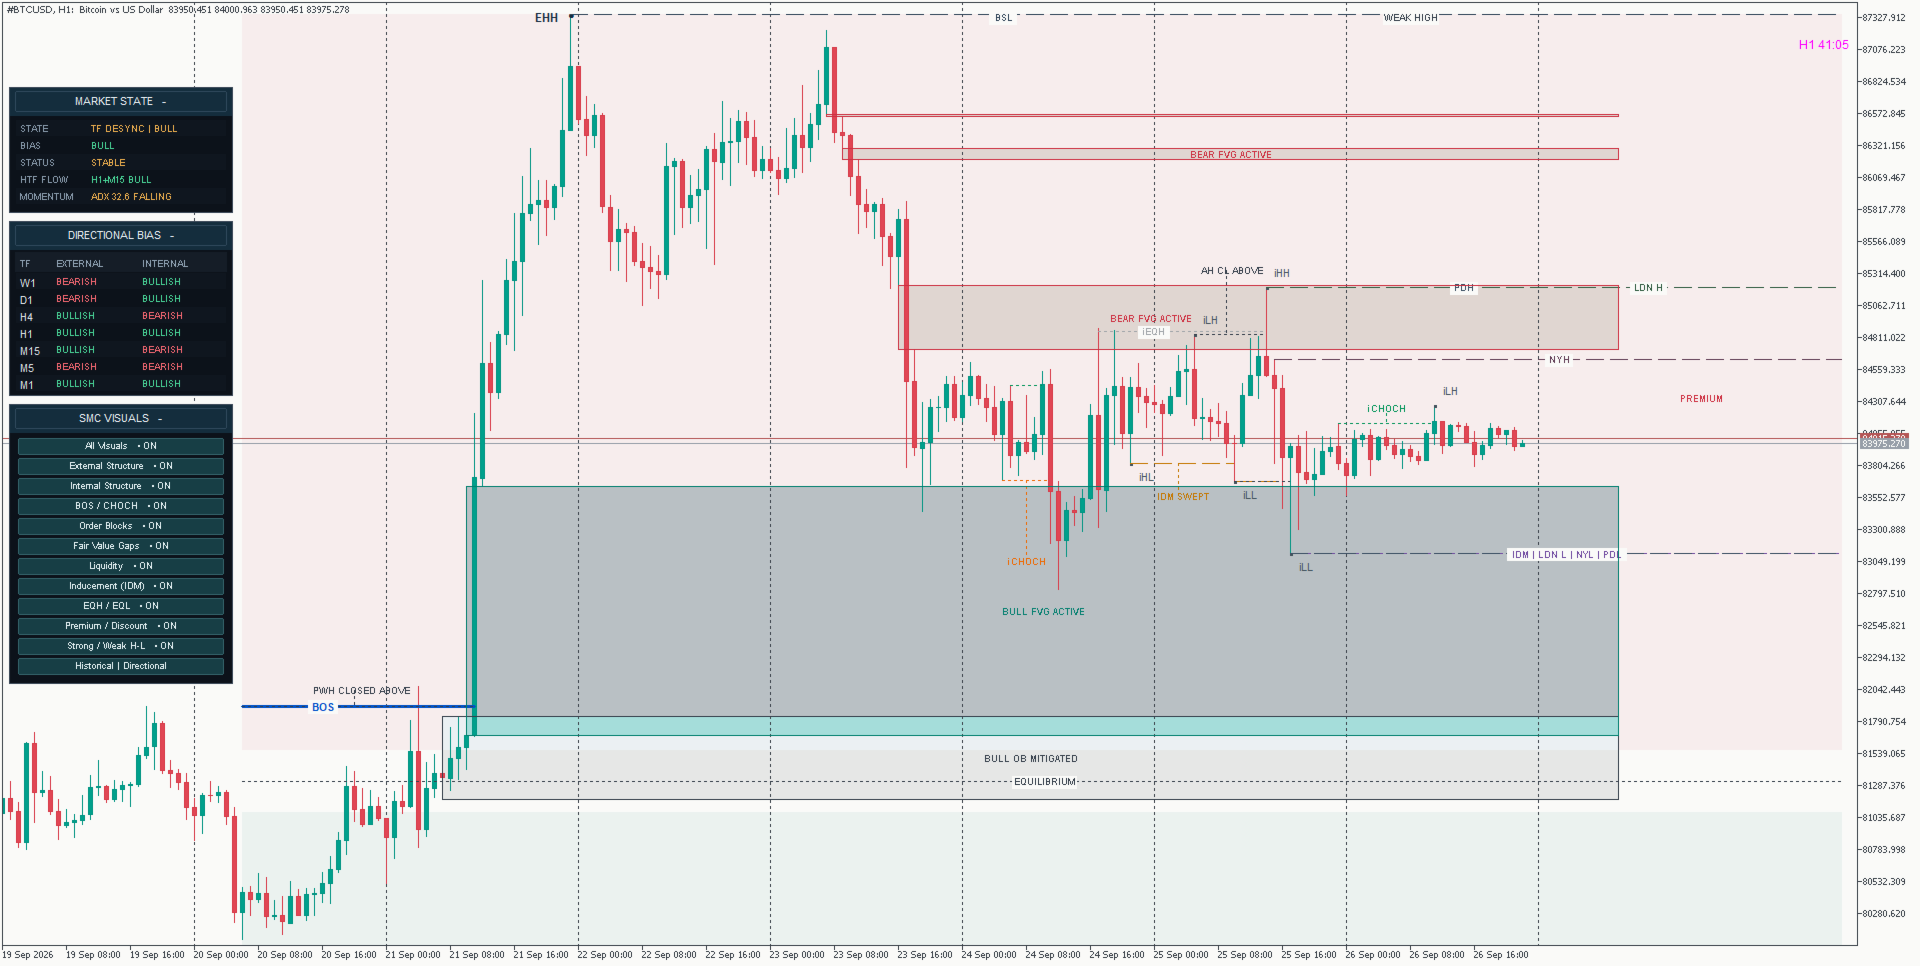
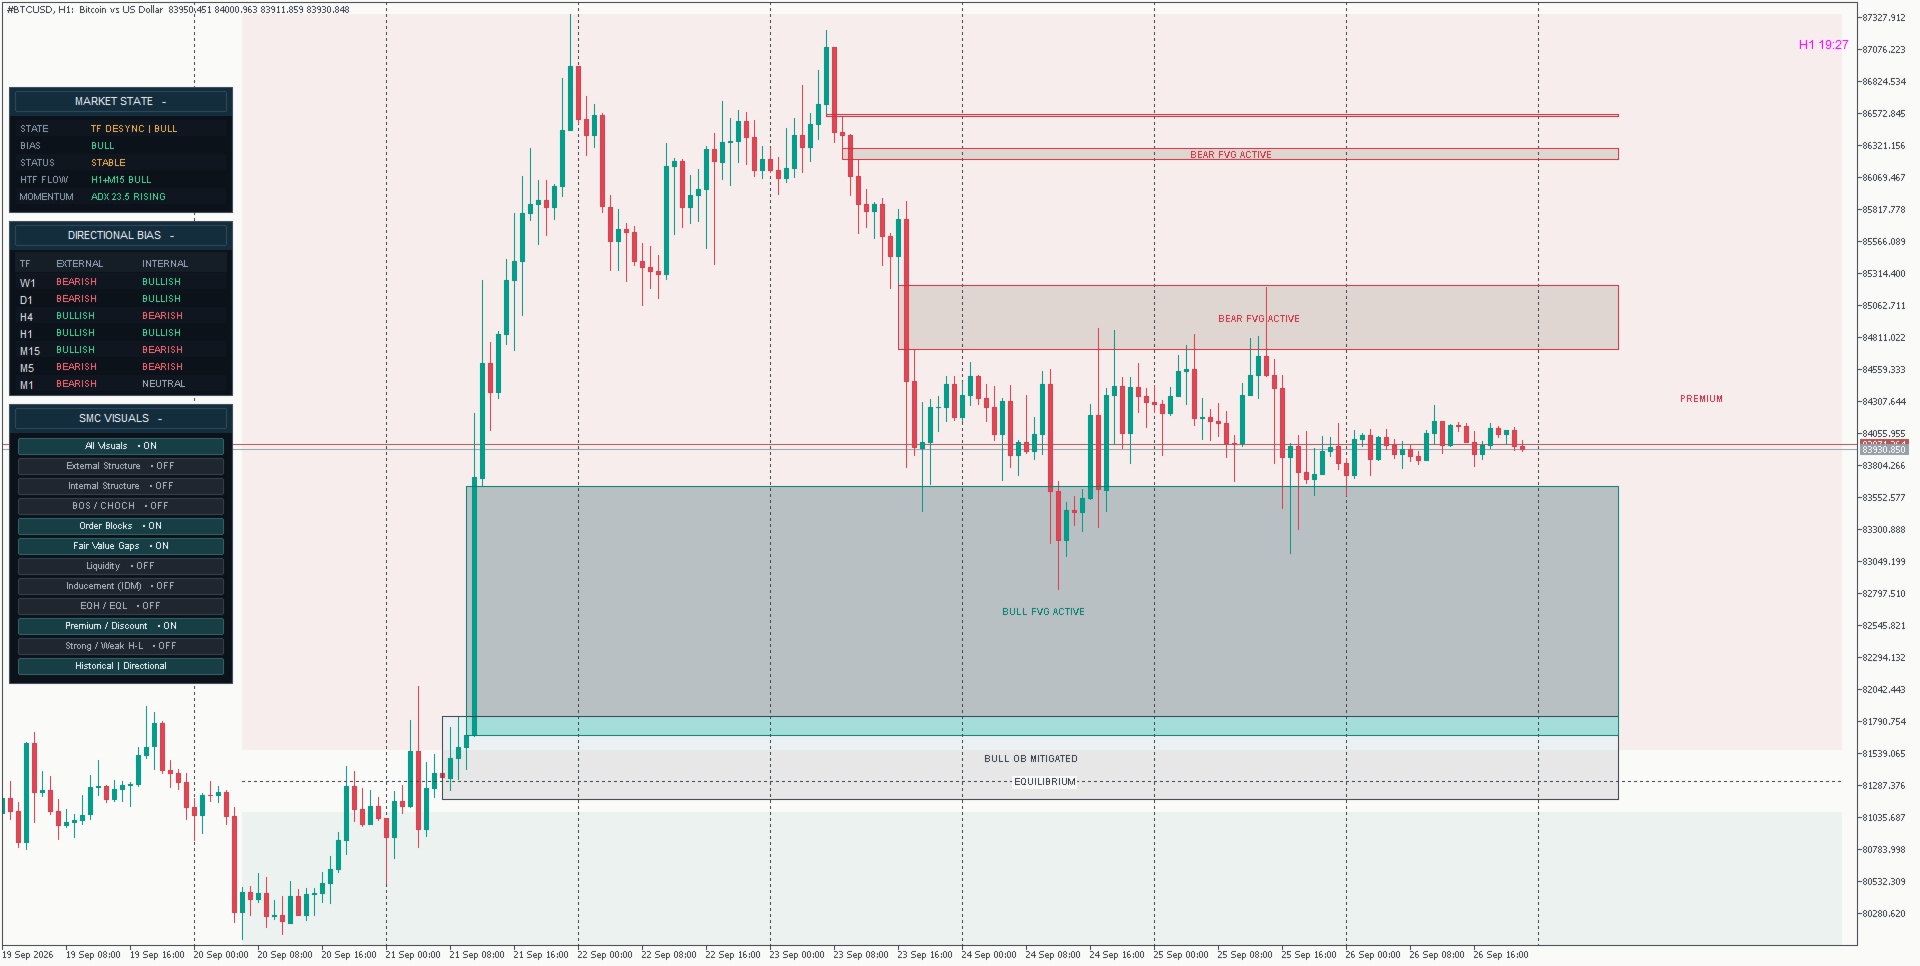
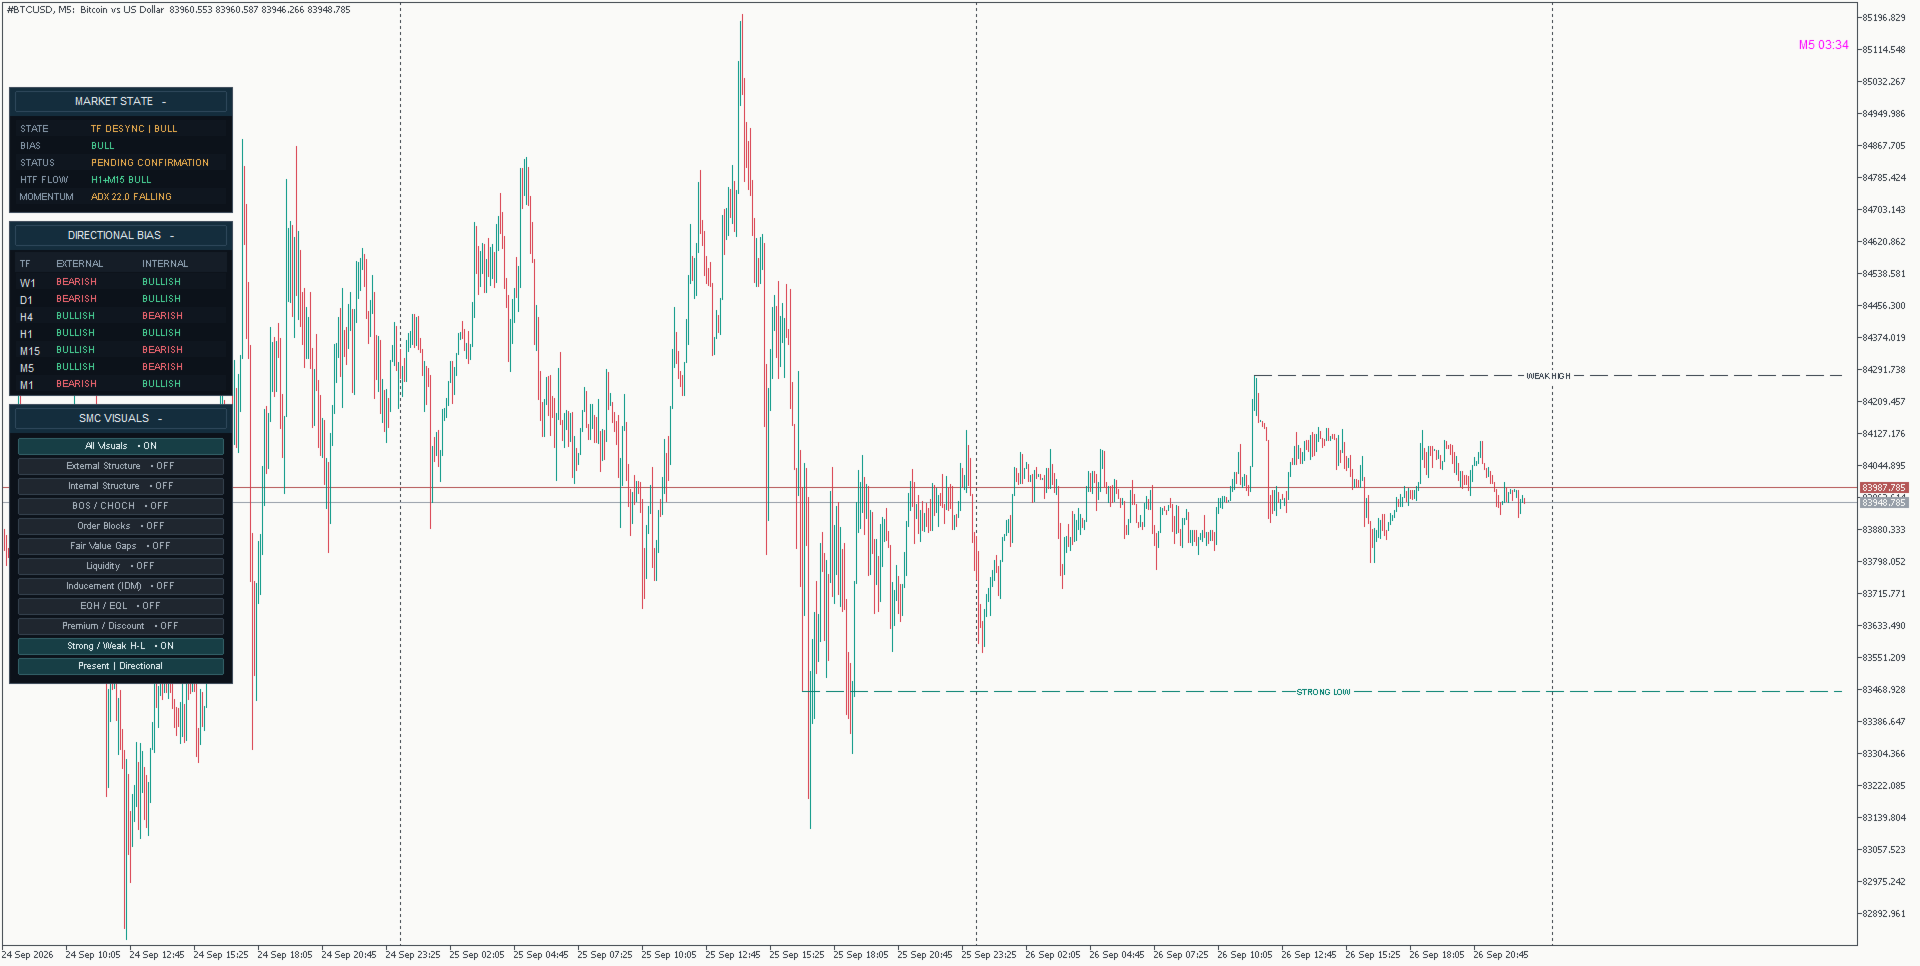
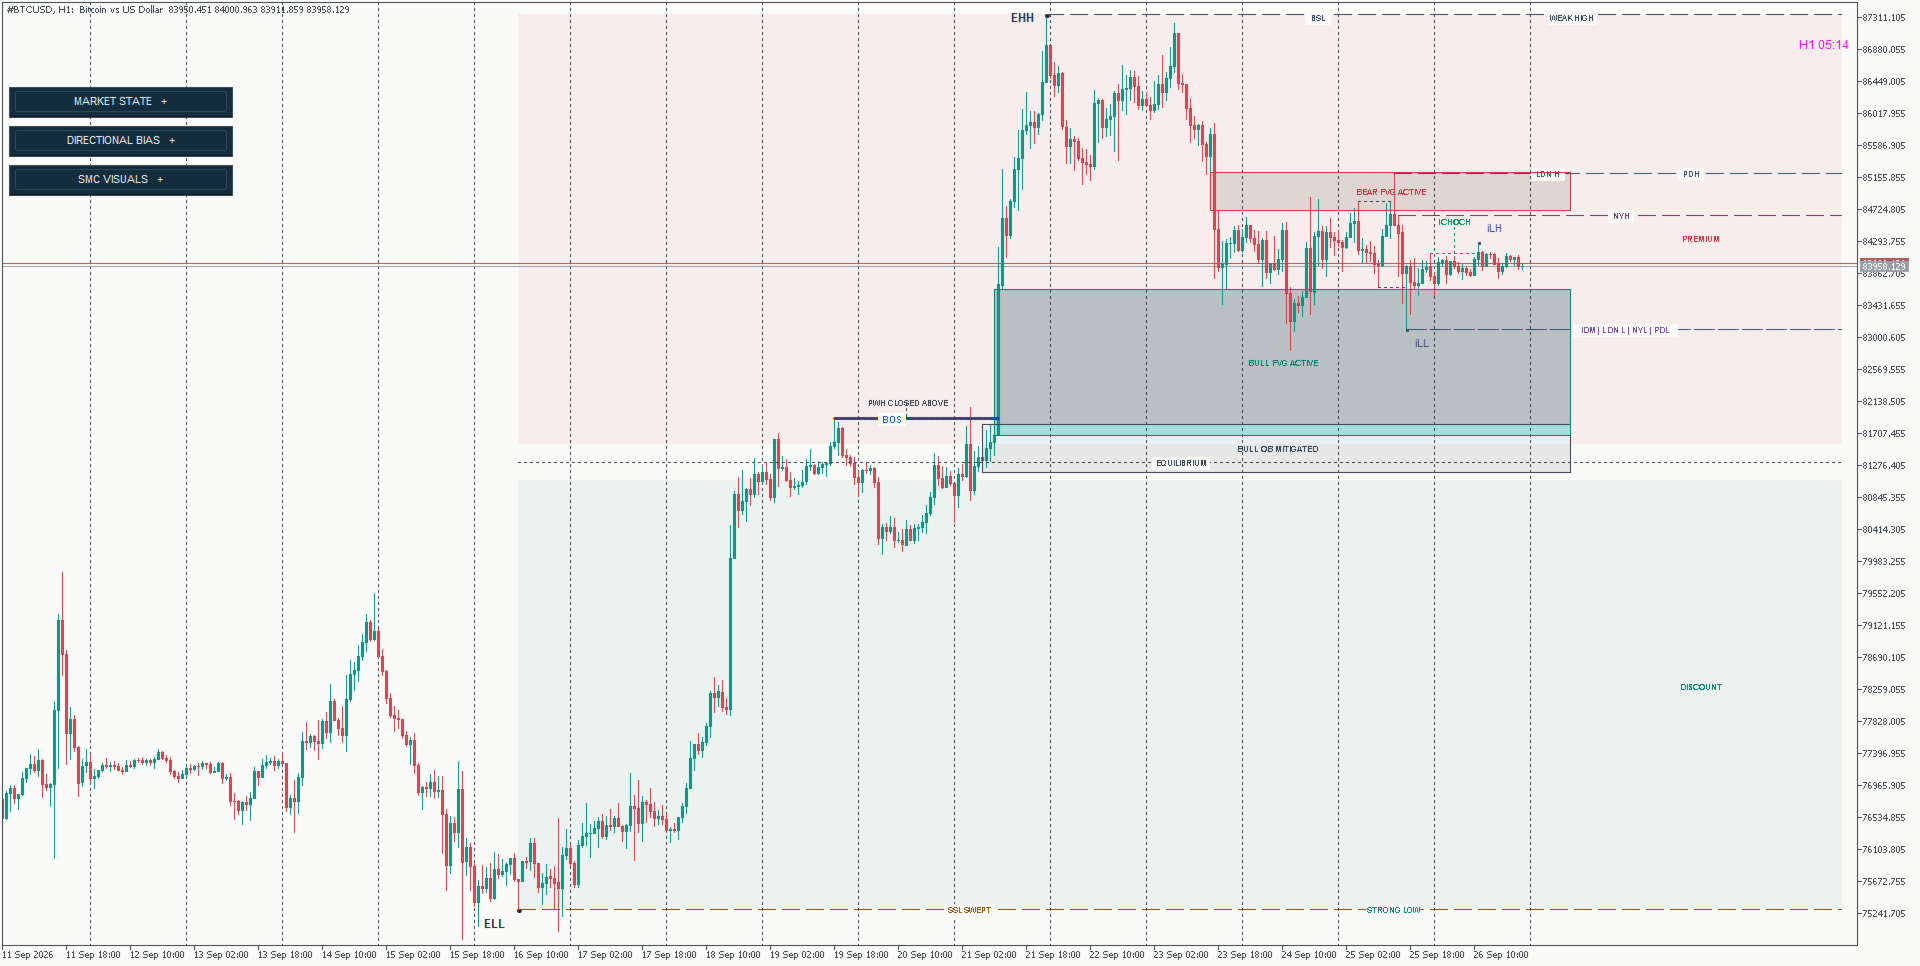
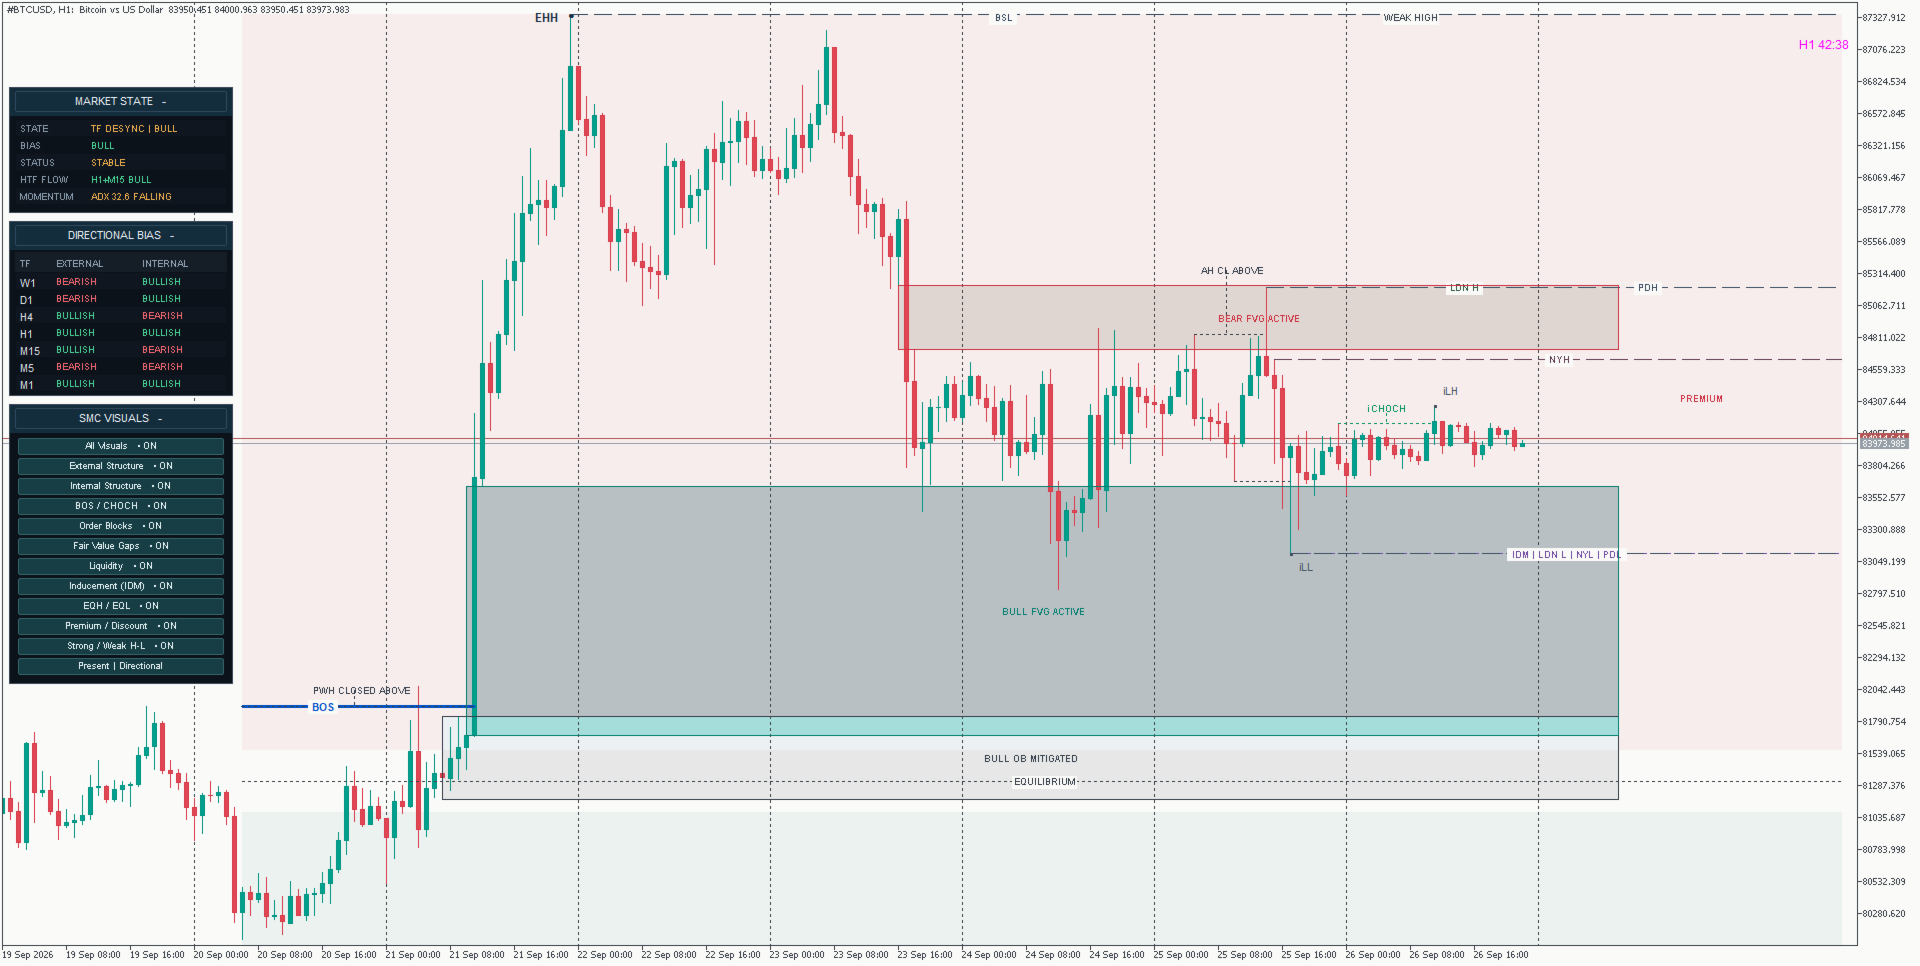
Market Structure Viewer is a multi-timeframe Smart Money Concepts (SMC) analysis workspace for MetaTrader 5.

Instead of displaying BOS, CHOCH, Order Blocks, Fair Value Gaps or liquidity as isolated chart elements, the indicator combines external and internal market structure, multi-timeframe directional bias, market-state context, liquidity, price zones and momentum into one structured workflow.

The objective is to help discretionary traders understand not only what structural event has occurred, but also where that event sits inside the broader market context.

Market Structure Viewer is an analysis and visualization tool only. It does not automatically open, modify or close trades.


## WHY MARKET STRUCTURE VIEWER IS DIFFERENT

Many SMC indicators focus mainly on drawing individual concepts such as BOS, CHOCH, Order Blocks and Fair Value Gaps.

Market Structure Viewer is designed around the relationship between those concepts.

For example, a bullish M1 BOS has a very different context when M15 and H1 are also bullish compared with the same M1 BOS appearing against bearish higher-timeframe structure.

The viewer therefore combines:

- Market structure
- Multi-timeframe directional bias
- Market state
- Liquidity
- Inducement
- Order Blocks
- Fair Value Gaps
- Premium / Discount positioning
- Higher-timeframe flow
- Momentum context

This provides a more complete view of the current market environment without requiring the trader to constantly switch between multiple charts.


## MULTI-TIMEFRAME DIRECTIONAL BIAS

The Directional Bias panel monitors both External and Internal market structure across:

- W1
- D1
- H4
- H1
- M15
- M5
- M1

External structure represents the broader directional structure of each timeframe, while internal structure shows the more recent movement developing inside that larger structure.

This makes it easier to identify:

- Higher-timeframe alignment
- Lower-timeframe pullbacks
- Counter-directional movement
- Possible structural transitions
- External and internal disagreement

A lower-timeframe bullish move does not automatically mean that the higher-timeframe structure has turned bullish.

The panel helps keep both layers visible at the same time.


## MARKET STATE PANEL

The Market State panel provides a compact summary of the current market environment.

Depending on current conditions, the viewer can classify the market into states such as:

- Strong Bull Trend
- Healthy Bull Trend
- Strong Bear Trend
- Healthy Bear Trend
- Early Expansion
- Decaying Chop
- Compression / Range
- Timeframe Desynchronization

The panel also displays:

BIAS
Current directional tendency.

STATUS
Current classification, trend condition or transition status.

HTF FLOW
Relationship between H1 and M15 structural direction.

MOMENTUM
M5 ADX value together with rising, falling or relatively flat momentum behaviour.

The Market State panel is designed as a context layer, not as an automatic entry signal.

The classification engine uses confirmation and transition logic to avoid treating every short-term change as a complete market-state reversal.


## EXTERNAL AND INTERNAL MARKET STRUCTURE

Market Structure Viewer separates broader external structure from faster internal structure.

This helps distinguish between:

- Structural continuation
- Internal corrections
- Pullbacks
- Potential directional transitions

The indicator displays:

- External structural highs and lows
- Internal structural highs and lows
- Bullish and bearish BOS
- Bullish and bearish CHOCH
- Internal BOS
- Internal CHOCH

A lower-timeframe CHOCH can therefore be viewed inside its higher-timeframe context instead of automatically being treated as a complete trend reversal.


## BOS AND CHOCH

Break of Structure (BOS) is used to identify confirmed continuation through an important structural level.

Change of Character (CHOCH) highlights a structural break that conflicts with the previous directional state and may indicate a transition.

External and internal structural events are tracked separately so that smaller internal changes do not automatically replace the broader structural view.

The structure engine is designed around confirmed price structure rather than unfinished intrabar movement.


## ORDER BLOCKS

The indicator identifies bullish and bearish Order Block areas associated with relevant price movement and structural context.

Instead of treating every opposite candle as an Order Block, the viewer focuses on zones connected with meaningful displacement and structure.

Order Blocks can be evaluated together with:

- Market direction
- Liquidity
- Fair Value Gaps
- Premium / Discount positioning
- Higher-timeframe bias

This helps the trader view each zone as part of the broader market structure rather than as an isolated signal.

Order Block states may update as price interacts with, mitigates or invalidates previously identified zones.


## FAIR VALUE GAPS

Market Structure Viewer detects bullish and bearish Fair Value Gaps created during directional displacement.

Fair Value Gaps can be used as potential areas of interest during retracements or continuation scenarios.

The value of an FVG depends on its context.

For example, a bullish Fair Value Gap located below current price during bullish structure has a different meaning from the same type of gap appearing against bearish higher-timeframe structure.

The viewer allows Fair Value Gaps to be analysed together with structural direction, liquidity and active price zones.

FVG states can update as price interacts with or fills previously identified gaps.


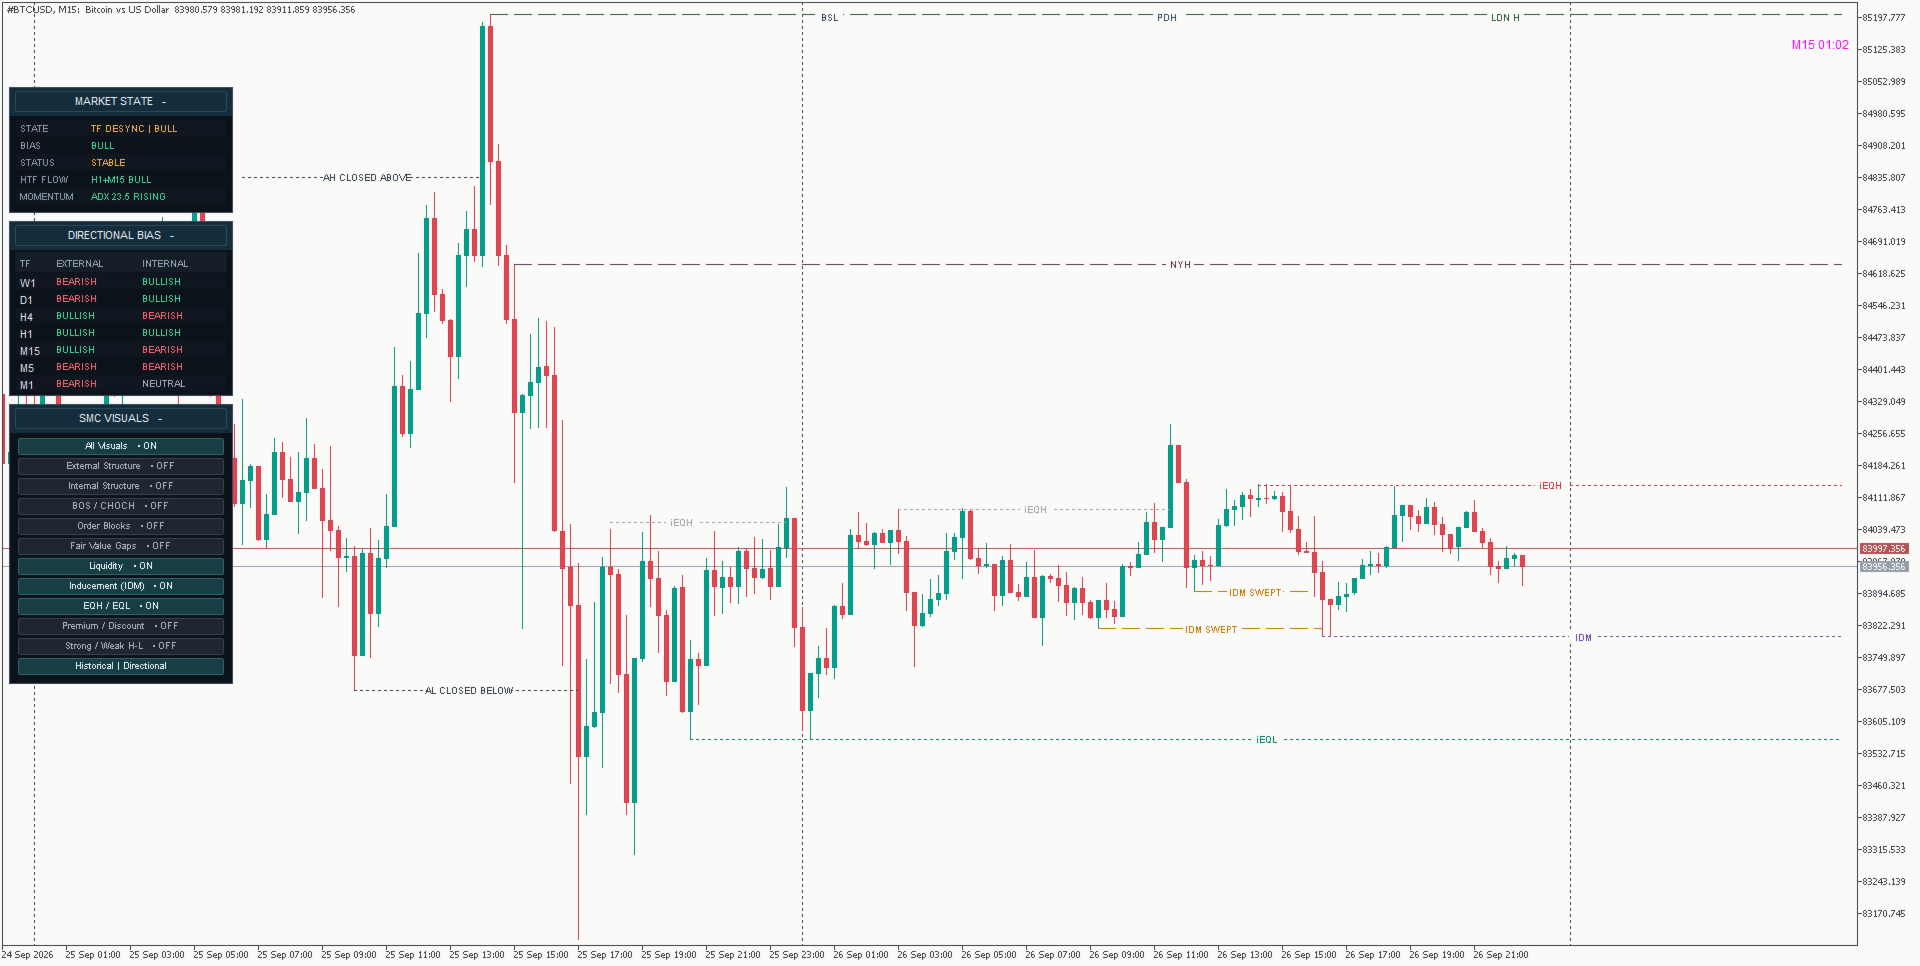
## LIQUIDITY MAPPING

The indicator highlights relevant liquidity levels and tracks how price interacts with them.

Liquidity references can include important structural highs and lows and other significant price levels.

The viewer can distinguish between active liquidity and levels that have already been interacted with.

Liquidity levels can also change state after being:

- Swept
- Broken
- Closed through

This helps prevent previously consumed liquidity from being interpreted in the same way as untouched liquidity.


## INDUCEMENT (IDM)

Inducement levels represent smaller internal structural references that may be targeted before price reaches a larger external objective.

IDM can provide additional context when analysing:

- Pullbacks
- Liquidity sweeps
- Internal structure
- External targets
- Order Blocks
- Fair Value Gaps

The indicator displays inducement separately from broader liquidity so that the trader can distinguish between different structural objectives.


## EQUAL HIGHS AND EQUAL LOWS

Equal Highs (EQH) and Equal Lows (EQL) identify areas where multiple swing points form around similar price levels.

These areas may represent concentrated liquidity.

The viewer marks these levels directly on the chart so they can be analysed together with:

- BOS / CHOCH
- External structure
- Internal structure
- Liquidity
- Order Blocks
- Fair Value Gaps

Previously formed equal levels can also reflect lifecycle changes after price sweeps or closes through them.


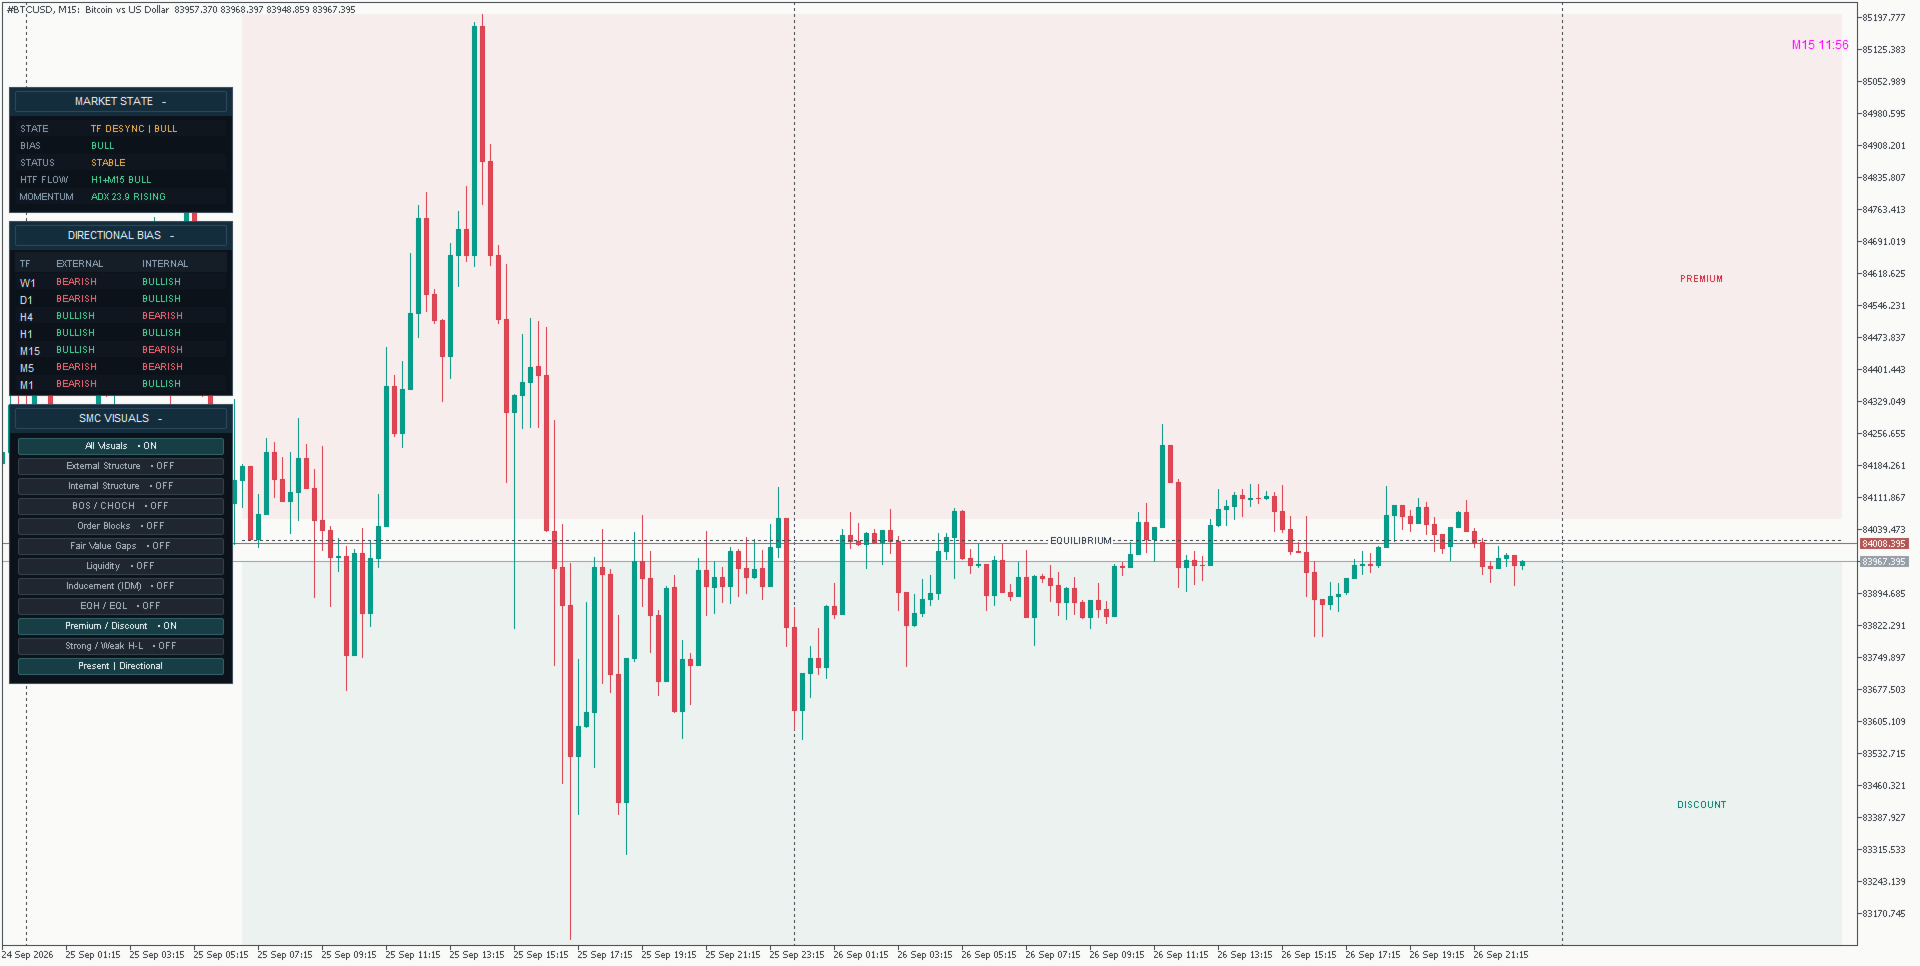
## PREMIUM, DISCOUNT AND EQUILIBRIUM

The active external structural range is divided into:

- Premium
- Equilibrium
- Discount

The midpoint of the current external structural range is used as Equilibrium.

The area above Equilibrium represents Premium, while the area below represents Discount.

These zones are contextual filters, not automatic trading signals.

For example:

A bullish Order Block or Fair Value Gap located in Discount during bullish structure may provide different context from the same zone positioned high in Premium.

Similarly, a bearish area of interest located in Premium may provide more relevant structural context during bearish conditions.


## STRONG AND WEAK HIGHS / LOWS

The viewer can also identify Strong and Weak structural highs and lows.

These levels provide additional information about the current structural range and possible directional objectives.

They can be displayed or hidden independently through the visual control panel.


## HIGHER-TIMEFRAME FLOW

Higher-timeframe flow provides a simplified view of the relationship between H1 and M15 structure.

The panel can display conditions such as:

- H1 + M15 Bull
- H1 + M15 Bear
- H1 / M15 Mixed

This helps quickly identify whether lower-timeframe analysis is aligned with or moving against the broader structural environment.


## MOMENTUM CONTEXT

The Market State panel includes M5 ADX information together with its recent slope.

Momentum can be displayed as:

- Rising
- Falling
- Flat

This provides additional context about whether directional strength is increasing, weakening or remaining relatively stable.

Momentum should be interpreted together with structure and market state rather than used as a standalone signal.


## INTERACTIVE SMC VISUAL CONTROLS

A major challenge with advanced SMC analysis is chart clutter.

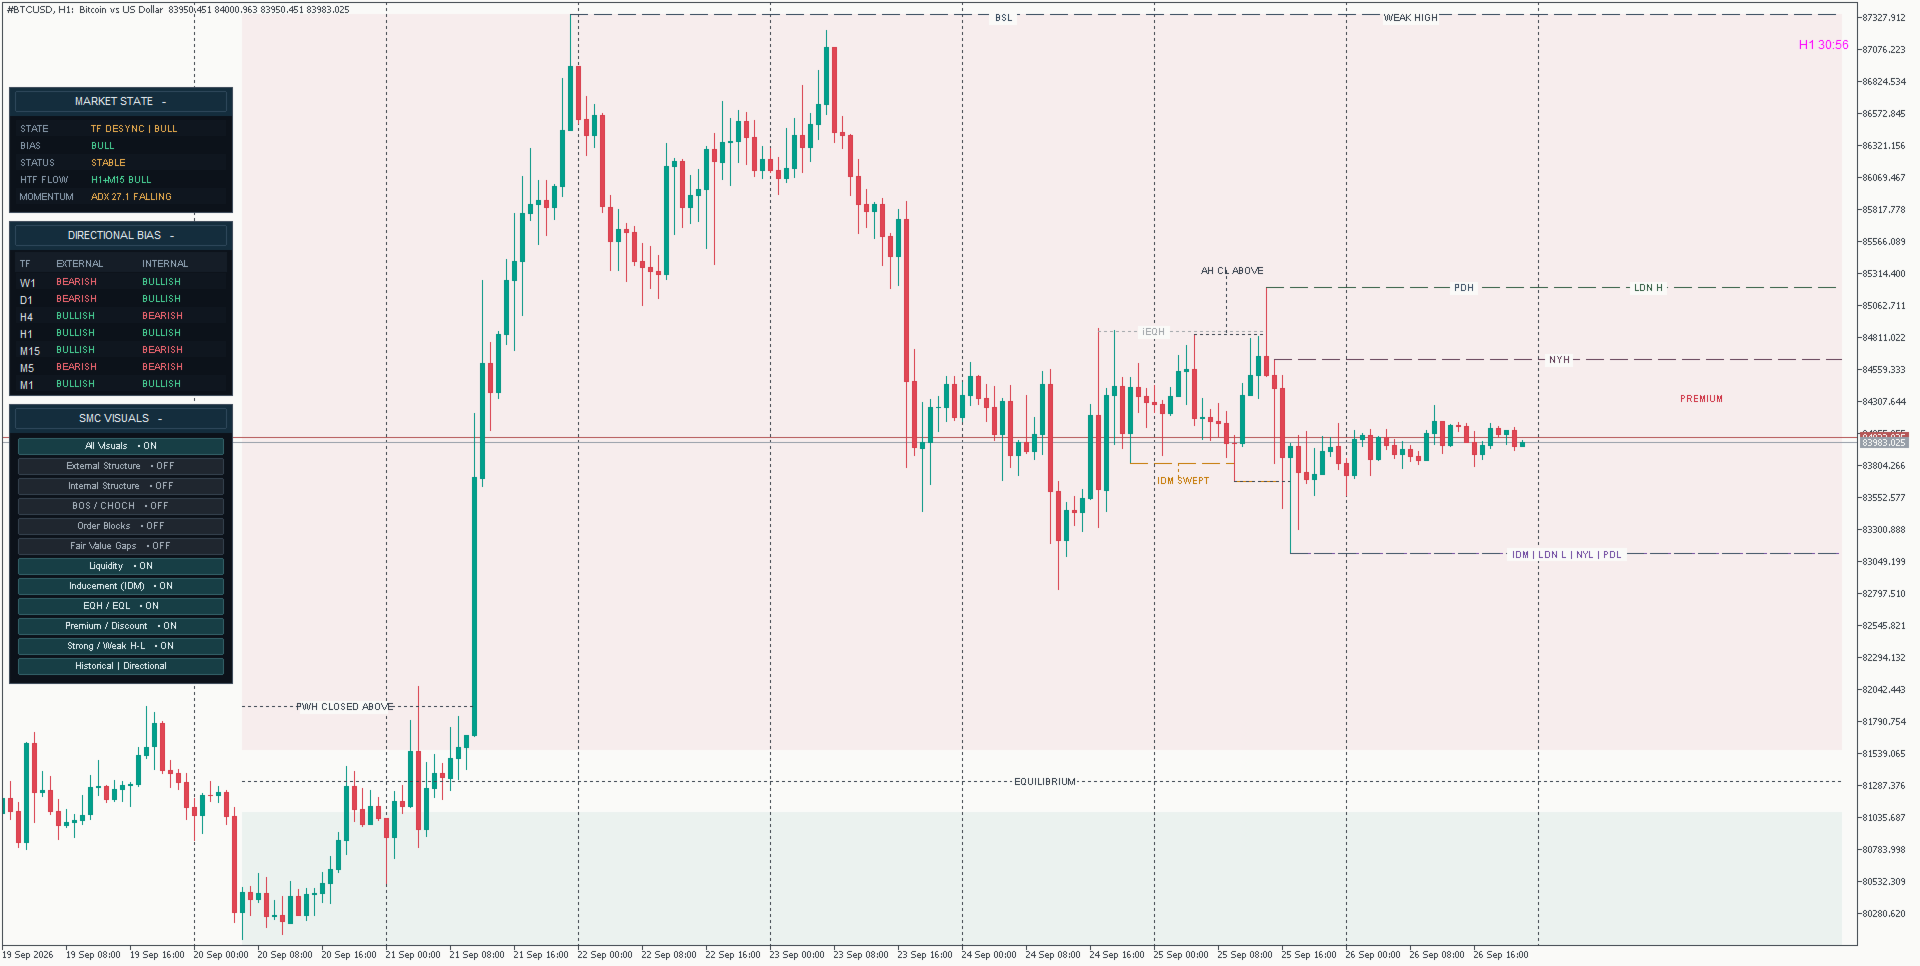
Market Structure Viewer includes an interactive control panel that allows analytical layers to be enabled or disabled individually.

Available visual controls include:

- All Visuals
- External Structure
- Internal Structure
- BOS / CHOCH
- Order Blocks
- Fair Value Gaps
- Liquidity
- Inducement (IDM)
- EQH / EQL
- Premium / Discount
- Strong / Weak Highs and Lows

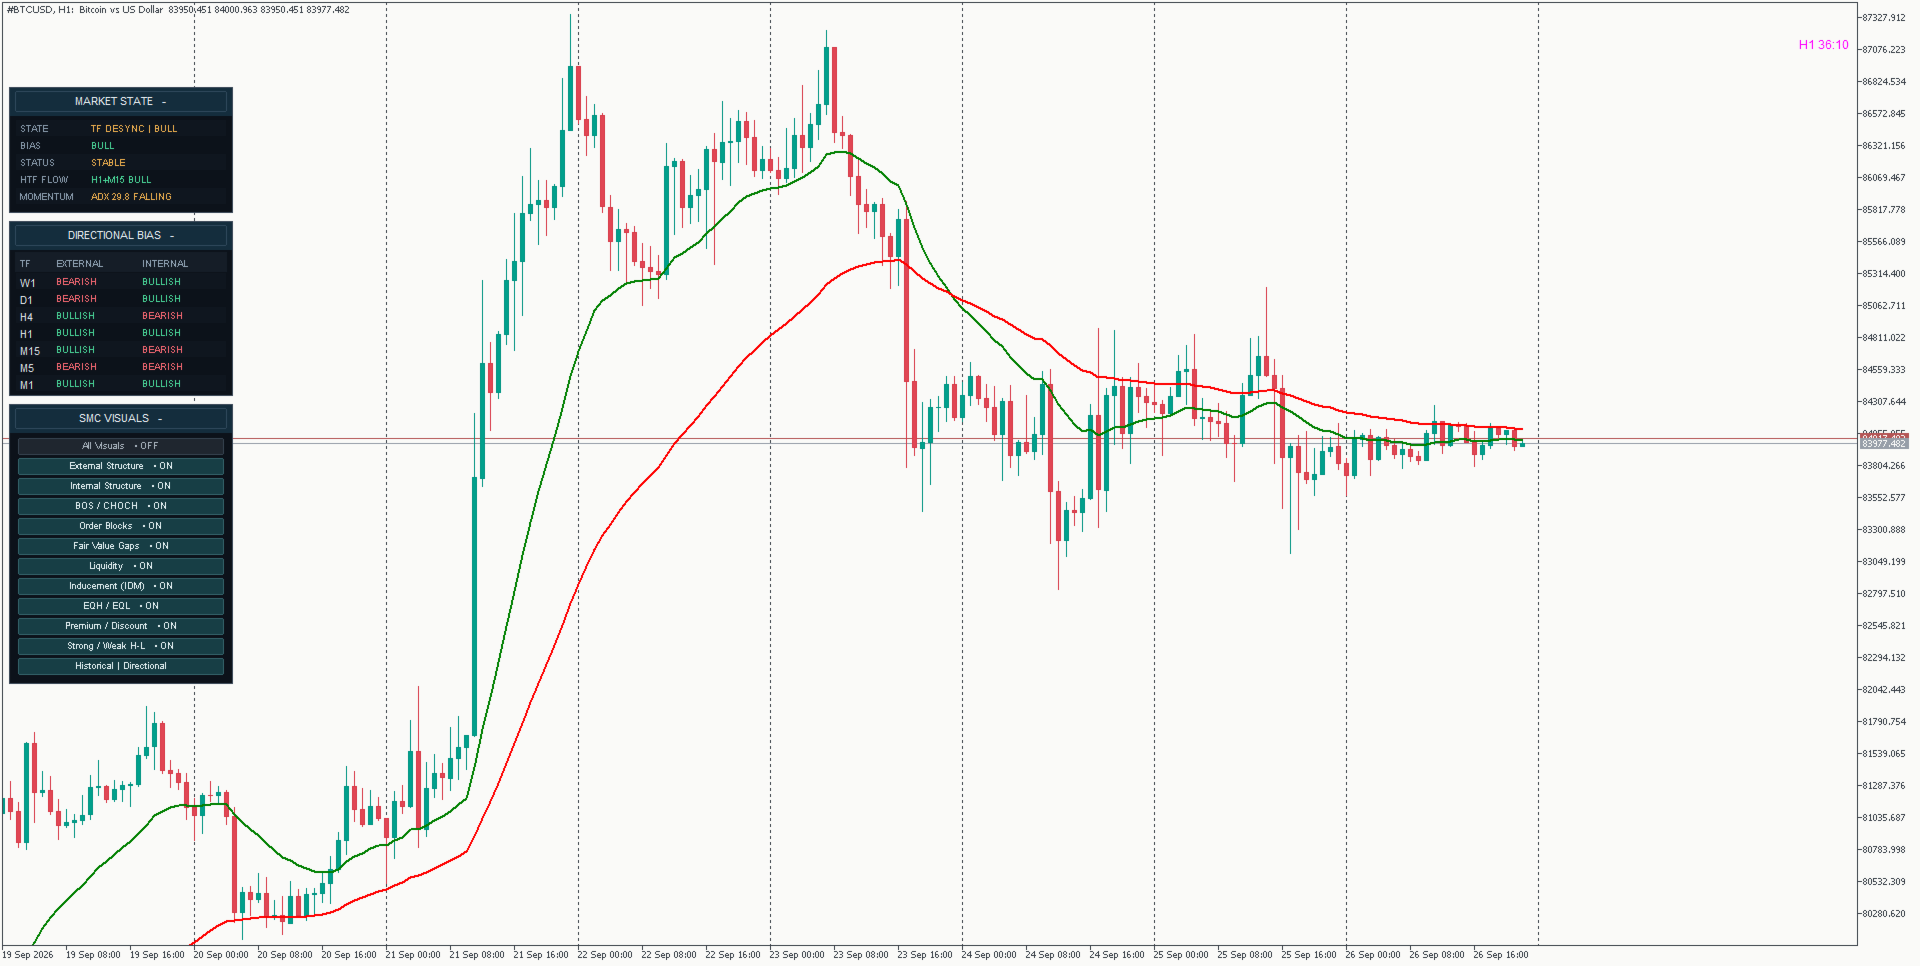
The All Visuals control acts as a master switch for chart overlays.

Turning All Visuals OFF temporarily hides the SMC chart drawings without changing the individual visual-layer selections.

When All Visuals is turned back ON, the previously selected visual settings are restored.

The Market State and Directional Bias panels operate independently from the All Visuals master control.

Individual layers can still be enabled or disabled separately according to the type of analysis currently being performed.

For example, a trader studying liquidity can temporarily hide Order Blocks and Fair Value Gaps and focus only on Liquidity, IDM and EQH/EQL.


## PRESENT AND HISTORICAL DISPLAY MODES

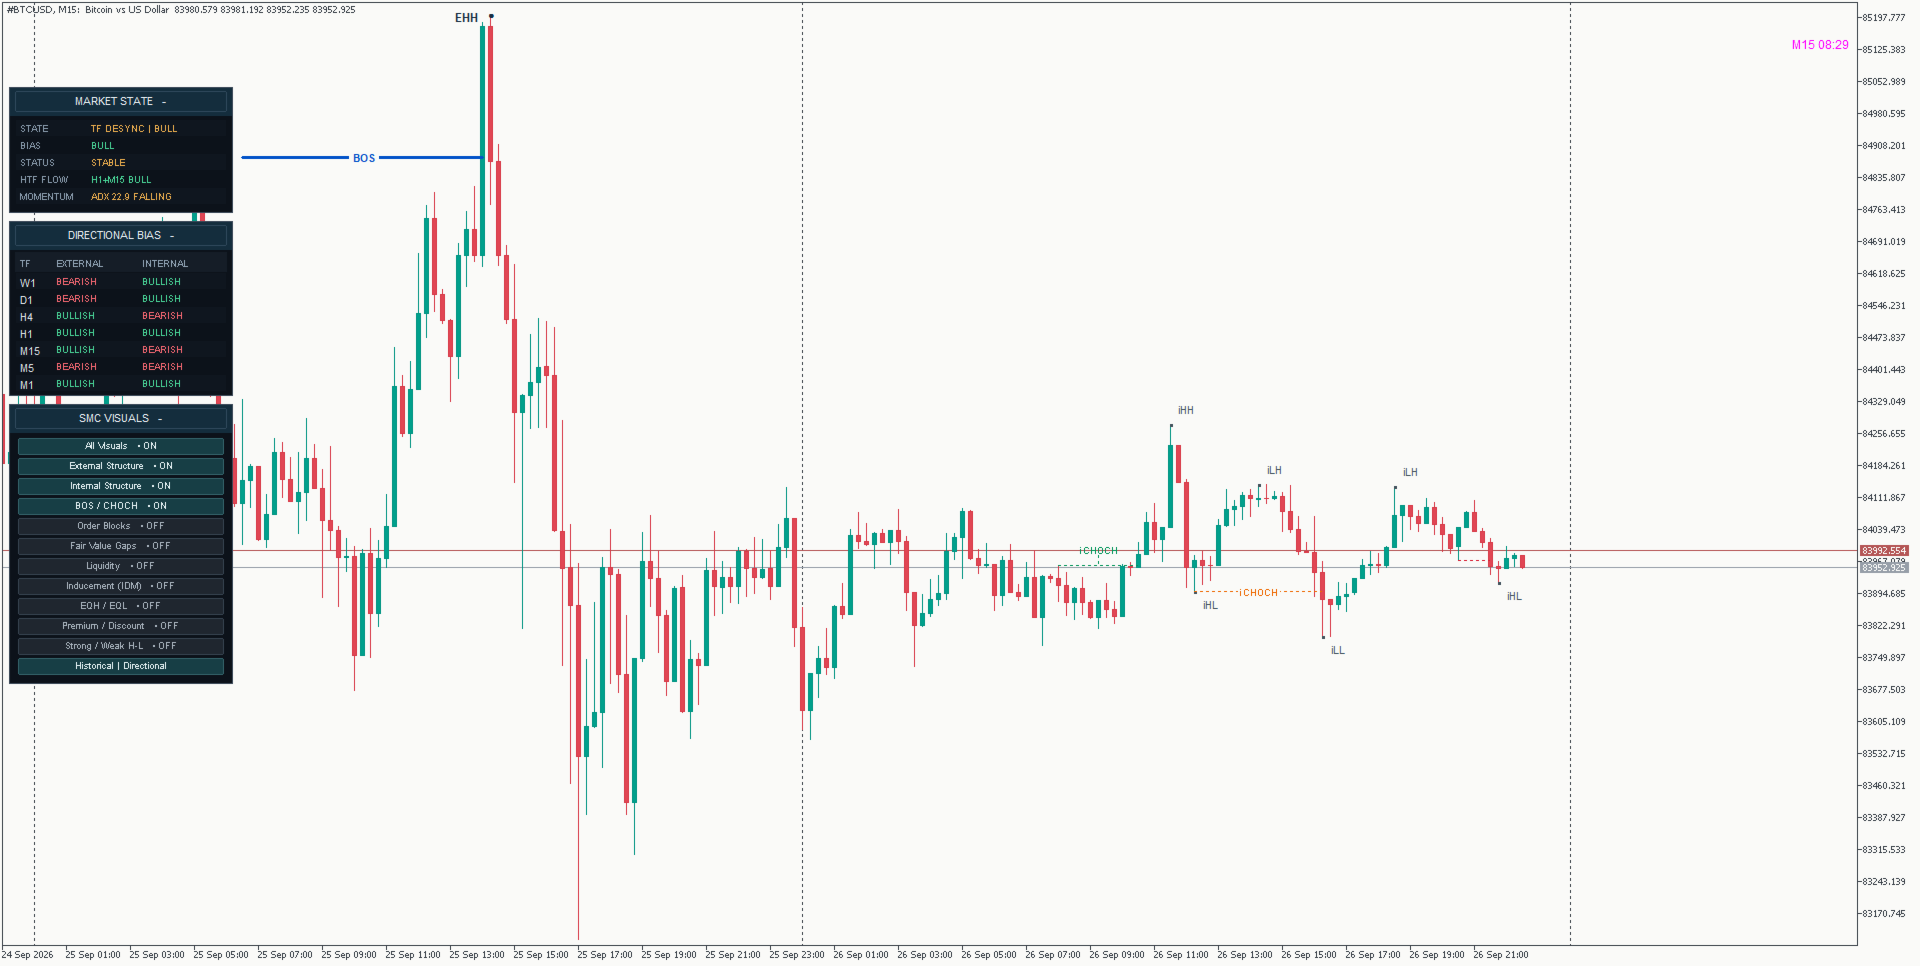
Market Structure Viewer provides two display modes for different types of analysis.


### PRESENT MODE

Present Mode focuses on the most recent and currently relevant market structure.

It reduces historical chart clutter by prioritizing the latest structural highs and lows, BOS/CHOCH events, active Order Blocks, Fair Value Gaps, liquidity references and other current SMC information.

This mode is useful when the main objective is analysing the current market environment.

Present Mode is designed to keep the chart cleaner while preserving the most relevant current structural context.


### HISTORICAL MODE

Historical Mode provides a broader view of previous market structure and structural events.

More historical structural highs and lows, BOS/CHOCH events, Order Blocks, Fair Value Gaps, liquidity references, inducement levels, EQH/EQL and other SMC information can be displayed.

When the chart is scrolled backward, the viewer adapts to the visible historical area and rebuilds relevant SMC information for that part of the chart.

This makes it possible to review previous structural development directly within historical price action.

Historical calculations are designed around the historical area being reviewed instead of simply projecting the latest market state backward across the chart.

This mode is useful for:

- Manual chart review
- Studying previous market behaviour
- Reviewing structural development
- Analysing previous BOS / CHOCH events
- Reviewing historical Order Blocks and Fair Value Gaps
- Studying liquidity interactions
- Comparing different market environments

Present and Historical modes change how chart information is displayed.

They do not change the underlying purpose of the Market State or Directional Bias panels.


## VISUAL THEMES

Different visual themes are available to improve chart readability.

These include:

- Institutional Neutral
- Monochrome
- Directional Color

Changing the visual theme does not change the analytical logic of the indicator.

It only changes how structural information is presented.


## COLLAPSIBLE PANELS

The Market State, Directional Bias and SMC Visuals panels can be collapsed when additional chart space is required.

This is especially useful on lower timeframes where price action develops quickly and screen space is important.

Collapsing a panel changes the interface layout only.

The underlying analytical engine can continue updating independently.


## HOW TO USE

1. Attach Market Structure Viewer to an MT5 chart.

2. Allow sufficient historical data to load for all required timeframes.

3. Begin with the Market State and Directional Bias panels to understand the broader market environment.

4. Review the external and internal structure of the current timeframe.

5. Use BOS and CHOCH to understand structural continuation or possible transition.

6. Analyse nearby liquidity, inducement, EQH/EQL, Order Blocks and Fair Value Gaps.

7. Check whether price is positioned in Premium, Discount or near Equilibrium.

8. Compare lower-timeframe events with higher-timeframe directional bias.

9. Use Present Mode for current-market analysis or Historical Mode when reviewing previous price action and structural development.

10. Use the All Visuals master control or individual visual-layer controls to keep the chart focused on the information required for the current analysis.

11. Make the final trading decision using your own strategy and risk-management rules.


## EXAMPLE 1: TREND ALIGNMENT

Suppose M1 prints a bullish BOS.

If M15 and H1 are also bullish and the market is trading from a relevant Discount area, the lower-timeframe bullish break is occurring in alignment with the broader market structure.

If M15 and H1 remain bearish, the same bullish M1 BOS may instead represent a lower-timeframe retracement.

The viewer helps expose this difference directly on the chart.


## EXAMPLE 2: LIQUIDITY AND PRICE ZONES

Suppose price sweeps an Equal Low and then reacts from a bullish Order Block or Fair Value Gap located in Discount.

The liquidity sweep, structural location and higher-timeframe bias can be evaluated together instead of treating the Order Block or FVG as an independent signal.

This is the main purpose of Market Structure Viewer: combining several structural elements into one coherent analytical framework.


## EXAMPLE 3: PRESENT VS HISTORICAL REVIEW

Suppose the trader is analysing the current H1 market structure.

Present Mode can be used to keep the chart focused on the most recent structural information and active areas of interest.

If the trader wants to study how the same market behaved several days earlier, Historical Mode can be selected and the chart can be scrolled backward.

The viewer then provides historical structural context around the area being reviewed.

This makes the two modes useful for different purposes without requiring separate indicators.


## WHO IS THIS INDICATOR FOR?

Market Structure Viewer may be useful for traders who use:

- Smart Money Concepts
- Market Structure
- BOS / CHOCH analysis
- Order Blocks
- Fair Value Gaps
- Liquidity concepts
- Multi-timeframe analysis
- Premium / Discount analysis
- Discretionary price-action trading

It is designed for traders who want a structured visual workspace rather than an automatic signal generator.


## IMPORTANT INFORMATION

Market Structure Viewer is a discretionary analysis tool.

It does not:

- Automatically open trades
- Automatically close trades
- Manage positions
- Guarantee profitable trades
- Predict future market movement
- Replace risk management

Market conditions can change and structural classifications may update as new candles close and new information becomes available.

Market State classifications, structural levels, liquidity states, Order Blocks, Fair Value Gaps and other displayed information can update as new confirmed market information becomes available.

Historical visualisation is intended for analysis and review. It should not be interpreted as a guarantee that historical market behaviour will repeat.

Results and displayed levels can vary slightly between brokers because of differences in price feeds and available historical data.

Sufficient historical data must be available for multi-timeframe calculations.

The final interpretation, entry decision, position sizing, stop loss, take profit and overall risk management remain the responsibility of the trader.


## FINAL NOTE

Market Structure Viewer is designed to reduce repetitive chart work and organize complex Smart Money Concepts into a clearer multi-timeframe framework.

Instead of switching constantly between charts and manually combining structure, liquidity, zones and directional bias, the indicator brings these elements together in one MT5 workspace.

The goal is simple:

More structured analysis.
Less chart clutter.
Better visibility of the market context.
Produtos recomendados
Structure King AI Signal Structure King AI Signal is a professional MetaTrader 5 trading indicator designed to help traders analyze market structure, trend direction, multi-timeframe confirmation and trade management from one clean dashboard. Key Features • Market Structure & Trend Analysis • BUY / SELL Signals • Multi-Timeframe (HTF) Confirmation • Entry Price Levels • Dynamic Stop Loss (SL) • TP1 / TP2 / TP3 Levels • ATR Volatility Analysis • ADX Trend Strength Filter • Adaptive Market Filter
RBreaker
Zhong Long Wu
RBreaker Gold Indicators é uma estratégia de negociação intradiária de curto prazo para futuros de ouro que combina duas abordagens: o seguimento de tendência e as reversões intradiárias. Ela permite capturar lucros durante mercados em tendência e também realizar lucros oportunamente e operar na direção oposta quando o mercado se reverte. Esta estratégia foi classificada por 15 anos consecutivos entre as dez estratégias de negociação mais lucrativas pela revista americana Futures Truth. Ela pos
What Is Trend Master Pro? Trend Master Pro   is a professional-grade trend trading indicator built for MetaTrader 5. It was designed with one goal in mind — to keep you on the right side of the market at all times by combining three powerful technical tools into a single, clean, easy-to-read display directly on your price chart. Instead of cluttering your screen with multiple separate indicators, Trend Master Pro fuses an   EMA Ribbon trend filter , a   ZigZag swing point engine , and a   breako
SPECIAL LAUNCH OFFER: $30 (1-Month Rent) Limited time offer to build our community and gather feedback! AmbM GOLD Institutional Scalper A high-precision M5 algorithm for XAUUSD (Gold) , engineered to trade exclusively at Institutional Liquidity Levels ($5/$10 psychological marks). PERFORMANCE DATA (BUY ONLY) • Win Rate: 87.09%. • Safe Growth: +$4,113 profit on $10k (13.75% Max Drawdown). • Extreme Stress Test: Successfully generated +$22,997 in a 5-year stress test (2020-2026), proving
Your Trend Friend
Luigi Nunes Labigalini
5 (1)
A tendência é sua amiga! Veja a cor do indicador e faça suas operações nessa direção. Ele não repinta. Ou seja, depois que cada candle se fecha, a cor dele é definitiva e não irá se alterar. Você pode focar em movimentos mais curtos e rápidos ou tendências mais longas, basta testar o que melhor se encaixa no seu operacional de acordo com o ativo e tempo gráfico usado. Altere o parâmetro de entrada "Length" e o indicador irá se adaptar automaticamente (quanto maior ele for, maior a tendência an
STRICTLY FOR BOOM INDEX ONLY!!!!! Here I bring the Maximum Trend Arrows OT1.0 MT5 indicator. This indicator is made up of a combination of different trend indicators for entries and exits, for entries an orange arrow will paint on the chart below the current market and a red flag for closing of trades and it produces buy arrows only. When the orange arrow appears, it will appear along with it's sound to notify you. The 1H timeframe is recommended, don't use it anywhere else than on the 1H timefr
Noize Absorption Index - is the manual trading system that measures the difference of pressure between bears forces and bulls forces. Green line - is a noize free index that showing curent situation. Zero value of index shows totally choppy/flat market.Values above zero level shows how powerfull bullish wave is and values below zero measures bearish forces.Up arrow appears on bearish market when it's ready to reverse, dn arrow appears on weak bullish market, as a result of reverse expectation.
Mine Farm
Maryna Kauzova
Mine Farm is one of the most classic and time-tested scalping strategies based on the breakdown of strong price levels. Mine Farm is the author's modification of the system for determining entry and exit points into the market... Mine Farm - is the combination of great potential with reliability and safety. Why Mine Farm?! - each order has a short dynamic Stop Loss - the advisor does not use any risky methods (averaging, martingale, grid, locking, etc.) - the advisor tries to get the most
Fabii Half Trend Baseline
Fabien Georges Andre Guillemaud
Pare de operar contra a tendência do timeframe superior. Duas baselines, um gráfico. Sem repaint. Qualquer par, qualquer timeframe. No seu gráfico em 2 minutos. Demo gratuita no Strategy Tester. Get more indicators here Baselines, volatility filters and oscillators. No repaint. Por que você precisa Você entra em uma operação porque uma linha ficou verde no seu gráfico. Depois abre um timeframe superior e vê que a tendência maior aponta para o outro lado. O sinal era real. A tendência ao redor
Fibaction
Abdelkhalek Orabi
Indicator Name: Fibaction – price action candle Detector Description: Fibo Signal Boxes is a powerful Smart Money Concept (SMC)-inspired indicator that auto-detects price action candles. bullish hammers and shooting stars, then draws precise Fibonacci entry zones and multiple take-profit levels directly on the chart. as for the SL personally i use 40 pips rules  Key Features: Detects bullish hammer and shooting star reversal candles. Automatically draws Fibonacci entry and TP boxes. as
Max Min Delta Indicator - Market Volume Imbalance Analysis Gain Deeper Insights into Market Volume Imbalance with Delta Analysis What is the Max Min Delta Indicator? The Max Min Delta Indicator is a powerful market volume analysis tool that visually represents maximum and minimum delta values using a histogram. It helps traders identify market strength, weakness, absorption, and aggressive buying/selling activity with precision. Key Features Histogram Visualization: Displays Max Delta (Green) an
Histograma de Rendimento L&S Caicai Aviso Importante: Este indicador é uma ferramenta integrante do robô automatizado EA Caicai Long and Short Pair Trading . Este indicador exibe visualmente o desvio percentual (Yield %) do spread atual de um par em relação à sua própria média histórica. É excelente para visualizar rapidamente o potencial financeiro bruto de uma distorção. Principais Funcionalidades: Visualização em Percentual: Entenda facilmente o tamanho da distorção em termos percentuais. Múl
ONNYX INDICATOR versão 1.14 Indicador de oferta e demanda para MetaTrader 5 com sinais confirmados sem repaint. Detecta pivôs confirmados, ajusta a largura das zonas pelo ATR, exibe a qualidade em porcentagem e desenha setas BUY/SELL em candles fechados. PRINCIPAIS RECURSOS - Zonas de oferta e demanda com pontuação percentual dentro da zona. - Setas BUY/SELL ampliadas após o fechamento do candle. - Filtro de tendência por EMA e confirmação opcional de rejeição. - Painel de tendência, níveis e co
BTC Trend Scalper MT5 Trend Capture Edition — Precision Momentum Trading for BTCUSD Hello, traders! I am BTC Trend Scalper MT5 — an intelligent Bitcoin trading Expert Advisor engineered to capture momentum moves with disciplined risk management. I am not a martingale. I am not a grid system. I am not a gambling robot. I am a trend-following scalper built specifically for traders who understand that protecting capital is more important than chasing every candle. My specialty? Bitcoin (BTCUSD)
PipFinite Trend PRO MT5
Karlo Wilson Vendiola
4.84 (562)
Breakthrough Solution For Trend Trading And Filtering With All Important Features Built Inside One Tool! Trend PRO's smart algorithm detects the trend, filters out market noise and gives entry signals with exit levels. The new features with enhanced rules for statistical calculation improved the overall performance of this indicator. Important Information Revealed Maximize the potential of Trend Pro, please visit www.mql5.com/en/blogs/post/713938 The Powerful Expert Advisor Version Automatin
EMA256 Fourier Cycle Trader EMA256 Fourier Cycle Trader is an advanced MetaTrader 5 Expert Advisor combining a long-term EMA or TEMA trend model, causal Fourier cycle analysis, configurable averaging and a unified basket take-profit system. The Expert Advisor is designed primarily for CENT accounts and for traders who understand basket recovery strategies, geometric lot progression and the risks associated with trading without a mandatory Stop Loss. RECOMMENDED STARTING CONFIGURATION Recommended
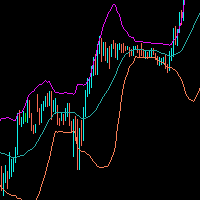
Bollinger Bands are a technical analysis tool that consists of a set of three lines plotted on a price chart. The middle line is a simple moving average, usually of 20 periods, and the upper and lower lines represent the standard deviation of the price from the moving average. The upper band is calculated by adding two standard deviations to the moving average, while the lower band is calculated by subtracting two standard deviations from the moving average. This creates a band around the moving
HAS RSI Signal — Indicador de Tendência Profissional com Cálculo de SL/TP O HAS RSI Signal é uma ferramenta de negociação poderosa que combina clássicos comprovados com algoritmos modernos de filtragem de ruído. O indicador analisa o mercado através das velas Heiken Ashi Smoothed (HAS) e do oscilador RSI , fornecendo sinais de entrada claros em momentos de reversão de tendência ou na saída de zonas de sobrecompra/sobrevenda. Principais Vantagens: Filtragem Dupla: O uso do Heiken Ashi Smoothed pe
Divergent Stochastic Filter II Catch Reversals Early, Filter Noise, Trade with Confidence The Edge: Why This Stochastic is Different  Every trader knows the Stochastic oscillator. But knowing when to trust its signals, that's the real challenge. The Divergent Stochastic Filter II transforms this classic indicator into a precision reversal detection system by adding critical elements: divergence intelligence, signal filtering and exhaustion detection.  While standard Stochastic oscillators fire s
Liquidity Oscillator
Paolo Scopazzo
3 (2)
A powerful oscillator that provide Buy and Sell signals by calculating the investor liquidity. The more liquidity the more buy possibilities. The less liquidity the more sell possibilities. Please download the demo and run a backtest! HOW IT WORKS: The oscillator will put buy and sell arrow on the chart in runtime only . Top value is 95 to 100 -> Investors are ready to buy and you should follow. Bottom value is 5 to 0 -> Investors are ready to sell and you should follow. Alert + sound will appe
# DRAWDOWN INDICATOR V4.0 - The Essential Tool to Master Your Trading ## Transform Your Trading with a Complete Real-Time Performance Overview In the demanding world of Forex and CFD trading, **knowing your real-time performance** isn't a luxury—it's an **absolute necessity**. The **Drawdown Indicator V4.0** is much more than a simple indicator: it's your **professional dashboard** that gives you a clear, precise, and instant view of your trading account status. --- ## Why This Indicator
Fibonacci Sniper XAUUSD
Luis Paulo de Oliveira
GOLD FIBONACCI SNIPER M5 Descrição O GOLD FIBONACCI SNIPER M5 é um indicador profissional para MetaTrader 5 desenvolvido especialmente para o XAUUSD (ouro) no timeframe M5. O indicador utiliza retrações de Fibonacci combinadas com tendência, volatilidade, rejeição de candles e análise de força do movimento para identificar possíveis pontos de entrada com maior precisão. O sistema procura automaticamente regiões de retração entre os níveis 38.2, 50 e 61.8 de Fibonacci, consideradas áreas instituc
Visual CrossPulse Dynamics Indicator
AL MOOSAWI ABDULLAH JAFFER BAQER
Visual CrossPulse Dynamics: Trade with the Market's True Rhythm Unlock a new level of market insight with Visual CrossPulse Dynamics, a sophisticated trading indicator designed to adapt to ever-changing volatility and reveal the true direction of the trend. Are you tired of indicators that lag in fast-moving markets or give false signals during consolidation? The Visual CrossPulse Dynamics indicator solves this problem by using an advanced, adaptive algorithm that intelligently adjusts to the m
"Impulses and Corrections 5" is created to help traders navigate the market situation. The indicator shows multi-time frame upward and downward "Impulses" of price movements. These impulses are the basis for determining the "Base" , which is composed of zones of corrections of price movements, as well as "Potential" zones for possible scenarios of price movement. Up and down impulses are determined based on a modified formula of Bill Williams' "Fractals" indicator. The last impulse is always "U
MQL5 Market Listing: Bollinger Pro Bollinger Pro   is an advanced signal-based indicator designed to simplify market analysis by identifying high-probability entry points. Unlike standard Bollinger Band indicators that only show volatility channels, Bollinger Pro utilizes a proprietary algorithm to detect market conditions—whether the market is trending or sideways—and prints direct Buy/Sell signals on the chart. The indicator is designed for traders who seek a "clean chart" experience while mai
Dewa Scalper Feel Good
Pupung Widiyapurnama
Dewa Scalper Feel Good EA Description Dewa Scalper Feel Good EA is an advanced automated trading solution engineered for consistent, stress-free capital growth. Built on precise multi-candle momentum patterns, this Expert Advisor captures high-probability market swings on the H1 timeframe while keeping risk strictly under control. It combines a smart switching entry model with a disciplined Break-Even Point (BEP) recovery algorithm and automated auto-compounding. Unlike conventional high-risk gr
C88 Projected Candle See the Bigger Picture Before the Candle Closes C88 Projected Candle is a professional market visualization indicator that projects the current higher timeframe candle directly onto your active chart. It helps traders understand the evolving market structure without constantly switching between timeframes. Whether you trade Price Action, ICT, Smart Money Concepts (SMC), or Volume Profile, this indicator provides a cleaner and more intuitive way to read market context. Key Fe
Smart Support And Resistance Indicator See the Market Levels That Matter. Make your chart clearer and your technical analysis more organized with Smart Support And Resistance Indicator — a powerful trading tool designed to help traders identify important support and resistance levels directly on their MetaTrader 5 charts. Whether you trade Forex, Gold, Indices, or other available markets, this indicator helps you focus on key price areas, monitor potential market reactions, and analyze price act
SMC Smart Flow Pro
Thitipong Nookhunthod
Short Description: SMC Smart Flow Pro is an advanced Smart Money Concept indicator that automatically detects Break of Structure (BOS), Change of Character (CHoCH), and projects precise TP/SL target levels on all timeframes — built for serious traders who trade with institutional flow. Full Description: SMC Smart Flow Pro is a premium Smart Money Concept (SMC) indicator for MetaTrader 5, engineered for traders who want to trade alongside institutional order flow. By automatically mapping m
NQX Range Edge Hook Weekly Bias é um indicador de sinais para MetaTrader 5: sinais de gancho na borda do range (só sinaliza na direção do viés semanal). Lógica NQX proprietária que detecta o preço saindo da borda do seu range recente, confirmado pelo candle. Só sinaliza na direção do viés semanal. Desenha a entrada sugerida, um stop curto e alvos longos (3:1, 5:1, 10:1, até 20:1 no swing); você decide. O que ele desenha no gráfico - Uma seta no candle de sinal fechado (nunca repinta um sinal fec
Os compradores deste produto também adquirem
Trend Sniper X
Sarvarbek Abduvoxobov
4.86 (44)
Trend Sniper X é um indicador de acompanhamento de tendência para múltiplos tempos gráficos no MetaTrader 5 que ajuda os traders a identificar a direção da tendência e potenciais pontos de reversão com clareza e precisão. para MT4: https://www.mql5.com/en/market/product/193245 Informações sobre o preço: O preço atual é promocional e está sujeito a alterações à medida que novas atualizações e funcionalidades forem lançadas. Oferta Bônus: Para obter o Auto-Trade Assistant EA GRATUITO para este in
O Entry Points Pro mostra onde entrar, onde colocar o stop e com qual lote operar — antes de você colocar a ordem. PREÇO Agora 149 USD, e esta é a última cópia por este preço. Depois o preço sobe para 199 USD, e o preço final é 349 USD. Eu ganho meu dinheiro operando nos mercados e mostro isso, por isso não preciso vender este indicador para todo mundo. É uma ferramenta para traders que pensam por conta própria, não um botão mágico. A seta aparece no fechamento da vela e não repinta. Duas confi
Gann Made Easy   é um sistema de negociação Forex profissional e fácil de usar, baseado nos melhores princípios de negociação usando a teoria do sr. W. D. Gann. O indicador fornece sinais precisos de COMPRA e VENDA, incluindo níveis de Stop Loss e Take Profit. Você pode negociar mesmo em movimento usando notificações PUSH. Entre em contato comigo após a compra para receber instruções de negociação e ótimos indicadores extras gratuitamente! Provavelmente você já ouviu muitas vezes sobre os método
Ultra Indicator
Ihor Otkydach
5 (1)
O ULTRA é um indicador técnico que funciona numa base «tudo-em-um» — analisa o mercado de forma independente, gera sinais de negociação, apresenta níveis para definir ordens de stop-loss e sugere quando encerrar as negociações para garantir lucros ou minimizar perdas. Por outras palavras, não importa se não sabe analisar o mercado, determinar níveis — onde definir o seu stop-loss — ou se tem dificuldades com a gestão do capital. O ULTRA fará tudo isso por si! BÓNUS PARA O COMPRADOR: Após adquiri
Boba Analysis Suite
Trade Ready Solutions LLC
5 (2)
Boba Analysis Suite O Boba Analysis Suite é um indicador de análise para o MetaTrader 5. Reúne a estrutura do mercado, as zonas de preço relevantes e o contexto geral do mercado numa única visualização do gráfico. Desenvolvido a partir da experiência prática como trader e formador de traders, apoia um processo de análise estruturado: avaliar a direção do mercado, identificar níveis importantes e analisar vários períodos gráficos em conjunto. Análise em contexto O significado de cada sinal depend
Próxima Atualização — Versão 2.52 em Breve! [NOVO] Prepare-se para 4 Grandes Novos Recursos Projetados para Aprimorar sua Análise de Mercado e seu Fluxo de Trabalho de Trading Estamos levando a análise de mercado a um novo nível com 4 novos recursos desenvolvidos para atender às suas necessidades de trading. Apresentamos: 1. TRADE OVERVIEW DASHBOARD 2. CONFLUENCE AT ZONE 3. STRONG & WEAK HIGH/LOW 4. OTE 1. TRADE OVERVIEW DASHBOARD Um painel que ajuda você a compreender mais facilmente o panoram
M1 Sniper MT5
Oleg Rodin
5 (7)
O   M1 SNIPER   é um sistema indicador de negociação fácil de usar. É um indicador de seta projetado para o período M1. O indicador pode ser usado como um sistema independente para scalping no período M1 e pode ser usado como parte do seu sistema de negociação existente. Embora este sistema de negociação tenha sido projetado especificamente para negociação no M1, ele também pode ser usado em outros períodos. Originalmente, desenvolvi este método para negociar XAUUSD e BTCUSD. Mas considero-o úti
FiboSniper Pro
Van Minh Nguyen
5 (4)
FiboSniper Pro – Multi-Filter Fibonacci System with Auto SL/TP and Control Panel FiboSniper Pro é um indicador técnico que combina Fibonacci Envelopes dinâmicos com vários filtros de confirmação para gerar sinais seletivos de Buy e Sell. Os níveis de Fibonacci são calculados com base em Moving Average e ATR e, em seguida, filtrados por ADX, EMA, RSI, ATR, Volume, Time e estrutura das velas. O indicador exibe diretamente no gráfico os níveis automáticos de Stop Loss e Take Profit baseados em ATR,
Auto Optimized SpeedAngle é um sistema de vetorização de momentum de nível institucional que elimina o sobreajuste ( curve-fitting ) por meio da otimização contínua de avanço ( Walk-Forward Optimization , WFO). Em vez de depender de entradas estáticas que se degradam quando os regimes de mercado mudam, o indicador recalibra dinamicamente seus parâmetros utilizando validação fora de amostra ( Out-of-Sample , OOS), garantindo que os sinais exibidos representem vantagens estatísticas genuínas e não
Adaptive Price Action Engine Compre um indicador, ganhe o EA de graça Análise Auto-Otimizada de Tendências e Padrões de Candlestick em Múltiplos Timeframes Os mercados estão em constante mudança, e nem todos os padrões de Price Action têm o mesmo valor em todas as condições de mercado. O Adaptive Price Action Engine foi desenvolvido para se adaptar às mudanças nas condições do mercado, combinando estrutura de tendência, análise Multi-Timeframe, padrões de candlestick e otimização estatística em
Crystal Heikin Ashi Signals
Muhammad Jawad Shabir
5 (5)
Crystal Heikin Ashi Signals—Professional Trend & Signal Detection Indicator Advanced Heikin Ashi Visualization with Intelligent Signal System for Manual & Automated Trading Final Price: $149 ---------> Price goes up $10 after every 10 sales . Limited slots available — act fast . Overview User Guide PDF Crystal Heikin Ashi Signals is a professional-grade MetaTrader 5 indicator that combines pure Heikin Ashi candle visualization with an advanced momentum-shift detection system. Designed for both m
O Scalper Vault é um sistema de negociação poderoso e completo, projetado para traders que buscam consistência em operações intraday. Este indicador de alta precisão funciona como um sistema de negociação autônomo, oferecendo análises de nível institucional tanto para o mercado Forex quanto para Opções Binárias. ENTRE EM CONTATO COMIGO APÓS A COMPRA PARA RECEBER DICAS DE NEGOCIAÇÃO E UM BÔNUS EXCLUSIVO! Ao eliminar suposições e análises manuais complexas, o Scalper Vault permite que você foque
SIO Oscillator: oscilador auto-otimizável de desequilíbrio de semivariância Compre o indicador e receba GRÁTIS o Expert Advisor (EA) baseado nele. A maioria dos osciladores trata todo movimento de preço da mesma forma. O SIO separa a pressão de alta da pressão de baixa e mede o desequilíbrio entre elas, mostrando qual lado realmente controla o mercado: compradores ou vendedores. Quando o desequilíbrio atinge um extremo, o SIO gera um sinal claro com níveis de entrada, Stop Loss e Take Profit. O
Volatility Master for MetaTrader is a real-time dashboard tool that scans up to  50 symbols  to identify high-volatility , trending markets instantly. With bullish/bearish signals, customizable alerts, and a user-friendly interface, it helps you avoid range-bound conditions and focus on high-probability trades. Clarity leads to confidence. Trade confidently and protect your capital effectively with this powerful dashboard. We don't offer free or bonus indicators in exchange of reviews from you.
Indicador multimoedas de força e momentum MT5 Dynamic Forex28 Navigator é a evolução dos nossos indicadores populares de longa data e reúne a potência de três ferramentas numa só: Advanced Currency Strength28 Indicator (700 avaliações) Advanced Currency IMPULSE with ALERT (530 avaliações) CS28 Combo Signals (bónus atual) Os dois indicadores anteriores somam mais de 1.200 avaliações no MQL5 Market e são uma referência na comunidade MT4 desde 2016. O Dynamic Forex28 Navigator MT5 continua com a me
AriFocus
Temirlan Kdyrkhan
AriFocus - Non-Repainting Buy/Sell Signals AriFocus - one clear signal. AriFocus marks buy and sell signals directly on the chart and suggests a stop-loss level for each one. Every signal is confirmed on bar close and never repaints. - Buy/sell arrows, confirmed on bar close - Suggested stop-loss level for every signal - Trend band and candle coloring to show direction at a glance - 10 ready-made presets, or your own settings (14 calculation methods) - Pop-up, push and email alerts with entr
Neuro Poseidon MT5
Daria Rezueva
4.68 (53)
Neuro Poseidon is a new indicator by Daria Rezueva. It combines precise trading signals with adaptive TP/SL levels - creating best possible trades as a result! Message me and get  Neuro Poseidon Assistant  as a gift to automize your trading process! What makes it stand out? 1. Proven profitability on all assets and timeframes 2. Only confirmed BUY and SELL signals present on the chart 3. Adaptive TP & SL levels generated by the software for each trade 4. Easy to understand - suitable for al
PZ Swing Trading MT5
PZ TRADING SLU
5 (5)
Swing Trading é o primeiro indicador projetado para detectar oscilações na direção da tendência e possíveis oscilações de reversão. Ele usa a abordagem de negociação de linha de base, amplamente descrita na literatura de negociação. O indicador estuda vários vetores de preço e tempo para rastrear a direção da tendência agregada e detecta situações nas quais o mercado está sobrevendido ou sobrecomprado em excesso e pronto para corrigir. [ Guia de instalação | Guia de atualização | Solução de prob
Azimuth Pro
Ottaviano De Cicco
5 (7)
Azimuth Pro V2: Estrutura Fractal Sintética e Entradas Confirmadas para MT5 Visão geral Azimuth Pro é um indicador de estrutura swing multinível da Merkava Labs . Quatro camadas de swing aninhadas, VWAP ancorado em swings, detecção de padrões ABC, filtragem estrutural de três timeframes e entradas confirmadas em barra fechada — um gráfico, um fluxo de trabalho dos micro-swings aos macro-ciclos. Este não é um produto de sinais cegos. É um fluxo de trabalho baseado em estrutura para traders que v
SkyHammer Signal Pro Indicador profissional de sinais de tendência sem repaint, com níveis Entry, SL e TP bloqueados SkyHammer Signal Pro é um indicador estruturado de tendência e momentum, desenvolvido para traders que procuram sinais claros, fixos e verificáveis. Funciona melhor em timeframes baixos, como M1 e M5 . O indicador não tenta prever topos ou fundos do mercado. Em vez disso, ele aguarda estrutura de mercado confirmada, direção de tendência, força de momentum, volatilidade saudável e
Advance AI Scanner
Mohamed Samsudeen
5 (1)
Advance AI Scanner is a multi-symbol analysis indicator for MetaTrader 5. It scans Forex pairs, metals, energy, stock indices and cryptocurrencies at the same time and rates each instrument with its own self-training model. It explains in plain English what moved each market and why, and it estimates how far upcoming economic news usually moves each symbol, measured on your broker's own price history. $199 instead of $499. 10 copies left at this price. One time purchase  Installation and User
DayTrader PRO
Davit Beridze
5 (4)
DayTrader PRO O DayTrader PRO é um indicador de trading avançado que combina o Filtro de Laguerre de John Ehlers com um potente motor de otimização automática. Em vez de utilizar parâmetros fixos, o indicador procura automaticamente as melhores definições com base nas condições recentes do mercado, ajudando-o a adaptar-se à volatilidade variável sem necessidade de ajustes manuais constantes. O indicador gera sinais claros de COMPRA (BUY) e VENDA (SELL), juntamente com níveis adaptativos de Stop
Bill Williams Advanced
Siarhei Vashchylka
5 (11)
Bill Williams Advanced is designed for automatic chart analysis using Bill Williams' "Profitunity" system. The indicator analyzes four timeframes at once. Manual (Be sure to read before purchasing) Advantages 1. Analyzes the chart using Bill Williams' "Profitunity" system. Signals are displayed in a table in the corner of the screen and on the price chart. 2. Finds all known AO and AC signals, as well as zone signals. Equipped with a trend filter based on the Alligator. 3. Finds "Divergence Bar
Apex Patterns PRO Compre o indicador - Obtenha um Expert Advisor baseado nele GRATUITAMENTE. Inteligência Auto-otimizada de Padrões e Rompimentos Os rastreadores de padrões tradicionais dependem de entradas fixas, frequentemente apresentando baixo desempenho quando a volatilidade e as estruturas do mercado mudam. O Apex Patterns PRO foi projetado para se adaptar às mudanças nas condições do mercado, combinando o reconhecimento estrutural de padrões de gráfico, filtragem de momentum e auto-otimi
Power Candles MT5
Daniel Stein
4.58 (12)
Power Candles V3 - Indicador de força com auto-otimização O Power Candles V3 transforma a força da moeda e do instrumento num plano de negociação prático em todos os gráficos aos quais está associado. Em vez de se limitar a colorir as velas, executa uma otimização automática em tempo real em segundo plano e apresenta-lhe os melhores valores de Stop Loss, Take Profit e limiar de sinal para o símbolo em questão. Basta um clique para o adotar na negociação em tempo real — as linhas de entrada, Stop
O Apollo SR Master é um indicador de Suporte/Resistência com recursos especiais que tornam a negociação com zonas de Suporte/Resistência mais fácil e confiável. O indicador calcula as zonas de Suporte/Resistência em tempo real, sem qualquer atraso, detectando topos e fundos de preço locais. Em seguida, para confirmar a área de Suporte/Resistência recém-formada, o indicador exibe um sinal especial que indica que a zona pode ser considerada e usada como um sinal de VENDA ou COMPRA. Nesse caso, a f
Divergence Bomber
Ihor Otkydach
4.89 (94)
Cada comprador deste indicador recebe adicionalmente, e de forma gratuita: A ferramenta exclusiva "Bomber Utility", que acompanha automaticamente cada operação, define os níveis de Stop Loss e Take Profit e fecha operações de acordo com as regras da estratégia; Arquivos de configuração (set files) para ajustar o indicador em diferentes ativos; Set files para configurar o Bomber Utility nos modos: "Risco Mínimo", "Risco Balanceado" e "Estratégia de Espera"; Um vídeo tutorial passo a passo que a
Superhero
Ihor Otkydach
5 (3)
O indicador SUPERHERO é um sistema de negociação multimoeda concebido numa base «tudo incluído». O indicador analisa o mercado de forma independente e fornece sinais sobre quando abrir e encerrar posições. Utiliza ordens Stop Loss e Take Profit. O rácio R:R é de 1:1. Este sistema pode enviar notificações push para o seu smartphone, para que possa realizar transações «em qualquer lugar», sem precisar de estar preso a um computador. É perfeito para empresas de negociação por conta própria. UM BÓNU
LINHAS DE TENDÊNCIA PRO       Ajuda a entender onde o mercado está realmente mudando de direção. O indicador mostra inversões de tendência reais e pontos onde os principais participantes retornam ao mercado. Você vê     Linhas BOS     Análise de tendências e níveis-chave em prazos maiores — sem configurações complexas ou ruídos desnecessários. Os sinais não são repintados e permanecem no gráfico após o fechamento da barra. VERSÃO MT 4      -      Revela seu potencial máximo quando emparelhada co
Murrey Math Classic
Sarvarbek Abduvoxobov
5 (2)
Murrey Math Classic Murrey Math Classic é um indicador de trading profissional e dinâmico, projetado para prever os movimentos de preços nos mercados financeiros com precisão matemática. O sistema moderniza a lendária geometria de preço-tempo, transformando-a num modelo matemático altamente estruturado e adequado para os mercados financeiros modernos. A lógica central por trás do Murrey Math é que os mercados financeiros não se movem de forma aleatória; eles movem-se num ritmo específico. Assim
Filtro:
Sem comentários
Responder ao comentário