Rising Falling Three Methods

Rising/Falling Three Methods — MT5 Indicator

Automatically identify classic trend continuation patterns directly on your MetaTrader 5 chart.

The Rising/Falling Three Methods Indicator is a technical analysis tool designed to automatically detect the classic Rising Three Methods (R3M) and Falling Three Methods (F3M) candlestick patterns.

The indicator analyzes candle structure, body size, intermediate candle containment, and the final resolution candle to identify potential bullish and bearish continuation formations.

🔥 Key Features

Rising Three Methods (R3M)
Detects potential continuation patterns during bullish movements.

Falling Three Methods (F3M)
Detects potential continuation patterns during bearish movements.

Consolidation Zone
Visually highlights the area where the pattern's consolidation takes place.

Invalidation Level
Displays an optional reference level for monitoring when the formation becomes invalid.

Trend Filter
Uses a Simple Moving Average (SMA) to filter patterns according to the selected trend direction.

Volume Confirmation
Optional volume confirmation can be enabled as an additional filter.

Real-Time Preview
Allows you to monitor a potential formation while the current candle is still developing.

📊 How the Indicator Detects the Pattern

The system looks for a sequence consisting of:

1. A strong initial candle
2. Smaller intermediate candles contained within the pattern area
3. A final resolution candle confirming the movement

The indicator automatically evaluates:

  • Direction of the first candle;

  • Candle body size;

  • Size of the intermediate candles;

  • Containment of the intermediate candles;

  • Closing position of the final intermediate candle;

  • Breakout beyond the first candle's closing price;

  • Volume, when enabled;

  • Trend direction using the SMA, when enabled.

🎯 Clear Visual Identification

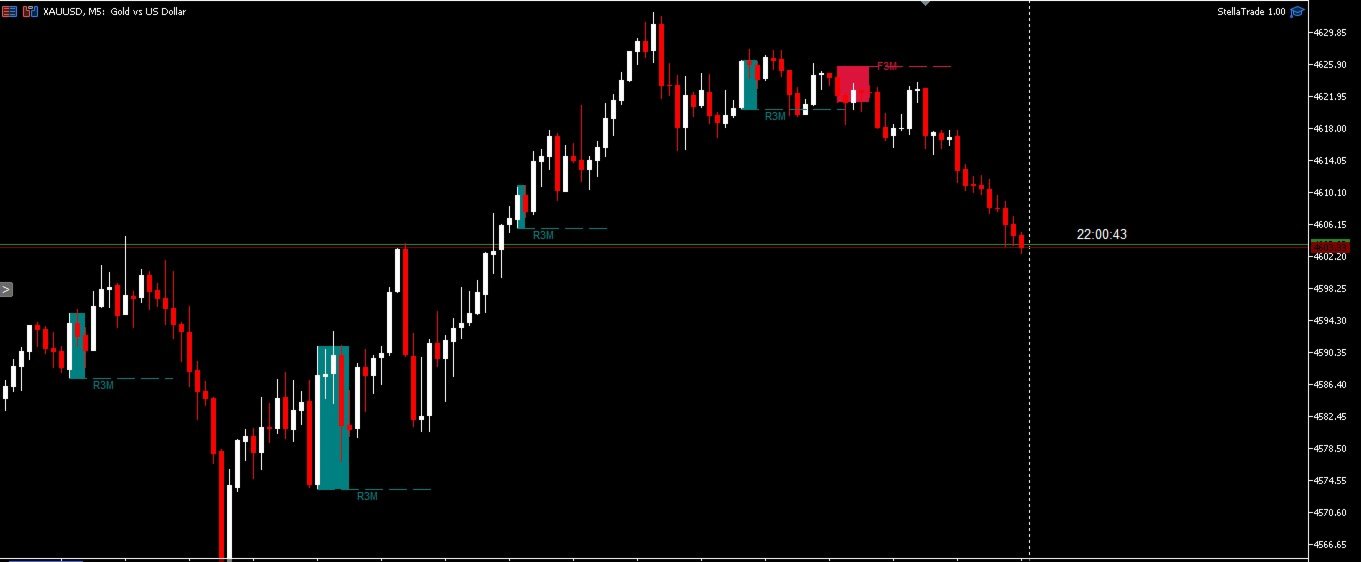
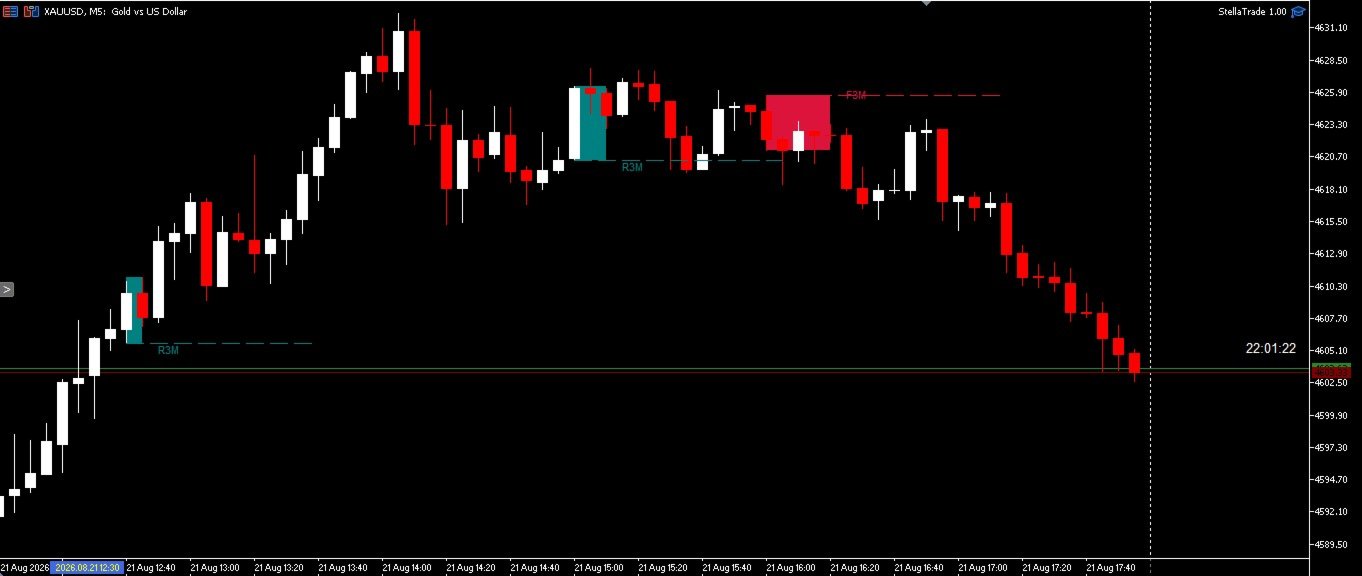
After a pattern is confirmed, the indicator displays directly on the chart:

R3M — Rising Three Methods
Potential bullish continuation.

F3M — Falling Three Methods
Potential bearish continuation.

The consolidation area is highlighted visually, and the invalidation level can be displayed automatically.

⚙️ Customizable Settings

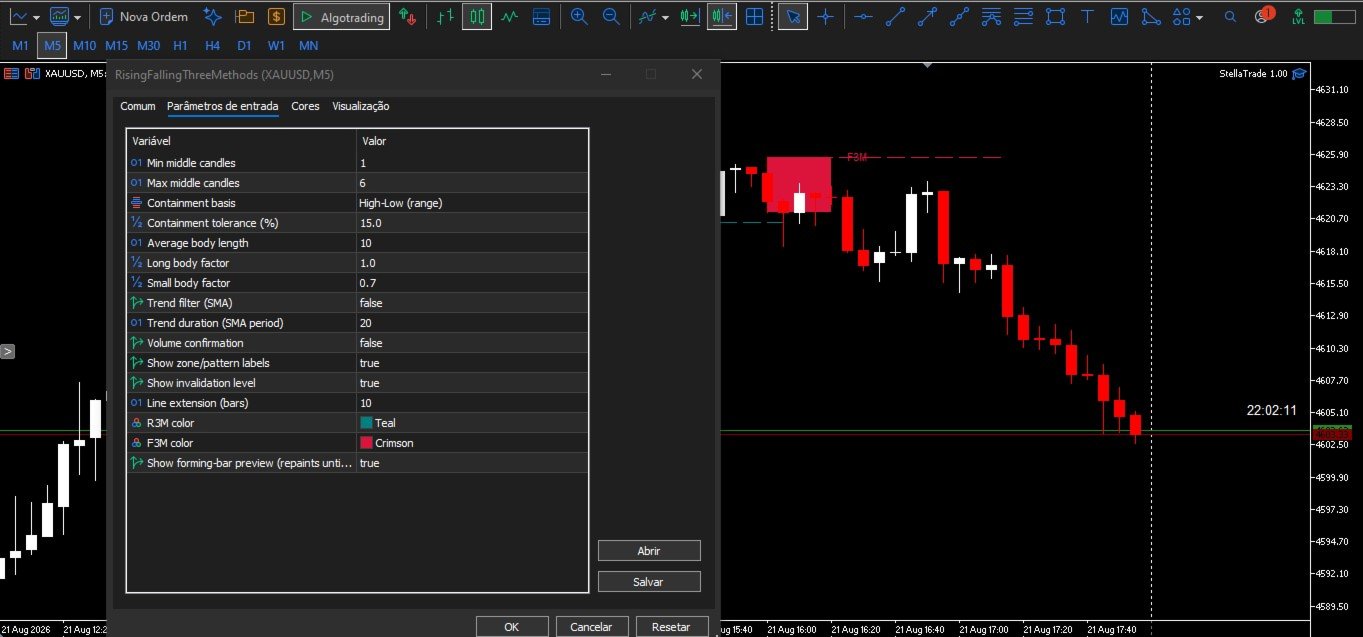
The indicator provides multiple adjustable parameters:

  • Minimum number of intermediate candles;

  • Maximum number of intermediate candles;

  • Containment basis;

  • Containment tolerance;

  • Average candle-body period;

  • Long-body factor;

  • Small-body factor;

  • Trend filter;

  • SMA period;

  • Volume confirmation;

  • Zone labels;

  • Invalidation level;

  • Invalidation line extension;

  • Bullish and bearish colors;

  • Real-time preview.

⚡ Real-Time Pattern Preview

The Real-Time Preview feature allows you to monitor a potential formation while the current candle is still open.

Important: Because the current candle is still developing, the preview may change before the candle closes. Confirmed patterns are evaluated only after the candle has closed.

💻 Indicator Information

Platform: MetaTrader 5
Type: Patterns / Trend / Volume
Markets: Forex, Indices, Commodities, Cryptocurrencies and other instruments available on MT5
Patterns: Rising Three Methods & Falling Three Methods

⚠️ Disclaimer

This indicator is a technical analysis and pattern-recognition tool.

It does not guarantee trading results and does not constitute financial or investment advice.

Always use proper risk management and test the indicator before using it on a live trading account.
Другие продукты этого автора
Buy Sell Strength Realtime displays buying and selling pressure directly on each candle of the main chart, with no separate window needed. For each bar, the indicator calculates the proportion of buyers and sellers based on the close position within the bar range (high and low), multiplied by tick volume. Results appear as: Green number below the low — buying strength Red number above the high — selling strength Instantly identify which side is dominating bar by bar, without switching wind
Buy vs Sell Flow Indicator for MT4 See Buying Force and Selling Force in Real Time. The Buy vs Sell Flow Indicator is a powerful MT4 trading tool designed to help traders visualize estimated buying and selling pressure directly on the chart. The indicator displays the Buying Force and Selling Force for each candle, allowing you to quickly analyse market activity and understand which side is showing greater strength. Key Features Real-time Buying Force and Selling Force Bar-by-bar market flow ana
Trap Detector PRO
Hericlezia Andrade Assuncao
Trap Detector PRO — MT4 Detect potential market traps, absorption, fake breakouts, exhaustion and confirmed market flow directly on your chart. The Trap Detector PRO is an advanced indicator for MetaTrader 4 , designed to help traders identify different market conditions through the analysis of tick volume, candle range, price movement and estimated buying/selling pressure . KEY DETECTIONS STOP HUNT Identifies potential stop-hunt movements where price breaks a previous level with increase
Volume Delta indicator that separates buy and sell volume per bar using the proportional method (close position within the bar range). Displays buy volume (white histogram), sell volume (red histogram), and a configurable moving average of total volume. Optional numeric labels show exact values on chart. Works on any symbol and timeframe with tick volume. Inputs: Period for MA, show numbers toggle, font size, number of bars with labels, buy/sell label colors.
Automatic Support & Resistance Signals Определяйте уровни поддержки и сопротивления с помощью простых точек Automatic Support & Resistance Signals — профессиональный индикатор для MetaTrader 5 , разработанный для автоматического определения потенциальных уровней поддержки и сопротивления на основе структуры недавнего движения цены. Вместо множества линий и прямоугольников индикатор использует простые цветные точки непосредственно на графике , позволяя быстро визуально определить важные уровни.
Candle Patterns Pro Автоматическое определение свечных паттернов в MetaTrader 5 Candle Patterns Pro — профессиональный индикатор для MetaTrader 5, который автоматически обнаруживает ключевые свечные паттерны непосредственно на графике. Индикатор помогает трейдерам быстрее находить потенциальные точки разворота, продолжения движения и изменения силы рынка без необходимости вручную анализировать каждую свечу. Поддерживаемые паттерны Hammer — Молот Inverted Hammer — Перевёрнутый молот Hanging Man —
Buying vs Selling Force + Trap Detector See the Force Behind Price Movement Buying vs Selling Force + Trap Detector is an advanced MetaTrader 5 indicator designed to analyze the relationship between buying pressure, selling pressure, volume, and price action , helping traders identify potentially significant market events directly on the chart. In addition to displaying estimated buying and selling force for each candle, the indicator includes a powerful Trap Detector designed to identify potent
Фильтр:
Нет отзывов
Ответ на отзыв