Rising Falling Three Methods

Rising/Falling Three Methods — MT5 Indicator

Automatically identify classic trend continuation patterns directly on your MetaTrader 5 chart.

The Rising/Falling Three Methods Indicator is a technical analysis tool designed to automatically detect the classic Rising Three Methods (R3M) and Falling Three Methods (F3M) candlestick patterns.

The indicator analyzes candle structure, body size, intermediate candle containment, and the final resolution candle to identify potential bullish and bearish continuation formations.

🔥 Key Features

Rising Three Methods (R3M)
Detects potential continuation patterns during bullish movements.

Falling Three Methods (F3M)
Detects potential continuation patterns during bearish movements.

Consolidation Zone
Visually highlights the area where the pattern's consolidation takes place.

Invalidation Level
Displays an optional reference level for monitoring when the formation becomes invalid.

Trend Filter
Uses a Simple Moving Average (SMA) to filter patterns according to the selected trend direction.

Volume Confirmation
Optional volume confirmation can be enabled as an additional filter.

Real-Time Preview
Allows you to monitor a potential formation while the current candle is still developing.

📊 How the Indicator Detects the Pattern

The system looks for a sequence consisting of:

1. A strong initial candle
2. Smaller intermediate candles contained within the pattern area
3. A final resolution candle confirming the movement

The indicator automatically evaluates:

  • Direction of the first candle;

  • Candle body size;

  • Size of the intermediate candles;

  • Containment of the intermediate candles;

  • Closing position of the final intermediate candle;

  • Breakout beyond the first candle's closing price;

  • Volume, when enabled;

  • Trend direction using the SMA, when enabled.

🎯 Clear Visual Identification

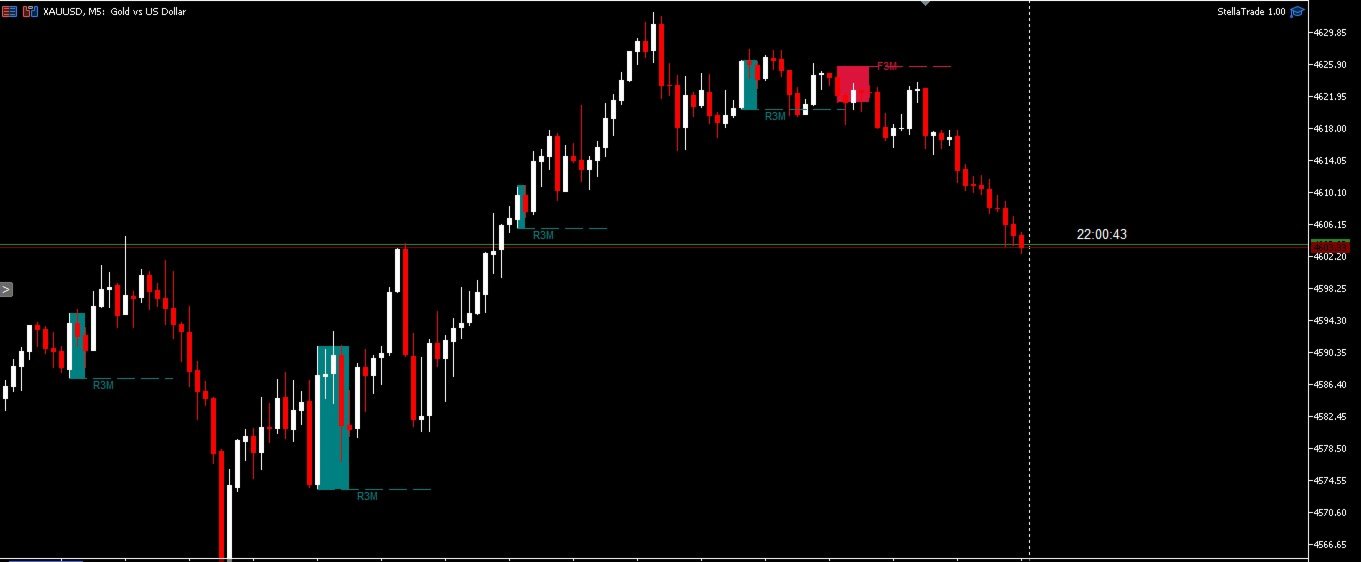
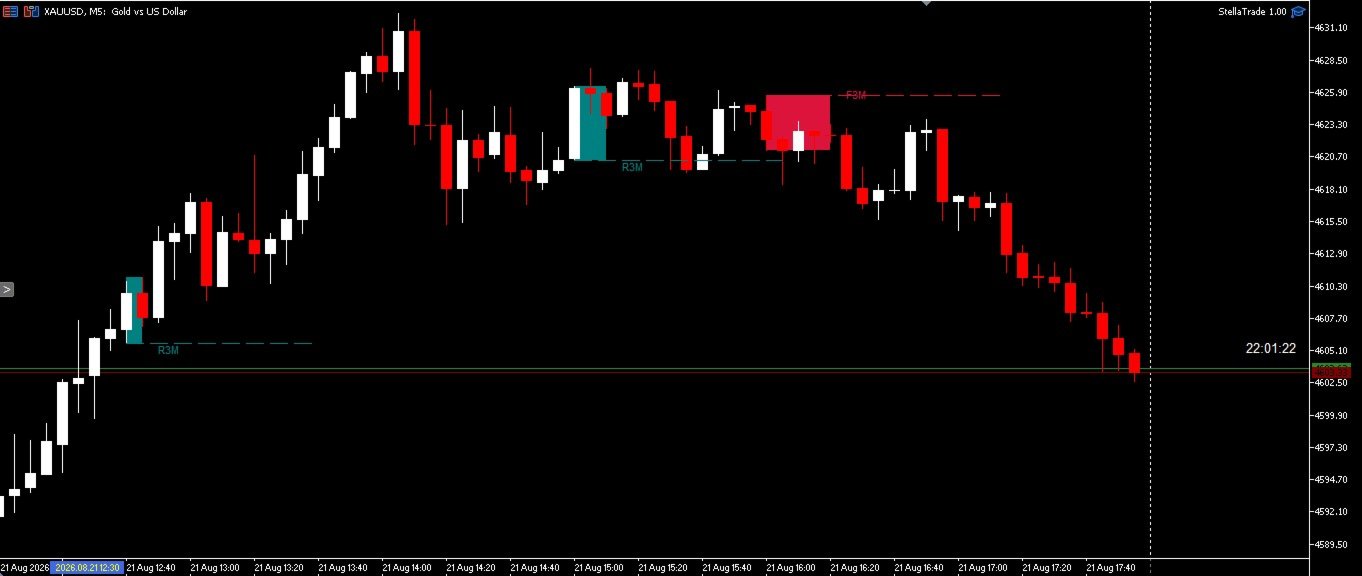
After a pattern is confirmed, the indicator displays directly on the chart:

R3M — Rising Three Methods
Potential bullish continuation.

F3M — Falling Three Methods
Potential bearish continuation.

The consolidation area is highlighted visually, and the invalidation level can be displayed automatically.

⚙️ Customizable Settings

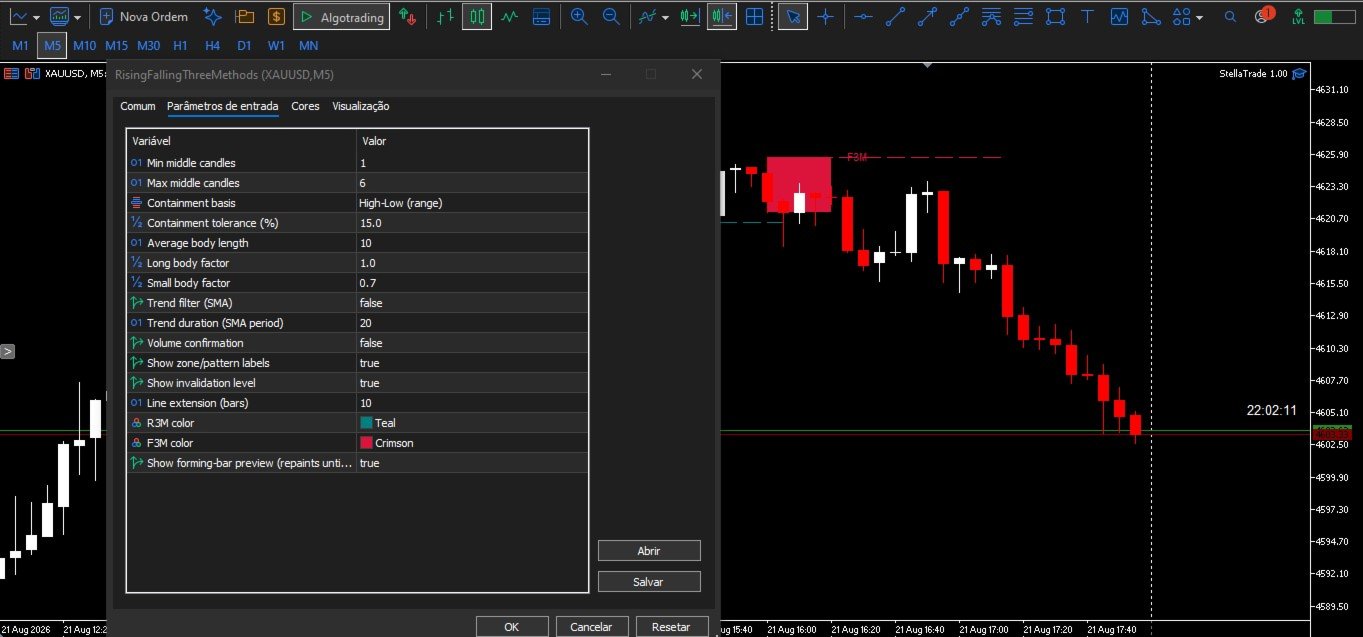
The indicator provides multiple adjustable parameters:

  • Minimum number of intermediate candles;

  • Maximum number of intermediate candles;

  • Containment basis;

  • Containment tolerance;

  • Average candle-body period;

  • Long-body factor;

  • Small-body factor;

  • Trend filter;

  • SMA period;

  • Volume confirmation;

  • Zone labels;

  • Invalidation level;

  • Invalidation line extension;

  • Bullish and bearish colors;

  • Real-time preview.

⚡ Real-Time Pattern Preview

The Real-Time Preview feature allows you to monitor a potential formation while the current candle is still open.

Important: Because the current candle is still developing, the preview may change before the candle closes. Confirmed patterns are evaluated only after the candle has closed.

💻 Indicator Information

Platform: MetaTrader 5
Type: Patterns / Trend / Volume
Markets: Forex, Indices, Commodities, Cryptocurrencies and other instruments available on MT5
Patterns: Rising Three Methods & Falling Three Methods

⚠️ Disclaimer

This indicator is a technical analysis and pattern-recognition tool.

It does not guarantee trading results and does not constitute financial or investment advice.

Always use proper risk management and test the indicator before using it on a live trading account.
Altri dall’autore
Buy vs Sell Force Real Time
Hericlezia Andrade Assuncao
Buy Sell Strength Realtime displays buying and selling pressure directly on each candle of the main chart, with no separate window needed. For each bar, the indicator calculates the proportion of buyers and sellers based on the close position within the bar range (high and low), multiplied by tick volume. Results appear as: Green number below the low — buying strength Red number above the high — selling strength Instantly identify which side is dominating bar by bar, without switching wind
Buy vs Sell Flow Intensity
Hericlezia Andrade Assuncao
Buy vs Sell Flow Indicator for MT4 See Buying Force and Selling Force in Real Time. The Buy vs Sell Flow Indicator is a powerful MT4 trading tool designed to help traders visualize estimated buying and selling pressure directly on the chart. The indicator displays the Buying Force and Selling Force for each candle, allowing you to quickly analyse market activity and understand which side is showing greater strength. Key Features Real-time Buying Force and Selling Force Bar-by-bar market flow ana
Trap Detector PRO
Hericlezia Andrade Assuncao
Trap Detector PRO — MT4 Detect potential market traps, absorption, fake breakouts, exhaustion and confirmed market flow directly on your chart. The Trap Detector PRO is an advanced indicator for MetaTrader 4 , designed to help traders identify different market conditions through the analysis of tick volume, candle range, price movement and estimated buying/selling pressure . KEY DETECTIONS STOP HUNT Identifies potential stop-hunt movements where price breaks a previous level with increase
Volume Delta Buy Sell Histogram
Hericlezia Andrade Assuncao
Volume Delta indicator that separates buy and sell volume per bar using the proportional method (close position within the bar range). Displays buy volume (white histogram), sell volume (red histogram), and a configurable moving average of total volume. Optional numeric labels show exact values on chart. Works on any symbol and timeframe with tick volume. Inputs: Period for MA, show numbers toggle, font size, number of bars with labels, buy/sell label colors.
Automatic Support & Resistance Signals Identifica supporti e resistenze con semplici punti colorati Automatic Support & Resistance Signals è un indicatore professionale per MetaTrader 5 , progettato per identificare automaticamente potenziali livelli di supporto e resistenza sulla base della recente struttura del prezzo. Invece di riempire il grafico con linee e rettangoli, l’indicatore utilizza semplici punti colorati direttamente sul grafico , offrendo una visualizzazione pulita, intuitiva e i
Candle Patterns detector Pro
Hericlezia Andrade Assuncao
Candle Patterns Pro Indicatore professionale di pattern candlestick per MetaTrader 5 Candle Patterns Pro è un indicatore professionale per MetaTrader 5 che rileva automaticamente i principali pattern di candele giapponesi direttamente sul grafico. Aiuta i trader a individuare più rapidamente potenziali inversioni, continuazioni del trend e cambiamenti nella forza del mercato , senza dover analizzare manualmente ogni candela. Pattern candlestick rilevati Hammer — Martello Inverted Hammer — Martel
Buying vs Selling Force + Trap Detector Scopri la forza dietro i movimenti del prezzo Buying vs Selling Force + Trap Detector è un indicatore avanzato per MetaTrader 5 progettato per analizzare pressione d'acquisto, pressione di vendita, volume e Price Action , aiutando i trader a individuare situazioni potenzialmente importanti direttamente sul grafico. Oltre a mostrare una stima della forza di acquisto e vendita per ogni candela, l'indicatore integra un Trap Detector progettato per identificar
Filtro:
Nessuna recensione
Rispondi alla recensione