Equity Performance Analyzer
- Индикаторы
-
Frank William Jr Colbert
 Всем привет! Я задумался о создании некоторых торговых инструментов, утилит и углублённых анализаторов, чтобы сделать торговлю более безопасной и лёгкой для себя, и надеюсь, что они также помогут другим в их путешествии по форекс-трейдингу, анализу и управлению рисками. Я создал все эти инструменты
 - Версия: 3.3
- Обновлено: 16 июня 2026
- Активации: 5
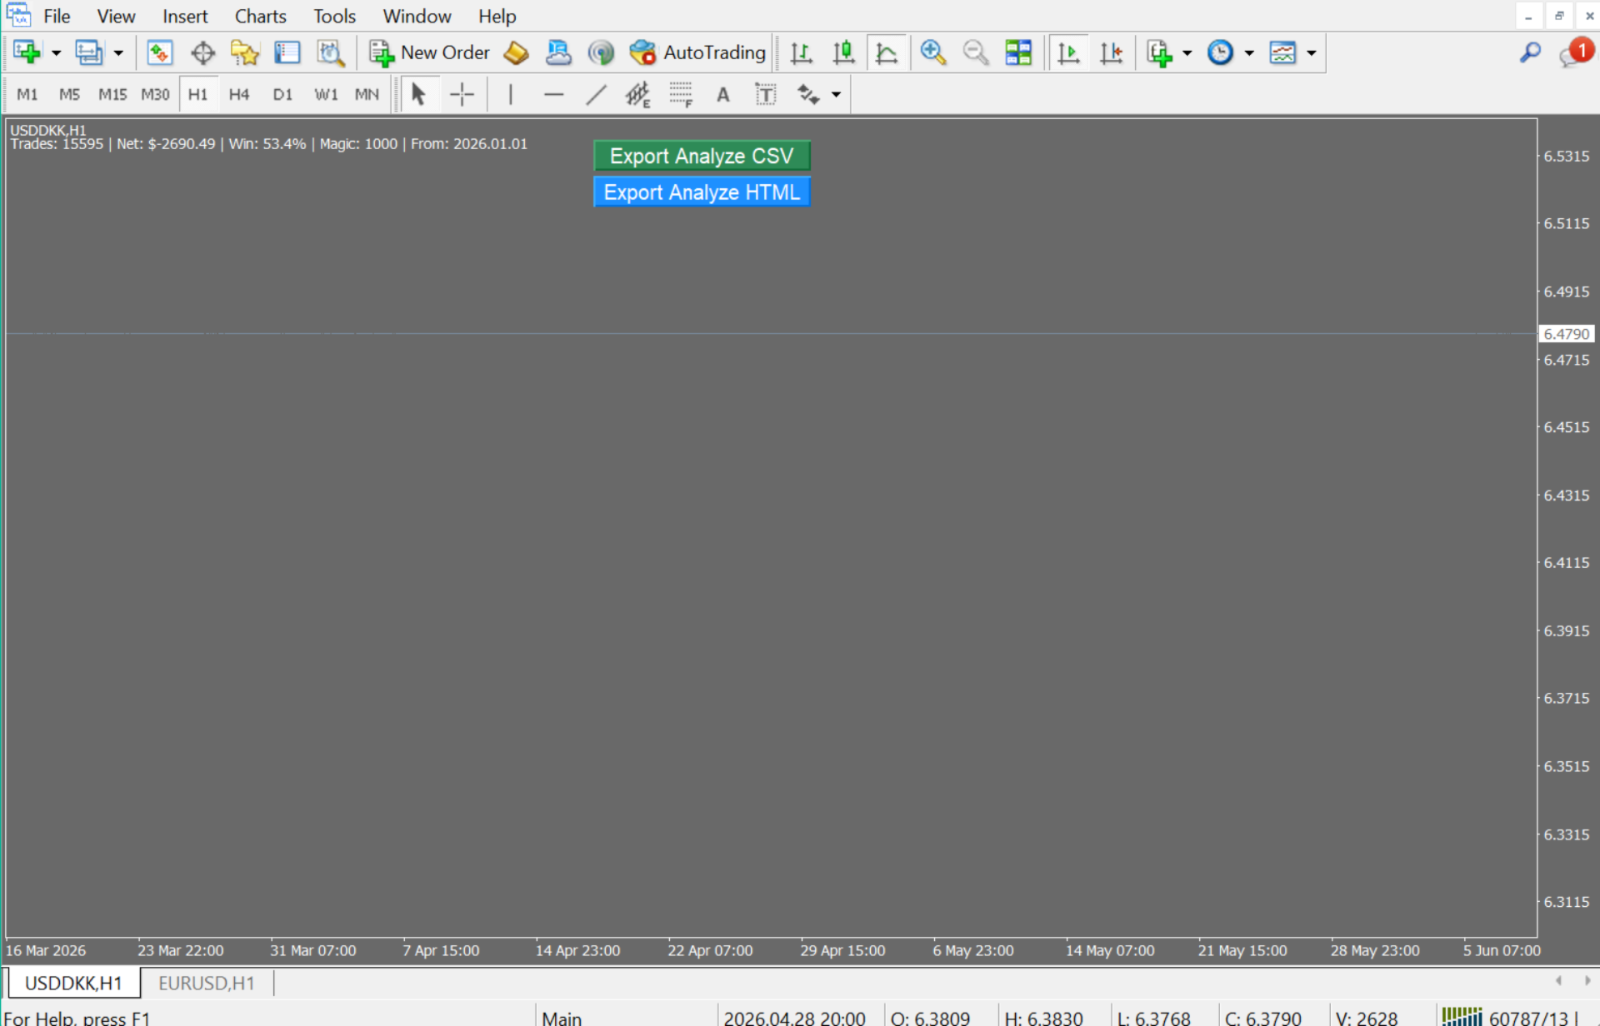
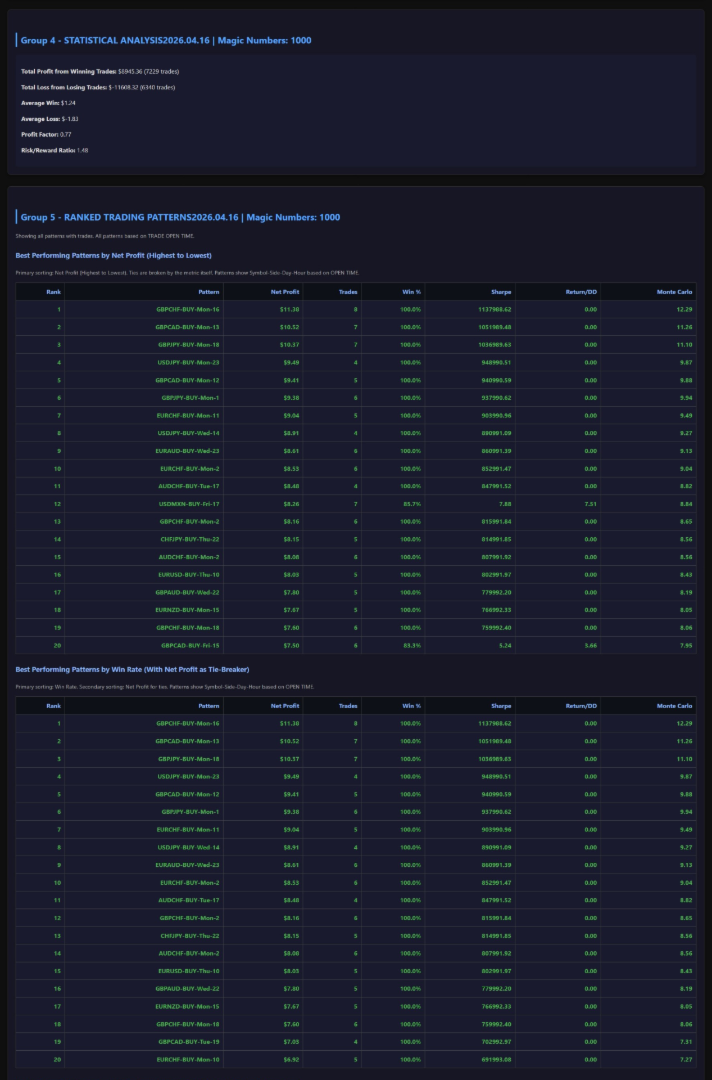
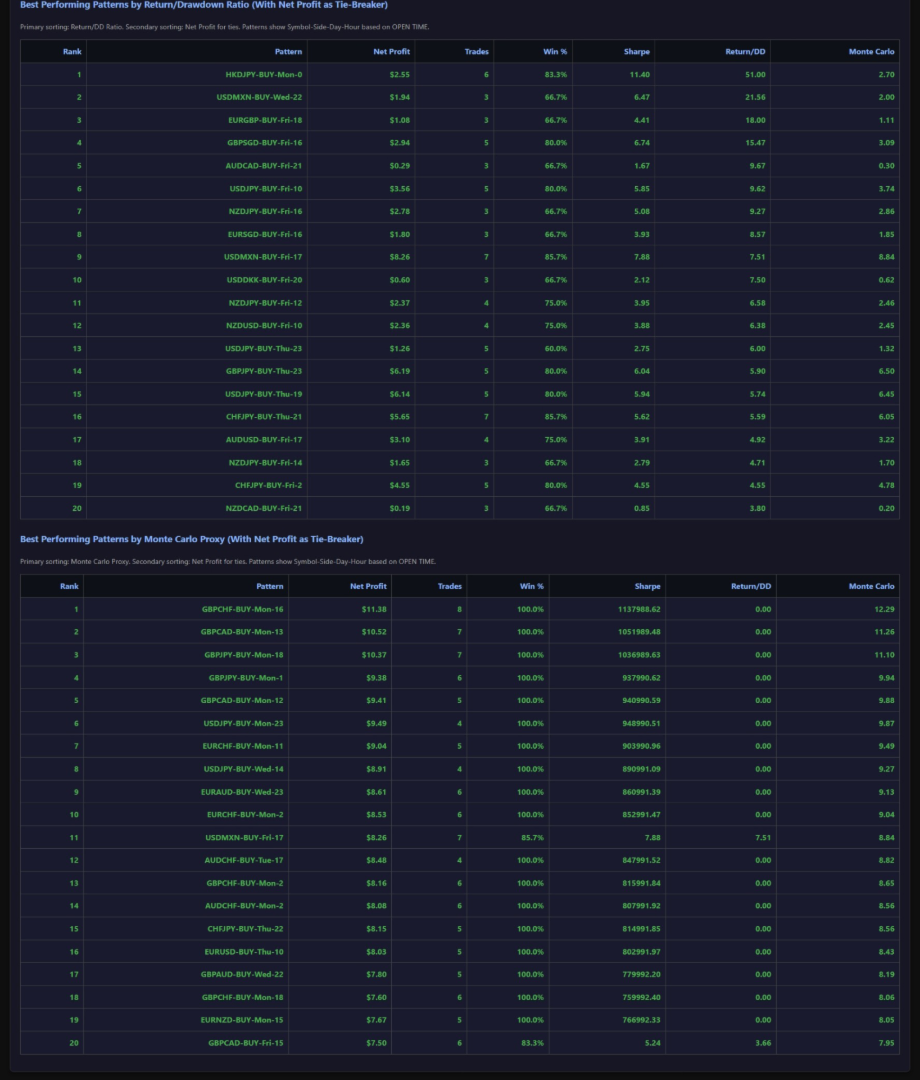
Have patterns that drive your trading success or failure. The Equity Performance Analyzer breaks down your trade history by symbol, day of the week, and hour of entry to identify exactly when your strategies perform best and worst. It ranks every possible trading pattern (e.g., "EURUSD-BUY-Mon-14") by Net Profit, Win Rate, Return/Drawdown, and a Monte Carlo Proxy. More than just an analytics tool, it generates ready-to-use input parameters for your EAs and a crucial "Worst Patterns to Avoid" section, turning historical data into a strategic roadmap.
Key Features:
Granular Pattern Analysis: Creates and ranks patterns based on Symbol, Trade Direction, Weekday, and Hour of OPEN time.
Multi-Metric Ranking: Sorts patterns by Net Profit, Win Rate, Return/Drawdown Ratio, and a unique Monte Carlo Proxy (Net * (1 + Trades*0.01)).
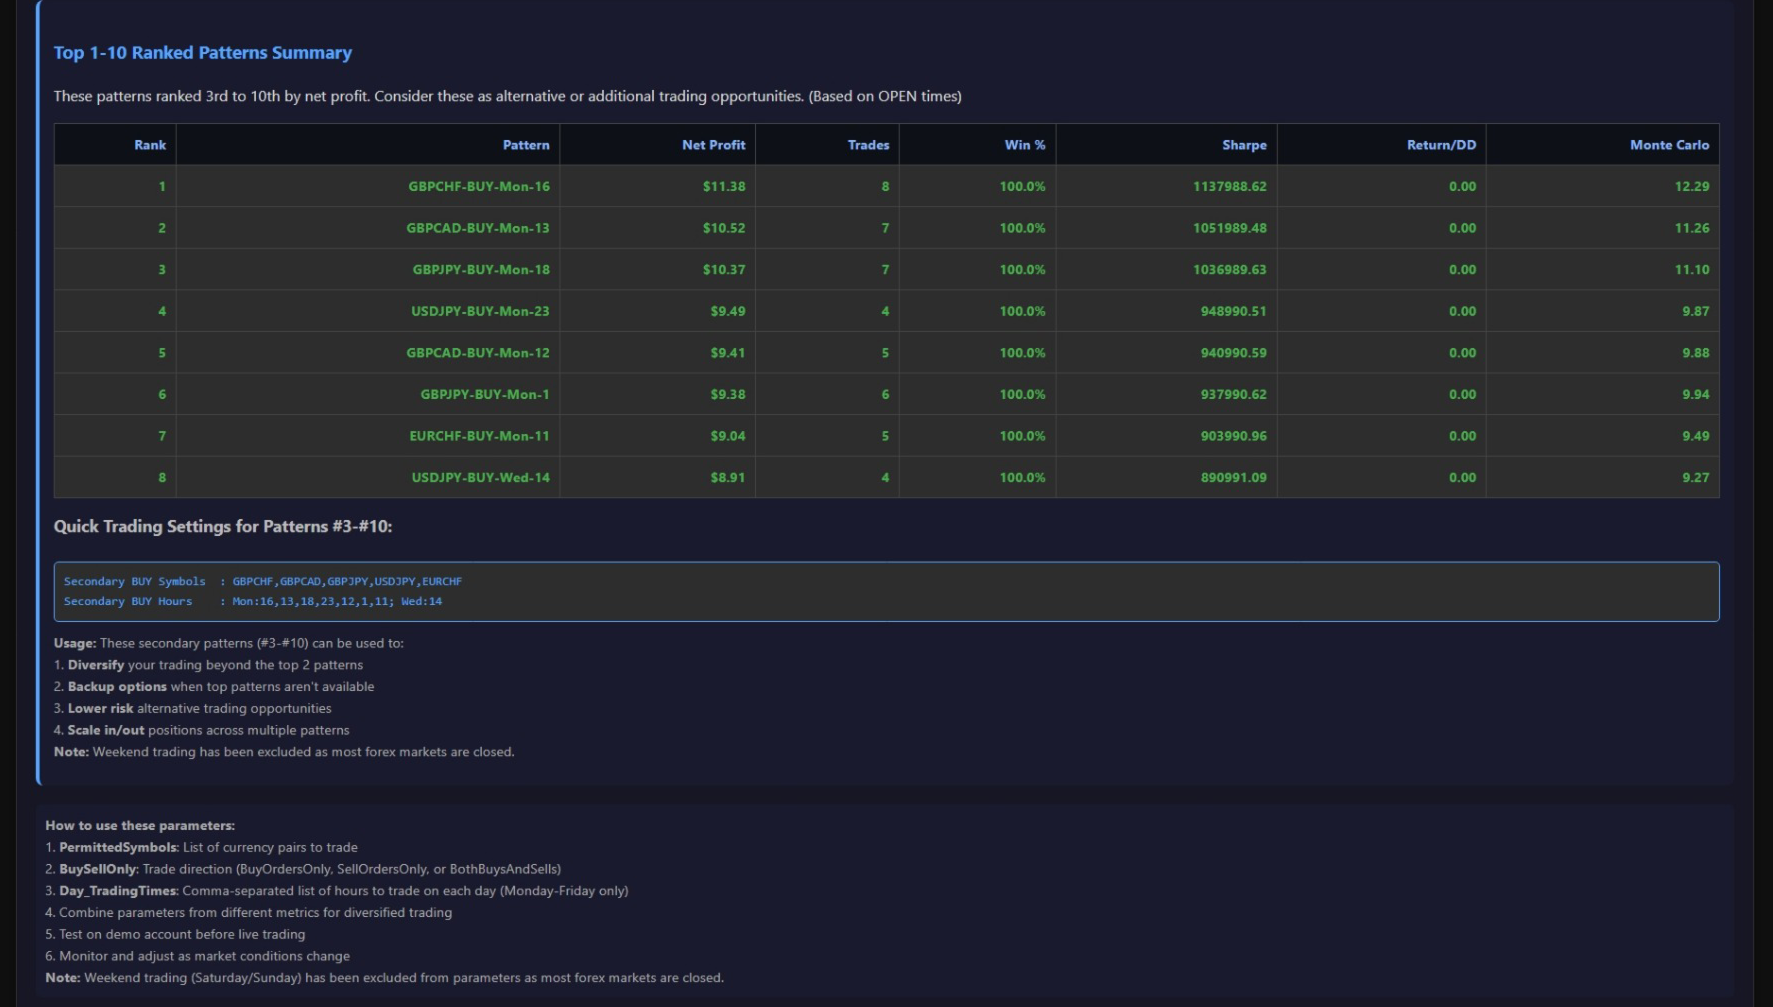
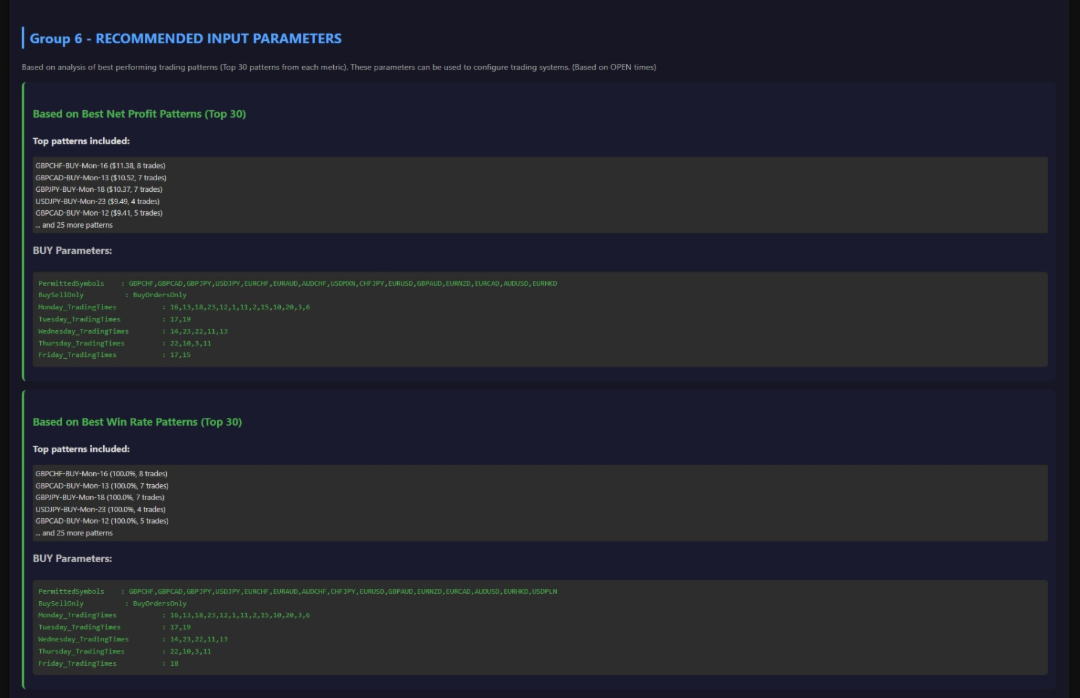
Smart Parameter Generator: Automatically builds "PermittedSymbols," "BuySellOnly," and daily "TradingTimes" (Mon-Fri) parameters based on top-performing patterns.
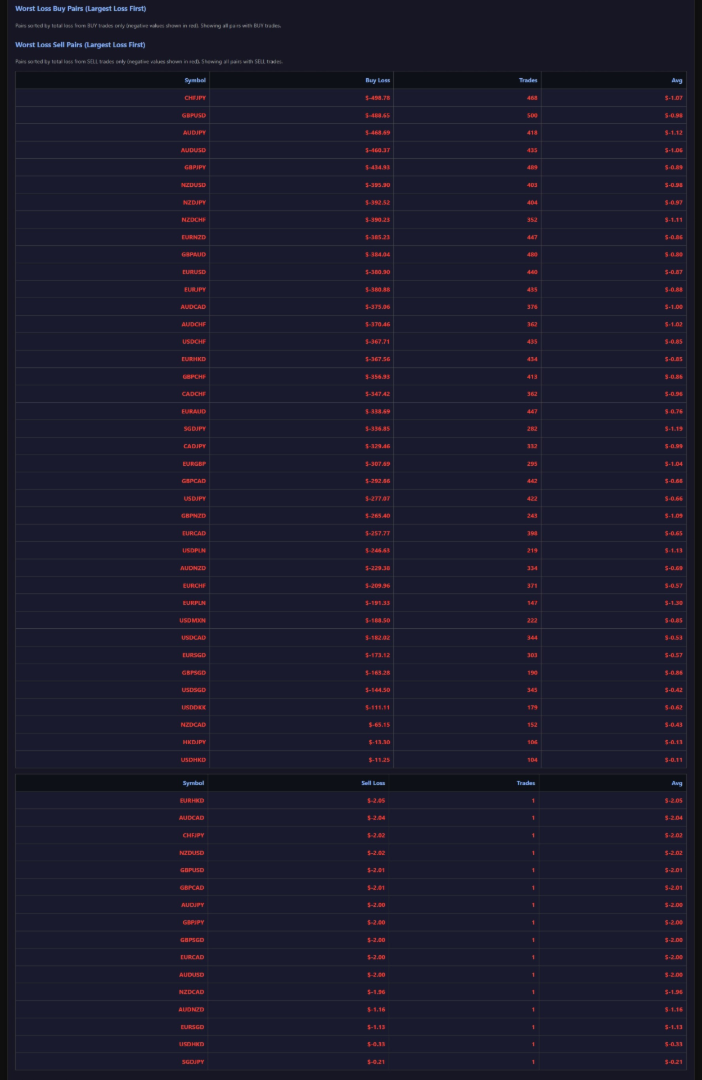
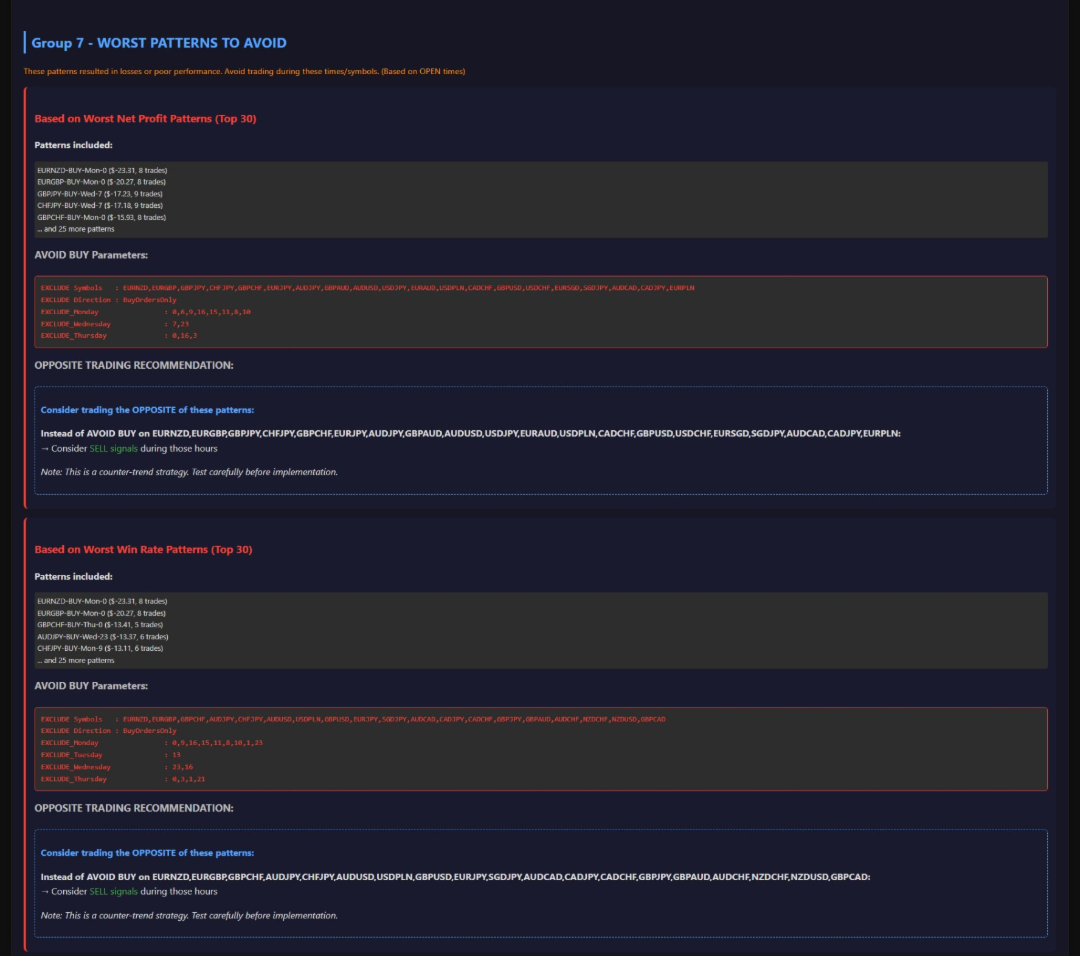
Avoid Parameters Section: Explicitly identifies and lists the worst-performing patterns to avoid or trade against, including combined "AVOID" parameter sets.
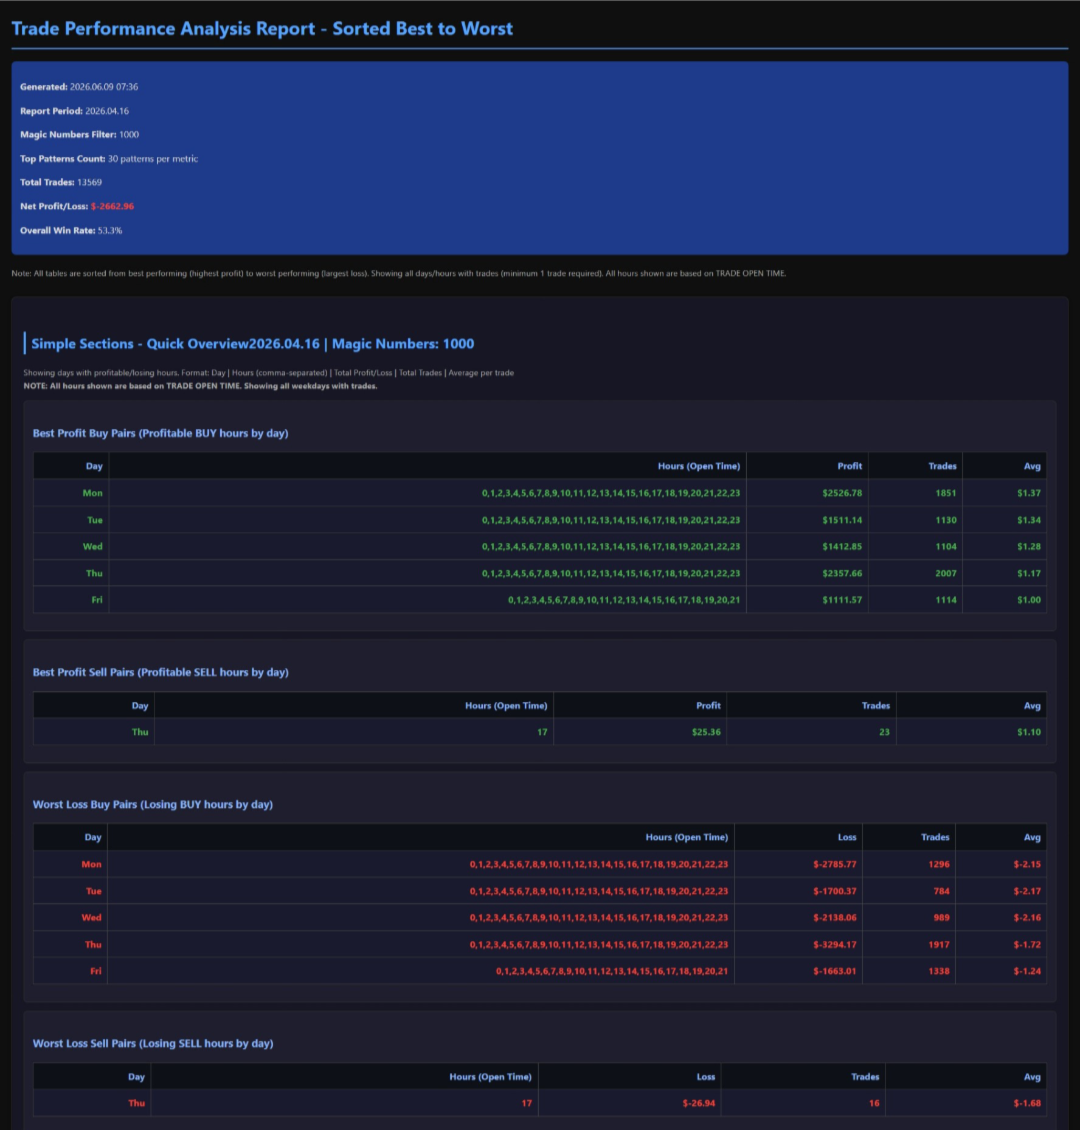
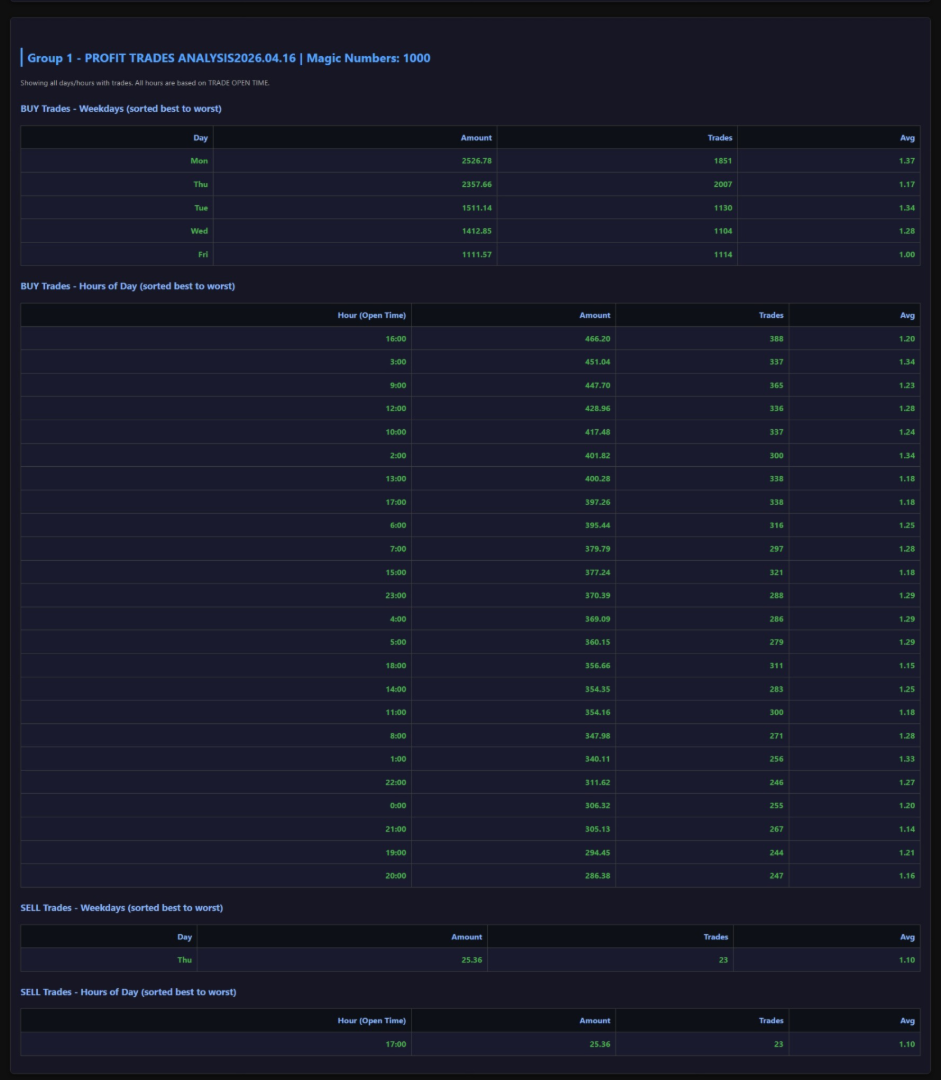
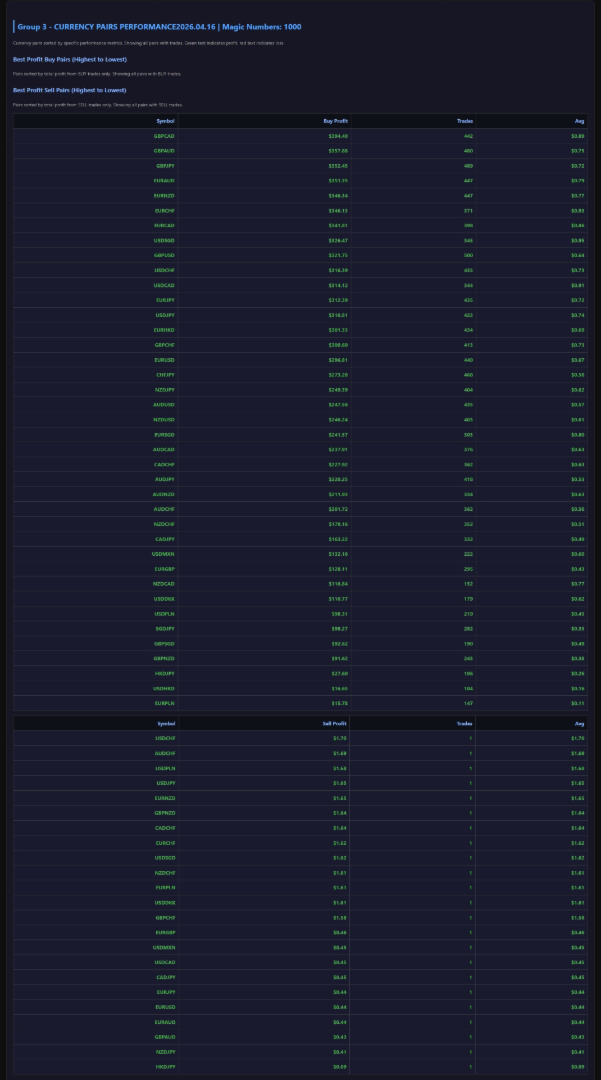
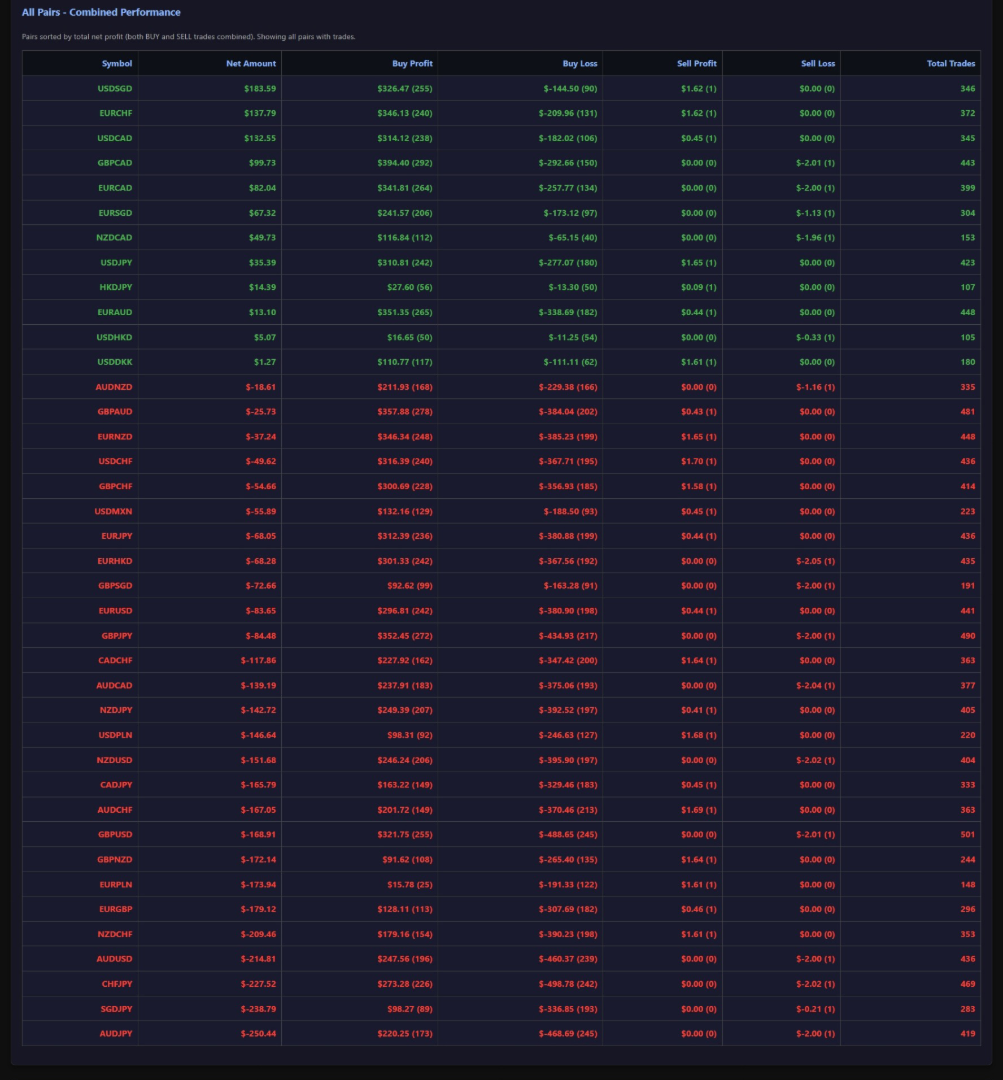
Comprehensive HTML Report: Delivers a color-coded report with multiple data groups (Profit/Loss by Day/Hour, Currency Pair Performance, Ranked Patterns, and Recommended Parameters).
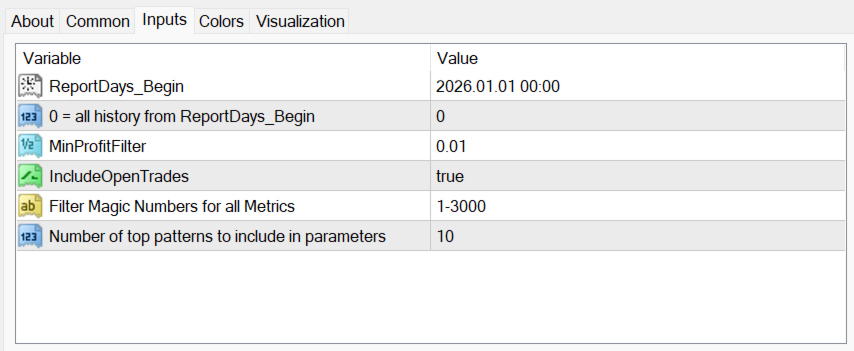
Magic Number Filtering: Focus analysis on specific EAs or strategies using comma-separated Magic Numbers or ranges (e.g., "3001-3016").
Effective Uses:
EA Configuration: Directly copy the generated "BUY Parameters" or "COMBINED Parameters" into your Expert Advisor to restrict trading to historically profitable times and symbols.
Avoiding Losses: Use the "Worst Patterns to Avoid" section to programmatically block your EA from trading during specific high-loss windows or on certain pairs.
Opposite Trading: The tool recommends considering opposite signals for consistently losing patterns, providing a framework for counter-trend strategies.
Backtest Validation: After a backtest, run the analyzer to see if the EA's success is concentrated in specific patterns, confirming its logical consistency.