Awesome Price Action Movement Indicator APAMI Pro

4

Intro to APAMI, PROfessional edition

Trace exactly how far prices trend between two price levels with fractional pip precision, while qualifying price movement between the same price levels.

  • Completely automate when trends change direction and volatility, without any lag.  This is possible because the Accurate Price Action Measurement Indicator (APAMI) actually does what no other indicator can:  measure price distance between two points and simultaneously qualify the price action that occurs between those 2 points with geometric pass/fail criteria. 

  • If prices pullback too much before continuing in the same direction, then that trend/volatility can be disqualified and a new trend can be measured (in the same or opposite direction). By limiting the measurement to only price movements in this way, you can actually measure volatility, trend direction, and momentum all at once, in real-time (coincidentally).  I argue that no other known indicator can do this the way APAMI can.
  • Up and down trends (movements) are independently measured.  So you never have to worry about whether you are missing out on a new emerging trend. 

  • You can hide some pending lines if you want to reduce chart clutter and run it concurrently with other indicators.  Although in my humble opinion you will likely end up removing most of those other [silly] indicators so that there is no “indicator overload” or “chart exhaustion”.

  • So if you think about the typical use of a ruler or straight edge in real life for carpentry (or masonry for you conspiracy buffs) as a precision tool measure the exact length of something to draw, then you will begin to understand the true power of APAMI for trend measuring purposes.  Especially when you consider objectively measuring or qualifying price movement between or within the trend for pass/fail criteria….or export for further analysis.

  • Alerts:  Email/SMS*, push notification**, popup window, or any combination of these 3.
    (*SMS via email-to-SMS gateway supported, if your mobile carrier support it  | **requires mt4 app installed on target mobile device(s)

Quick comparison chart:  Free / Pro / Pro + Plus + / Pro Plus Enterprise

   APAMI Indicator Version
Features
 Free 
 PRO 
 Pro Plus
 Pro Plus Enterprise 
Trends detected by measuring distance/direction across ticks in real time ("moves")
Determine momentum using retracement qualifier


Adjust looseness for initial qualification of moves


measure uptrends and downtrends simultaneously


Flag unusual ticks and gaps from datafeed


Can be backtested/simulated


Turn on/off HUD labels


Use hotkey to switch between HUD labels


Keep completed moves on chart when removing indicator from chart


Email/Popup/Push alerts when target length is achieved (moveComplete)


Features
 Free 
 PRO 
 Pro Plus
 Pro Plus Enterprise 
Change font colors or size of label


Measure volatility avg change across individual moves


Record volatility stats of individual moves to txt file


Measure volatility stats across all incoming ticks for multiple consecutive tick lengths 


record volatility stats across all ticks to text file


Record volatility stats across all ticks and display as HUD


Auto-adjust moveComplete length based on volatility


News-based Custom trend measurement (import news calendar; single source)


triple-sourced news custom trend


6-sources news custom trends


Features
 Free 
 PRO 
 Pro Plus
 Pro Plus Enterprise 

    So how do I trade with APAMI?

    How to potentially profit with APAMI indicator:

    It's actually completely up to you.  There is no one way to use a ruler or straightedge.  It follows that there is no one correct way to trade with APAMI.   It was originally developed as part of a larger professional trading strategy in which grid/averaging was part of the ordering process. The focus was on counter-trend analysis, but that does not mean that it can only be used with averaging/counter-trending strategies.
    Nevertheless, many traders still want some idea of how to use it in real world trading.  Here is a short summary:

    • Scalping:  Scalpers could easily clip pips on pullbacks.  More risky without fundamental analysis, but hey.
    • News trading: Could also analyze the typical price moves across various news categories and then enter the markets after a certain amount of movement has occurred during that news cycle. 
    • Swing trading:  Cut out some of the swing movement.  Or better identify pivot points of the swing.
    • Position/”Trend” traders:  Similar to swing trading mixed with news trading. You could potentially ‘cut out’ part of the trend, but with longer chart timeframes  Could be used for longer trends also.
    • Momentum Traders:  similar to position traders.

    The MT4 terminal should be left on continuously to maximize trend measurements, including the measurment accuracy.  You could use the lookback feature (pro editions), but this is technically simulated.  Real-time moves should have live, continuous connection. 

    • With weekend market breaks, APAMI will just continue when the market reopens.   Do not close the terminal unless necessary. Any pending moves not covered by lookback period may be lost.

    Which Chart Timeframe(s) (TF) should I use?

    While APAMI is timeframe-agnostic (20 pips price movement is 20 pips regardless of the timeframe), it is best to attach the indicator to 1m or 5 min timeframe chart in most cases.   If the trend length (MoveComplete) is larger (100-200+ pips), then 15-60m might be more appropriate.  This also depends on the pair and how many pips the typical daily range is.

    Also chart timeframe is heavily dependent on how long you will hold trade for.  If it is daytrading or swing trades that avg <1 week, then 1/5 min chart is best.  Hold time is 1-4 weeks long, then 5-30 min chart is better.  >4 weeks would use 15-60min.   Note that these recommendations are mainly to keep the chart organized with moderate zoom.  There are only so many bars you can have on chart, even fully zoomed in.  

    • I recommend to add Apami on 2-4 separate charts with different timeframes. Then observe which one works best for your trading setup.


      What APAMI is NOT

      Comparing APAMI coincident trend indicator with other indicator categories:
      • Not a zig-zag indicator:  From one point to the next, how do you determine whether a price has actually reached an endpoint of a zag?  You cant know the endpoint of the previous zag until the zig occurs in the opposite direction...so it still lags.   APAMI calculates up and down trends independently.  So you can sometimes see both UP and DOWN pending moves being drawn at the same time (as a current larger trend in one direction has not yet failed, but a new countertrend is possibly beginning).

        Also there is no lookback* for legitimate trends.  You must draw them in real time (terminal with indicator must constantly run) and then record them.  Only then could a previous trend be re-copied onto a chart.  Therefore, APAMI would likely replace any existing zig-zag indicator you have. 

        *[you can have a lookback in pro plus versions, but it is technically simulated for the part of the move that is in lookback period]

      • Not a Repainting indicator:  APAMI cannot repaint older moves by design.  APAMI is only useful in real time and to see historical APAMI moves already drawn previously by Apami.  Since all calculations are drawn coincidently, there is never a need to repaint anything.  Indicators that repaint are actually fake indicators because they are changing signals or their drawings after the fact with the benefit of hindsight.

      • Not a Moving Average:  The only thing that moves on a price chart is the current bid/ask price (or the "last" price).  But how far they move (length), how fast they move (speed, slope sharpness), and the activity that happens in between (retracement, volatility, tick length) can be objectively measured.  Averaging stale prices (simple, weighted, exponential, smoothed, et al) will always result in some lag.

      --------------  What other indicators APAMI could replace:  ----------
      • Oscillator:  One of the worst types of lagging indicators, because you have multiple averaging and smoothing of prices. With all this said, APAMI Pro Plus/Enterprise versions could show you distance across ticks and allow you to measure volatility across different moves.

      • Momentum:  Price rate of change (PROC) of prices over x periods ago can be a less laggy way to measure price action, depending on how momentum is calculated.  The lagging way you are thinking (RSI, MACD, ROC/PROC).  Actually, APAMI Free/Pro could be used to measure momentum when you consider slope or length of bars used. 

        APAMI Pro PLUS/Enterprise has the ability to incorporate tick-based volatility into recalculating the length of the trend in real time.  And you can also keep track of the tick lengths across several ticks on GUI and also in a log, which you could import or study for further analysis. 

      • Momentum is the rough equivalent of velocity in physics, as it has both direction and movement of prices.

      • Volatility:  The speed/quantity of the momentum of price change over a period of time.  Usually volatility would be compared with quantity of price changes over 2 or more different sections of identical time periods to study relative volatility.   How fast/often prices moved in one period of time compared to the same amount of time.    

      • APAMI Pro PLUS/Enterprise has the ability to measure differences in price movements across ticks and manipulate the length of the trend move.  Volatility could also be considered acceleration in physics.

      • Leading indicator:  While I can make the argument that APAMI performs leading calculations (especially the Pro Plus/Enterprise versions), the term “leading” is inaccurate.  Because the term leading implies that the indicator can see into the future.  But that is just an illusion.  All the averaging, smoothing, and other wizardry applied to make the indicator look fashionable ultimately confuses the user.  Consider instead:   Precise, coincident indication tools is the best anyone can get in real life use.

        The world’s ONLY coincident method to objectively track how prices trend without using any averaging, smoothing, or other guesswork (true zero-lag).  

      __________________________________________________________________________

      Apami Pro Indicator Properties

      Inputs description
      APAMI PRO inputs list
       Description 
       Notes 
      /---- Primary   Settings -----
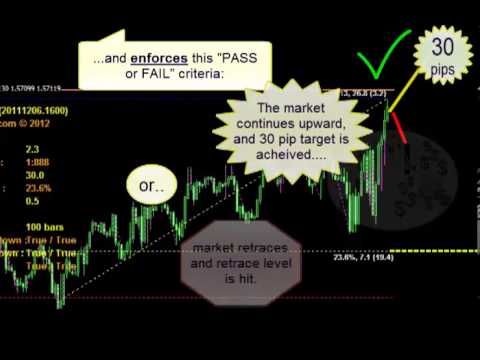
      MOVE_MoveComplete Desired length of the trend, in pips. 17.5 = 17.5 pips. Length is measured from start level to end level and remains fixed, unless using ProPlus version with dynamic MoveComplete enabled. Passing move will complete on chart in Yellow/Red solid lines. Pending lines are thinner, dashed lines with same color. Failed moves are purple, thin dashed lines. But even failed moves can give you information about price inertia.
      Tiny moves < 3.0 need to have higher RetraceQual.
      MOVE_RetracementQualifier The % pip distance from the Start level current price must move in opposite direction (pullback) for MOVE to fail.
      38.5 = 38.5%; Abbr: RetraceQual
      RetraceQual pip length will be auto-calculated and shown on pending lines.
      Lower % = looser qual; more trends, but weaker momentum/inertia required to pass.
      Higher % = stricter qual; less trends, but stronger momentum/inertia required to pass)
      Tiny MoveComplete < 3.0 need to have higher RetraceQual (>30%
      MOVE_IgnoreDistance pip distance from potential start level that RetraceQual is ignored. Once you see pending lines, Ignored distance has already been considered. 1.0 is good in 95% of cases.
      MoveComplete must be > IgnoreDistance
      ShiftDownMovesForSpread Shifts downward moves based on current spread once MoveComplete (reaches end level) Moves are calculated on same prices chart bars/candlesticks are drawn (bid prices). Shifting move considers the Ask price.
      PendingLineDataDisplay draws the Move start line, end line, RetraceQual line, and diagonal line from start point to highest end point achieved. Includes failed moves lines. False = only completed Moves are drawn on chart. No pending lines, EXCEPT for purple failed moves will still be drawn.
      DrawLines draws the Move start line, end line, RetraceQual line, and diagonal line from start point to highest end point achieved. False = only completed Moves are drawn on chart. No pending lines, INCLUDING no failed moves.
      APAMI PRO inputs list
       Description 
       Notes 
      /---   Secondary Settings ---

      EA_ID allows to assign a unique number for running multiple instances in the same terminal Differentiate multiple instances of indicator on the same symbol (including different charts). Not critical for indicator-only internal operations.
      AlertUp Enable alerts for Completed Moves;
      UP moves only
      Choose between: Popup window, Email, Push Notification, or any combination (or 'no alerts')
      AlertDown Enable alerts for Completed Moves; DOWN moves only Choose between: Popup window, Email, Push Notification, or any combination (or 'no alerts')
      DisplayHUD Heads-Up Display (HUD) of indicator information Choose between: None, Mini HUD and Full HUD.
      HUDFont_Size Customize HUD font size
      HUDRowColorEven customize color of HUD Even row make sure colors are different
      HUDRowColorOdd customize color of HUD Odd row make sure colors are different
      MOVE_LookBack How many previous chart bars from current bar to consider when first adding indicator to chart. 0 is best for freshest moves and least errors.
      > 0 is useful if you do not leave terminal on continuously, especially for larger trends.
      > 300, try increasing chart timeframe instead
      MaxMoveCompleteLineCount How many completed moves will remain on chart. Object control. Increase if you want more historical moves.
      HotKeyHUD Use keyboard to change/remove HUD "Ctrl + J". You may have to wait a few ticks (seconds) between each attempt.
      MOVE_Up true = Evaluate only UP moves Disable if you don't want any UP moves
      MOVE_Down true = Evaluate only DOWN moves Disable if you don't want any DOWN moves
      KeepObjectsAtExit true = Keep completed moves on chart if indicator is removed false = remove all objects from chart when removed
      APAMI PRO inputs list
       Description 
       Notes 
      /------ Log Settings

      AlertMissingData true = popup alert when missing datastream is detected that can affect pending moves default = false
      PrintMissingData true = expert log when missing datastream is detected that can affect pending moves default = true; may disable if you see pending moves are mostly unaffected.
      DebugMode not used only if developer requests this.
      Feel free to ask questions or submit feedback here or via email
      Make sure to attach empirical evidence so that we can understand the context of the bug
      Examples of empirical evidence is:
      1. Screen video where you reproduce the error or demonstrate .

        • use continuous recording tools like Bandicam, Thundersoft Screen Recorder, Snagit.  Web-based VideoCandy is also ok and does not require installation.  Mobile/tablet users may search for A-to-Z screen recorder.
        • try to keep the video to under 4 minutes. 

      2. Expert logs + journal logs generated from the terminal.

      If you are having errors attaching large files to the message, just use cloud file sharing service like google drive, dropbox, etc.

      Tags:  pure price action


      Video Awesome Price Action Movement Indicator APAMI Pro
      Отзывы 2
      anjane201
      922
      anjane201 2024.05.16 11:45 
       

      I am not trying to give negative feedback on the indicator but there is no info in any form like a pdf or a video to even understand how to use this product. The author has been supportive and would like to address the issues

      Рекомендуем также
      Moving Pivot Average    The pivot indicator compares the selected period with its counterpart from the previous period. The indicator uses very flexible algorithm for pivot value calculating. It allows you to allocate in days a certain time intervals (custom bars) and calculate the average pivot value based on High, Low and Close prices of these bars. How many custom bars will be taken into account is determined by the "Days" setting. The pivot line can be considered an average trend line and us
      Заголовок: Руководство по структуре BBMA - Руководство по структуре BBMA Описание: BBMA Structure Guide - это специализированный индикатор MQL4, разработанный для помощи трейдерам в понимании структуры BBMA более легко и эффективно. BBMA, или "Bollinger Bands Moving Average", известен своим лозунгом "One Step Ahead", подчеркивающим важность глубокого понимания структуры рынка. С BBMA Structure Guide вы можете быстро идентифицировать базовые паттерны структуры рынка, определяющие движение цен.
      Этот индикатор представляет собой индикатор автоматического волнового анализа, который идеально подходит для практической торговли! Случай... Примечание.   Я не привык использовать западные названия для классификации волн. Из-за влияния соглашения об именах Тан Лунь (Тан Чжун Шуо Дзен) я назвал основную волну   ручкой   , а вторичную полосу волн —   сегментом   Ат. в то же время сегмент имеет направление тренда. Именование   в основном является трендовым сегментом   (этот метод именования буде
      Premium Smart Money Concepts (SMC) Indicator – BOS | CHoCH | FVG | OB | Liquidity Zones - Break of Structure (BOS) and Change of Character (CHoCH)   - Fair Value Gaps (FVG) with auto zones   - Order Blocks (OB) detection   - Liquidity zones and inducement markers   - Alerts for key SMC signals   - Clean chart visuals – customizable and beginner-friendly   - Works on any pair, any timeframe - Trusted SMC logic built for MetaTrader 4   - Real-time signals, no lag or repainting   - Improves decis
      Индикатор Gann Squares представляет собой мощный инструмент для анализа рынка, основанный на математических концепциях, представленных W.D. Gann в его статье "Математическая формула для прогнозирования рынка." Этот индикатор включает в себя техники Ганна, связанные с квадратными числами, такими как 144, 90 и 52, а также Квадрат 9. Кроме того, он включает метод  по использованию Квадрата 9 в сочетании с каналами и паттерном звезды. Руководство пользователя и использование: Перед использованием эт
      Considering the main theories of Forex (Dow Theory, support lines, chart patterns, and Fibonacci retracements), It tells you the price range where whales (large investors) are likely to appear. You can trade at the price points that professionals also aim for. You no longer have to warry about where to aim next. We are live-streaming the actual operation of the system. Please check for yourself if it is usable. Please check it out for yourself. https://www.youtube.com/@ganesha_forex We do not
      Индикатор EuroSession сочетает в себе фильтрацию с помощью модифицированного MACD и трендового индикатора. Данный индикатор старается захватить ранние движения рынка во время Европейской сессии. Это означает, что отложенные ордера должны быть установлены задолго до начала этого движения. Отложенные ордера на покупку (Buystop) следует устанавливать, если: Trend-Bias показывает направление тренда вверх - 'UP' MACD Bias показывает направление MACD "относительно вверх" - 'Relatively UP' Отложенные о
      My indicator is 1000%, it never repaints, it works in every time period, there is only 1 variable, it sends notifications to your phone even if you are on vacation instead of at work, in a meeting, and there is also a robot version of this indicator With a single indicator you can get rid of indicator garbage It is especially suitable for scalping in the m1 and m5 time frames on the gold chart, and you can see long trends in the h1 time frame.
      OBTE = Order Block Type I OBTI Indicator MT4 is the most accurate and customizable indicator on the market. It was developed to facilitate the analysis of operations based on candlestick patterns and supply-demand zones. These zones are possible movement reversal points. For this indicator is generated by the order block of smart money concept. Input parameters: 1. Multiple timeframes : M1 M5 M15 M30 H1 H4 D1 W1 MN1 2. Default input: H1 H4 D1 W1 MN1 3. Notifications / Send Emails / Notification
      The indicator is the advanced form of the MetaTrader 4 standard Fibonacci tool. It is unique and very reasonable for serious Fibonacci traders. Key Features Drawing of Fibonacci retracement and expansion levels in a few seconds by using hotkeys. Auto adjusting of retracement levels once the market makes new highs/lows. Ability to edit/remove any retracement & expansion levels on chart. Auto snap to exact high and low of bars while plotting on chart. Getting very clear charts even though many ret
      Данный индикатор не зря так назван ведь он покажет обратную сторону рынка.. В него встроено несколько математических индикатора, которые настроены показывать лучшие сигналы для валютных пар! Идеально показал себя в работе на М5-М15 не больше и не меньше! Только при этом он показывает до 86,5% правильных сигналов! В настройки включены цвета стрелок, аллерт, и так же параметры что бы вы смоли перенастроить индикатор и торговать на криптовалюте и сырье! Если будут вопросы тестируйте или пишите мне)
      ABC Indicator анализирует рынок через волны, импульсы и тренды, помогая находить ключевые точки разворота и смены тренда. Автоматически определяет волны A, B и C, а также уровни стоп-лосса и тейк-профита. Удобный инструмент для повышения точности и эффективности вашей торговли. Данный продукт также доступен для терминала MetaTrader 5 =>  https://www.mql5.com/ru/market/product/128178 Основные особенности индикатора: 1. Идентификация волн и трендов:    - Автоматическое определение волн на основе
      Next level of trend trading here. Possibility 75%, the indicator analyzes the current market to determine short (small dot), middle (circle with a dot inside) and long (cross with a circle and a dot inside) trends.  Wingdings characters of  Aqua color represents the beginning of the UP trend. Wingdings characters of  Orange color represents the beginning of the DOWN trend. Possibility 75% Indicator will improve your trading in the world of forex, commodities, cryptocurrencies and indices.
      Primary Trend - это удобный инструмент, если вы привыкли торговать на чистом графике, но иногда вам нужно взглянуть на Primary Trend. Primary Trendиндикатор изучает ценовое действие как совокупность ценовых и временных векторов, и использует средний вектор для определения направления и силы рынка. Этот индикатор выделяет краткосрочную направленность и силу рынка. Индикатор не перерисовывается. Индикатор реализует стратегию прорыва. Стрелки показывают направления рынка. Используйте индикатор на и
      No idea why demo is not working. you can check the GIF to see how it works. Features With this scanner you can detect Candles which are below/above yesterday high/low lines. A pair's rectangle turns RED in dashboard if it is above the yesterday high, and rectangle turns GREEN in dashboard if it is below the yesterday low. It gives alerts in every 15m candle close. Contains a Dashboard which will help you to see all market pair's. It is possible to disable this sorting through to make it easier
      Автоматические линии тренда, с push, email и звуковыми оповещениями. Вид линий (цвет, толщина, тип) отражает историю их взаимодействия с ценой: отскок, пробой, отскок после пробоя, количество отскоков, двойной пробой. Оповещения информируют пользователя об этих событиях. Пользователь может редактировать линии (корректировать, перетаскивать, удалять) и настраивать систему линий, не выгружая индикатор. Для полноценного использования индикатора рекомендуется ознакомиться с руководством в 5-минутном
      The indicator monitors the MACD trend in multiple timeframes for a specific market. No more shifting in between charts to check the trend direction while trading. Key Features Indicator can be used for all markets Monitors every timeframe, from M1 to MN Able to move display label on chart by single click Indicator Usage The dashboard appears to the left and upper part of the chart when attached. The shell encapsulating a timeframe goes red on a down trend, green on an up trend. If the default
      Fx Levels Premium Indicator Support and Resistance are important concepts in trading. Fx Levels Premium was created to easily draw important levels of support and resistance for the active trader. The indicator will give you all important levels (support/resistance) to watch for a wide range of assets. Trading without these levels on your chart is like driving a car for a long journey without a roadmap. You would be confused and blind. Support and resistance levels should be used as guideline
      AndInvest Impulse
      Bruno Ravardiere De Oliveira Goncalves
      Em uma negociação no Mercado Financeiro nada é mais importante que saber o momento certo de entrar em uma negociação. O AndInvest Impulse auxilia traders a capturar o momento exato de abrir uma negociação, para isto ele desenha topos e fundos facilitando a leitura do Price Action e após um breve momento de realização do mercado ele identifica o retorno da ponta compradora ou vendedora de força antecipada e sem repintura. Comprovação de Resultados: https://youtu.be/CA1_ZtZY0vk Funciona em qualque
      Thanks to this indicator, you can easily see the new ABCD harmonic patterns in the chart. If the two price action lengths are equal, the system will give you a signal when it reaches the specified level. You can set the limits as you wish. For example, You can get the signal of the price, which occurs in the Fibonaci 38.2 and 88.6 retracements, and then moves for the same length, at the level you specify. For example, it will alarm you when the price reaches 80% as a percentage. In vertical
      NEXT price Actions - Daily Pivots 1. Auto Mapping Projection Price Action XAUUSD to get the most accurate setup for each Entry Lines. 2. The tool used has been customized according to Swap Pivots setup. 3. The setup that results after Mapping is suitable for Intraday 4. This setup does not need a marking and depends on SNR & SND. 5. This setup only depends 100% on the tool used. 6. This setup is very suitable for getting an Entry in a shadow candle stick. 7. This setup will also follow th
      Mr Beast Cristal alerts
      Luis Mariano Vazquez Marcos
      Mr Beast Cristal Alerts MT4/MT5 Descripción: El indicador Mr Beast Cristal Alerts para MetaTrader 4 está diseñado para proporcionar alertas basadas en la metodología de Parabolic SAR. Este indicador avanzado detecta cambios en la dirección del precio y genera señales precisas para posibles entradas y salidas, ayudando a los operadores a capitalizar las tendencias del mercado de manera efectiva. Características principales: Alertas de Parabolic SAR: Genera notificaciones instantáneas cuando se de
      First time on MetaTrader, introducing IQ Star Lines - an original Vedic Astrology based indicator. "Millionaires don't use astrology, billionaires do" . - J.P. Morgan, Legendary American financier and banker. IQ Star Lines, an unique astrological indicator purely based on   Vedic astrology   calculations, published for the   first time on Metatrader.  This unique tool plots dynamic planetary grid lines based on real-time stars, constellations, and celestial movements, which allows you to plot t
      Pisces TheProfitZone "Pisces TheProfitZone MT4 Indicator Powered byFxGangster" This indicator will calculate new support and resistant zone everyday, and that give us a trading zone such as thats telling us TP and SL, So it still telling us for where should the price will go reach? Fore Example. Uptrend : If Price can stay upper a Line and price close higher above a Line, then the price will continue go up to reach next Line. Downtrend : If Price can't pass to stay upper a Line and the price
      Индикатор Trend Divergence: Ваш Необходимый Инструмент для Анализа Рынка Индикатор Trend Divergence — это мощный инструмент, предназначенный для помощи трейдерам в выявлении рыночных трендов и точного определения точек входа. Используя дивергенцию цен, этот индикатор улучшает вашу торговую стратегию, предлагая надежные инсайты и фильтрацию ненужных сигналов. Основные особенности и преимущества индикатора Trend Divergence Точный анализ трендов: Индикатор Trend Divergence использует ценовую диверг
      Уникальный индикатор, реализующий профессиональный и количественный подход к торговле на возврате к среднему. Он использует тот факт, что цена отклоняется и возвращается к среднему предсказуемым и измеримым образом, что позволяет использовать четкие правила входа и выхода, которые значительно превосходят неколичественные торговые стратегии. [ Installation Guide | Update Guide | Troubleshooting | FAQ | All Products ] Четкие торговые сигналы Удивительно легко торговать Настраиваемые цвета и разме
      Дивергенция и Конвергенция - важные предвестники разворотов на биржевых рынках. Индикатор "Divergence Sync" - создан для автоматического поиска дивергенций на большом количестве индикаторов с разными параметрами . Поиск дивергенций осуществляется на этих индикаторах:  (CCI, CHO, DeMarker, MACD, MFI, Momentum, OBV, OsMA, RSI, Stochastic, WPR, Awesome Oscillator ). Для поиска дивергенций можно использовать один технический индикатор или искать одновременно на любом количестве индикаторов. Индик
      Auto Order Block with break of structure based on ICT and Smart Money Concepts (SMC) Futures Break of Structure ( BoS )             Order block ( OB )            Higher time frame Order block / Point of Interest ( POI )    shown on current chart           Fair value Gap ( FVG ) / Imbalance   -  MTF      ( Multi Time Frame )    HH/LL/HL/LH  -  MTF      ( Multi Time Frame )  Choch  MTF      ( Multi Time Frame )  Volume Imbalance     ,  MTF          vIMB Gap’s Power of 3 Equal High / Low’s  
      Range bound is a mt4 indicator that shows various levels to enter the market. It uses MACD as the primary reference indicator. When MACD oscillator is showing buy or sell signals these are displayed on your trading dashboard but as levels to buy or sell on the main chart. The indicator shows blue signals and red signals That are support and resistance levels. In short this indicator shows ranges where your trades should be safe from market changes against your order.
      Паттерн «голова и плечи» - это форма диаграммы, которая напоминает базовую линию с тремя вершинами, две внешние - близки по высоте, а средняя - самая высокая. Он предсказывает разворот тренда от бычьего к медвежьему и считается одним из самых надежных паттернов разворота тренда. Это один из нескольких верхних паттернов, которые с различной степенью точности сигнализируют о том, что тренд близится к концу. [ Руководство по установке | Руководство по обновлению | Устранение неполадок | FAQ | Все
      С этим продуктом покупают
      Индикатор Miraculous – 100% ненарисовывающийся инструмент для Форекс и бинарных опционов, основанный на Квадрате Девяти Ганна Это видео представляет индикатор Miraculous – высокоточный и мощный торговый инструмент, специально разработанный для трейдеров Форекс и бинарных опционов. Что делает этот индикатор уникальным, так это его основа на легендарном Квадрате Девяти Ганна и Законе вибрации Ганна , что делает его одним из самых точных инструментов прогнозирования, доступных в современном трейдин
      Meravith
      Ivan Stefanov
      5 (2)
      Инструмент маркет-мейкеров. Meravith будет: Анализировать все таймфреймы и отображать текущий действующий тренд. Выделять зоны ликвидности (объёмное равновесие), где бычий и медвежий объём равны. Показывать все уровни ликвидности с разных таймфреймов прямо на вашем графике. Генерировать и отображать текстовый анализ рынка для вашего ориентирования. Рассчитывать цели, уровни поддержки и стоп-лосс в соответствии с текущим трендом. Вычислять соотношение риск/прибыль для ваших сделок. Определять раз
      Сигнал GoldRush Trend Arrow Индикатор GoldRush Trend Arrow Signal предоставляет точный анализ тренда в режиме реального времени, специально разработанный для высокоскоростных краткосрочных скальперов в XAU/USD. Этот инструмент, созданный специально для 1-минутного таймфрейма, отображает стрелки направления для четких точек входа, позволяя скальперам уверенно ориентироваться в волатильных рыночных условиях. Индикатор состоит из ПЕРВИЧНЫХ и ВТОРИЧНЫХ стрелок оповещения. ПЕРВИЧНЫЕ сигналы — это
      Presenting one-of-a-kind Gann Indicator for XAUUSD IQ Gold Gann Levels is a non-repainting, precision tool designed exclusively for XAUUSD/Gold intraday trading. It uses W.D. Gann’s square root method to plot real-time support and resistance levels, helping traders spot high-probability entries with confidence and clarity. William Delbert Gann (W.D. Gann) was an exceptional market analyst whose trading technique was based on a complex blend of mathematics, geometry, astrology, and ancient calcul
      Pulse Scalping Line - индикатор для выявления потенциальных точек разворота. На базе этого индикатора можно построить эффективную систему Мартингейл. По нашей статистике индикатор дает максимум 4 ошибочных точки разворота в серии. В среднем это 2 точки разворота. То есть, индикатор показывает разворот, он ошибочный. Значит второй сигнал индикатора будет с высокой вероятностью точный. Основываясь на данной информации можно построить торговую систему по принципу Мартингейл. Чтобы этот Мартингейл б
      В настоящее время скидка 40%! Лучшее решение для новичка или трейдера-эксперта! Эта приборная панель работает на 28 валютных парах. Он основан на 2 наших основных индикаторах (Advanced Currency Strength 28 и Advanced Currency Impulse). Он дает отличный обзор всего рынка Forex. Он показывает значения Advanced Currency Strength, скорость движения валюты и сигналы для 28 пар Forex на всех (9) таймфреймах. Представьте, как улучшится ваша торговля, когда вы сможете наблюдать за всем рынком с помощ
      Данный индикатор использует авторские уравнения для построения сигналов со стоп-лоссами и до 4 тейк-профитов. При покупке/аренде этого индикатора вы бесплатно получите советник на его основе в качестве подарка. Особенности Он наглядно показывает точки входа в виде значка готовности (Buy / Sell) и стрелки (Buy / Sell) после закрытия свечи, а также линию SL и до 4 линий TP; Как только лини SL-TP будут показаны стрелками, они остаются неизменными до изменения сигнала; Это исторический индикатор; Н
      Weis Wave with Alert
      Trade The Volume Waves Single Member P.C.
      4.82 (22)
      Индикатор волны Вайса основан на теории Ричарда Вайкоффа. Работает на всех таймфреймах, флетовых и тиковых графиках. Может применяться к любому рынку. Индикатор добавляет объемы соответствующих ценовых волн и рисует кумулятивную гистограмму. Каждая ценовая волна движется в определенном направлении вверх или вниз, пока не изменится. Чтобы индикаторная волна развернулась, цена должна превышать количество точек (пипсы * 10), установленных в параметрах индикатора. Поэтому последняя волна перерисовыв
      Dynamic Forex28 Navigator — инструмент для торговли на рынке Форекс нового поколения. В НАСТОЯЩЕЕ ВРЕМЯ СКИДКА 49%. Dynamic Forex28 Navigator — это эволюция наших популярных индикаторов, объединяющая мощь трех в одном: Advanced Currency Strength28 Indicator (695 отзывов) + Advanced Currency IMPULSE with ALERT (520 отзывов) + CS28 Combo Signals (бонус). Подробности об индикаторе https://www.mql5.com/en/blogs/post/758844 Что предлагает индикатор Strength нового поколения?  Все, что вам нравило
      Bomb Bank Signal
      Igor Pereira Calil
      5 (1)
      Сигнал банка-бомбы: индикатор вашей уверенности в MetaTrader 4 Bomb Bank Signal — мощный индикатор для MetaTrader 4, предназначенный для выявления наиболее актуальных тенденций финансового рынка. Если вы ищете инструмент, который точно предугадывает движения, Bomb Bank — ваш союзник. Как это работает: Этот индикатор сочетает в себе три различных метода — анализ объема, закрытие свечей и симметричный тренд — для обнаружения и сигнализации о возможностях покупки и продажи. Банк-бомба похож на
      Algo Trading Indicaor  With this indicator , you’ll have zones and trends that hight probability the price will reverse from it. so will gives you all the help that you need  Why should you join us !?  1-This indicator is logical since it’s working in previous days movement , to predict the future movements. 2-Algo trading indicator will help you to draw trends which is special and are too strong than the basics trend , trends will change with the frame time that you work on . 3-We can use
      Product Name:   Quantum Regime Indicator Short Description:   A multi-engine structural regime and volatility filter. Description: Quantum Regime Indicator (QRI) is a sophisticated technical analysis algorithm designed to identify market structure shifts and volatility regimes. Unlike standard indicators that rely on immediate price action, QRI utilizes a hierarchical logic architecture to filter market noise and identify statistical extremes. The indicator is built on the philosophy of "Market
      Прежде всего стоит подчеркнуть, что этот Торговый Инструмент является Неперерисовывающимся Нерепейнтинговым Индикатором, что делает его идеальным для профессиональной торговли. Онлайн-курс, руководство пользователя и демонстрация. Индикатор Концепций Умного Действия Цены - очень мощный инструмент как для новичков, так и для опытных трейдеров. Он объединяет более 20 полезных индикаторов в одном, комбинируя передовые торговые идеи, такие как анализ Inner Circle Trader и стратегии торговли концеп
      ZeusArrow Smart Liquidity Finder  Smart Liquidity Finder is Ai controlled indicator based on the Idea of Your SL is My Entry. It scan and draws the major Liquidity areas on chart partitioning them with Premium and Discount Zone and allows you find the best possible trading setups and help you decide the perfect entry price to avoid getting your Stop Loss hunted . Now no more confusion about when to enter and where to enter. Benefit from this one of it's kind trading tool powered by Ai an trade
      Supreme Commander
      Ramon Sobrevals Arce
      4.13 (8)
      The indicator of the indicators. The Most Powerful Technique to Determine Forex Trend Strength in 2023. We have perfected Supreme Commander that it calculates an average of the selected indicators (up to 16) and the selected timeframe (all) with the result of a single trend that indicates the potential of buying and selling.  It includes the following indicators: Accelerator/Decelerator oscillator Average Directional Movement Index Awesome oscillator; Bulls and Bears  Commodity Channel Index; De
      Excessive Momentum Indicator – один из немногих индикаторов, измеряющий чрезмерный импульс на финансовом рынке с использованием ценового поведения. Индикатор полностью разработан Янгом Хо Сео (Young Ho Seo). Этот показатель демонстрирует концепцию и практическое применение Равновесной фрактальной волны (Equilibrium Fractal Wave). Чрезмерный импульс на рынке может рассказать о психологии толпы и помочь спрогнозировать направление цены. Таким образом, вы можете основывать свои торговые решения на
      Индикатор " Dynamic Scalper System " разработан для скальпингового метода торговли внутри трендовых волн. Тестировался на основных валютных парах и золоте, возможна совместимость с другими торговыми инструментами. Дает сигналы для кратковременного открытия позиций по тренду с дополнительным сопровождением движения цены. Принцип действия индикатора. Большие стрелки определяют направление тренда. Внутри трендовых волн действует алгоритм генерации сигналов для скальпинга в виде маленьких стрело
      ConfluencePro v2.0 – Лучший индикатор кон Fluence для бинарных опционов и Forex Профессиональная многофильтровая система сигналов с дашбордом, фильтром новостей и статистикой в реальном времени ConfluencePro v2.0 — самый продвинутый индикатор на основе кон Fluence, когда-либо опубликованный на MQL5 Market. Он объединяет более 17 профессиональных фильтров (тренд, Smart Money Concepts, рыночная структура, дивергенции, подтверждение с высших таймфреймов, новости, объём, режим рынка и др.) в один по
      Представляем вам индикатор самолета F-16, передовой инструмент MT4, разработанный для революционизации вашего торгового опыта. Вдохновленный беспрецедентной скоростью и точностью истребителя F-16, этот индикатор объединяет передовые алгоритмы и передовую технологию, чтобы обеспечить беспрецедентную производительность на финансовых рынках. С индикатором самолета F-16 вы будете парить над конкурентами, так как он обеспечивает анализ в реальном времени и генерирует высокоточные торговые сигналы. Ег
      В настоящее время скидка 40%! Эта приборная панель - очень мощное программное обеспечение, работающее на нескольких символах и до 9 таймфреймов. Он основан на нашем основном индикаторе (Лучшие отзывы: Advanced Supply Demand ).   Приборная панель дает отличный обзор. Она показывает:  Отфильтрованные значения спроса и предложения, включая рейтинг силы зон, расстояния между пунктами в зонах и внутри зон, Выделяются вложенные зоны, Выдает 4 вида предупреждений для выбранных символов на всех (9) та
      Looking for a powerful yet lightweight swing detector that accurately identifies market structure turning points? Want clear, reliable buy and sell signals that work across any timeframe and any instrument? Buy Sell Arrow MT Swing is built exactly for that — precision swing detection made simple and effective. This indicator identifies Higher Highs (HH) , Higher Lows (HL) , Lower Highs (LH) , and Lower Lows (LL) with remarkable clarity. It is designed to help traders easily visualize market str
      Hidden Cycles
      Lev Vladimirovic Marushkin
      5 (1)
      The Only 100% Universal Tool! Stop trading against nature! This is your chance to secure the only indicator rooted in the absolute laws that govern the entire universe. Most tools guess—this one reveals the truth. Buy another toy or buy the truth. Your choice... Based on Universal Laws — NOT Some Guy’s Algorithm: Let the market adjust to the Hidden Cycles Geometry — not the other way around. Most indicators are based on a man-made formula. They often lag, fail over time, or need constant re-o
      Introduction to Fractal Pattern Scanner Fractal Indicator refers to the technical indicator that makes use of the fractal geometry found in the financial market. Fractal Pattern Scanner is the advanced Fractal Indicator that brings the latest trading technology after the extensive research and development work in the fractal geometry in the financial market. The most important feature in Fractal Pattern Scanner is the ability to measure the turning point probability as well as the trend probabi
      The Super Arrow Indicator provides non-repainting buy and sell signals with exceptional accuracy. Key Features No repainting – confirmed signals remain fixed Clear visual arrows: green for buy, red for sell Real-time alerts via pop-up, sound, and optional email Clean chart view with no unnecessary clutter Works on all markets: Forex, gold, oil, indices, crypto Adjustable Parameters TimeFrame Default: "current time frame" Function: Sets the time frame for indicator calculation Options: Can be set
      The Nihilist 5.0 Indicator includes Forexalien and Nihilist Easy Trend trading strategies and systems. It is composed of an MTF Dashboard where you can analyze the different input possibilities of each strategy at a glance. It has an alert system with different types of configurable filters. You can also configure which TF you want to be notified on your Metatrader 4 platform and Mobile application The indicator has the option to view how could be a TP and SL by using ATR or fixed points, even w
      NAM Order Blocks
      NAM TECH GROUP, CORP.
      3.67 (3)
      Индикатор обнаружения блоков ордеров мультитаймфреймов MT4. Функции - Полностью настраиваемая панель управления графиком, обеспечивает полное взаимодействие. - Скрыть и показать панель управления где угодно. - Обнаружение OB на нескольких таймфреймах. - Выберите количество OB для отображения. - Различные пользовательские интерфейсы OB. - Различные фильтры по OB. - Оповещение о близости OB. - Линии ADR High и Low. - Служба уведомлений (Экранные оповещения | Push-уведомления). Резюме
      Каждый покупатель индикатора Scalping signals M1 получает в ПОДАРОК полностью автоматического робота, который торгует по сигналам индикатора. Индикатор показывает стрелки – робот может за вас открывать и закрывать сделки по этим сигналам при соблюдении всех настроек и риск-менеджмента. Scalping signals M1 – готовая система входов по тренду для минутных графиков Scalping signals M1 – это индикатор, который превращает график в понятную карту действий: цветной трендовый канал показывает направлени
      The AX Forex Indicator MT4 is a sophisticated trading tool designed to provide traders with a comprehensive analysis of multiple currency pairs. This   powerful indicator   simplifies the complex nature of the forex market, making it accessible for both novice and experienced traders. AX Forex Indicator uses   advanced algorithms   to detect trends, patterns and is an essential tool for traders aiming to enhance their forex trading performance. With its robust features, ease of use, and reliabl
      RelicusRoad Pro: Квантовая Рыночная Операционная Система СКИДКА 70% ПОЖИЗНЕННЫЙ ДОСТУП (ОГРАНИЧЕНО) - ПРИСОЕДИНЯЙТЕСЬ К 2000+ ТРЕЙДЕРАМ Почему большинство трейдеров теряют деньги даже с «идеальными» индикаторами? Потому что они торгуют Единичными Концепциями в вакууме. Сигнал без контекста — это лотерея. Чтобы выигрывать стабильно, вам нужна КОНФЛЮЭНЦИЯ . RelicusRoad Pro — это не простой стрелочный индикатор. Это полная Количественная Рыночная Экосистема . Она отображает «Дорогу Справедливой Сто
      OrderFlow Absorption – Профессиональный индикатор дельты и сигналов абсорбции для MT4 Откройте для себя настоящую силу анализа потока ордеров с OrderFlow Absorption – лучшим индикатором дельты и сигналов абсорбции для MetaTrader 4. Этот инструмент создан для трейдеров, которые хотят видеть, что действительно происходит за каждым движением цены, выявляя скрытое давление покупателей/продавцов и события абсорбции, которые двигают рынок. Возможности Визуализация дельты:   Мгновенно определяйте давле
      Другие продукты этого автора
      Intro to ProfitKeeper - Equity Basket CloseAll Script, Free edition This is an update from this script  ( mql4 forum | forexfactory :  There were many people requesting some type of equity monitoring tool that can lock in profits after a pre-determined account equity is reached (e.g. close all open trades when profit target is hit). Profitkeeper was built to fulfill this gap for professional and casual traders looking to focus on the bottom line of their equity. This was designed mainly for cos
      Фильтр:
      anjane201
      922
      anjane201 2024.05.16 11:45 
       

      I am not trying to give negative feedback on the indicator but there is no info in any form like a pdf or a video to even understand how to use this product. The author has been supportive and would like to address the issues

      Joshua Graham
      490
      Ответ разработчика Joshua Graham 2024.05.18 00:07
      Hi. The MQL Market contact notification system is not the best. Anyways, I should improve the video on how to use the item. But it's basic usage has not changed all these years. Here: https://www.youtube.com/watch?v=1VOv-Jqn8gk and https://www.youtube.com/watch?v=eKD35vFTaxQ&t=4s And the indicator description in the mql market has a table with an explanation of each input. But I will try to create a video that covers each input more visually. Reach out to me if you have a specific question. I've also answered the chat. It's a measurement tool.
      vincenzo1964
      1130
      vincenzo1964 2024.03.30 09:30 
       

      Пользователь не оставил комментарий к оценке

      Joshua Graham
      490
      Ответ разработчика Joshua Graham 2024.03.30 16:10
      Traduttore dall'inglese: Al momento non ho la versione italiana del manuale di istruzioni. Ma puoi prendere la versione inglese esistente del pdf del white paper e utilizzare il traduttore di Google per tradurla. Ho già alcuni video più vecchi, ma le possibilità sono infinite per Take Profit e Stop Loss. Perché non esiste un modo fisso per utilizzare lo strumento di misurazione APAMI. Sono felice che tu l'abbia noleggiato per sperimentarlo in un account live. Credo che ti piacerà. Sta a te combinarlo con altri indicatori. Ma credo che altri indicatori inibiranno il vostro potenziale di crescita poiché la maggior parte di essi è in ritardo o fuorviante. APAMI non ha ritardi e non si basa su alcuna interpretazione mistica. Se lo desideri, puoi utilizzare APAMI da solo. Puoi sempre inviare un messaggio tramite il sito web in caso di domande.
      Ответ на отзыв