KT Multi Timeframe MACD MT5
- Indicadores
-
KEENBASE SOFTWARE SOLUTIONS
 A Keenbase Trading desenvolve indicadores profissionais e Expert Advisors para MetaTrader 4 e MetaTrader 5, ajudando traders a tomar decisões de negociação mais informadas.
 - Versão: 1.0
- Ativações: 10
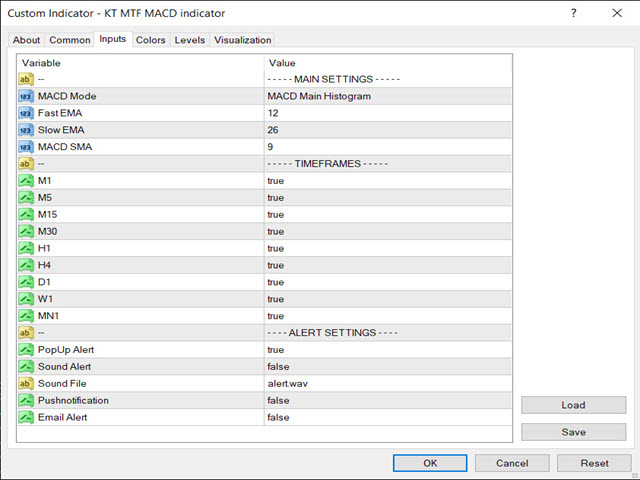
Como trader, monitorar vários períodos de tempo simultaneamente ajuda você a entender melhor a tendência do mercado e identificar quando os diferentes períodos estão alinhados ou em desacordo.
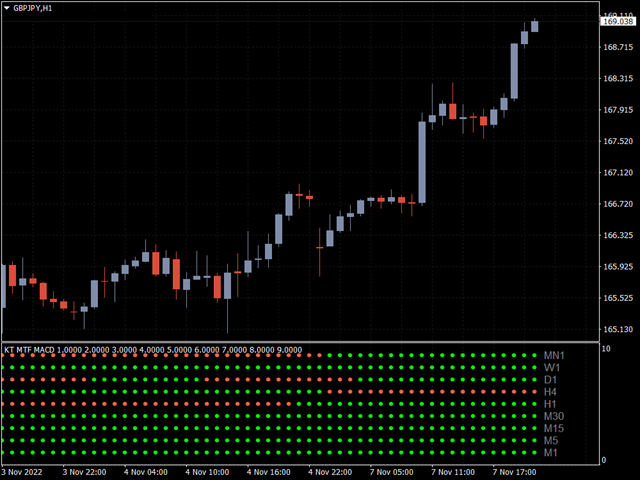
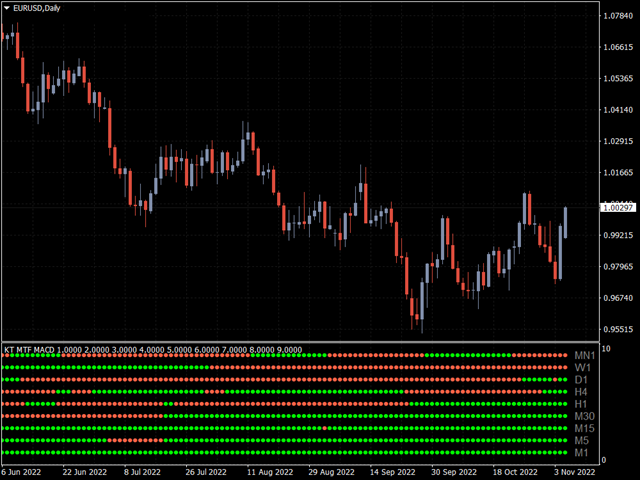
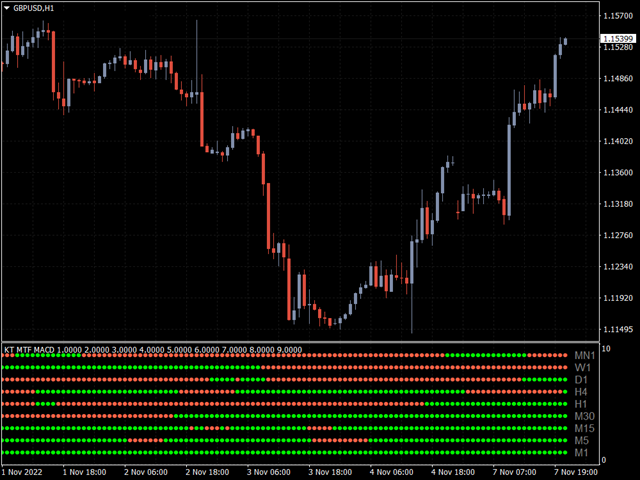
O KT Multiple Time Frame (MTF) MACD exibe a direção geral de um ativo em um único gráfico ao mostrar o MACD (convergência/divergência de médias móveis) de todos os timeframes.
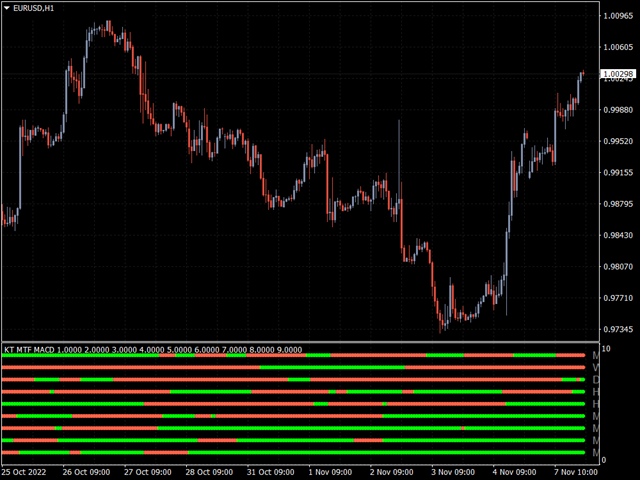
O indicador apresenta uma tabela simples com a tendência do MACD para cada período. Também permite visualizar se o MACD está ganhando ou perdendo força em cada timeframe diretamente no gráfico.
Recursos
- O KT MTF MACD pode monitorar até 5 timeframes, intervalos e ativos diferentes ao mesmo tempo.
- Reconhece as condições de tendência e sinais do MACD para cada fluxo de dados.
- Reduz a complexidade de múltiplos gráficos em diferentes períodos para uma visão geral simplificada em um só lugar.
- Economiza recursos do computador ao utilizar menos gráficos e indicadores.
- Possui recursos avançados de codificação por cores e opções de personalização.
- Inclui também alertas que notificam quando há mudança de tendência.
Conclusão
O uso de múltiplos períodos de tempo é uma excelente maneira de melhorar seus resultados, pois permite encontrar o melhor ponto de entrada dentro de uma tendência de longo prazo.
Com o KT MTF MACD, você não precisa acompanhar o mercado em vários gráficos separados — ele permite visualizar todos os períodos de tempo em um único painel.
Experimente com uma conta demo para entender como integrá-lo em suas estratégias de negociação.