KT Multi Timeframe MACD MT5
- Indicadores
-
KEENBASE SOFTWARE SOLUTIONS
 Keenbase Trading desarrolla indicadores profesionales y Asesores Expertos (Expert Advisors) para MetaTrader 4 y MetaTrader 5, diseñados para ayudar a los traders a tomar decisiones de trading más informadas.
 - Versión: 1.0
- Activaciones: 10
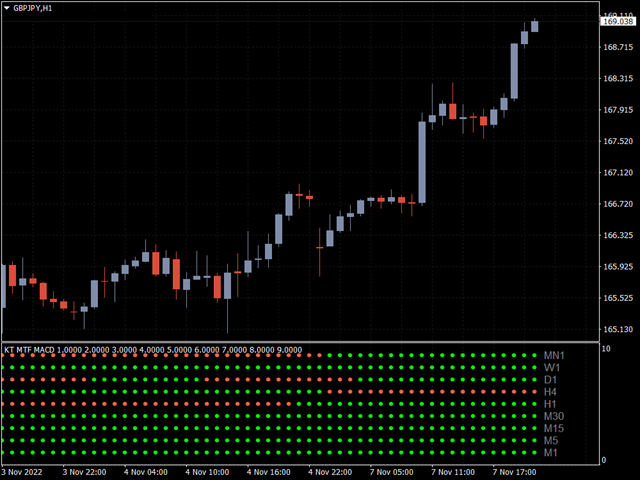
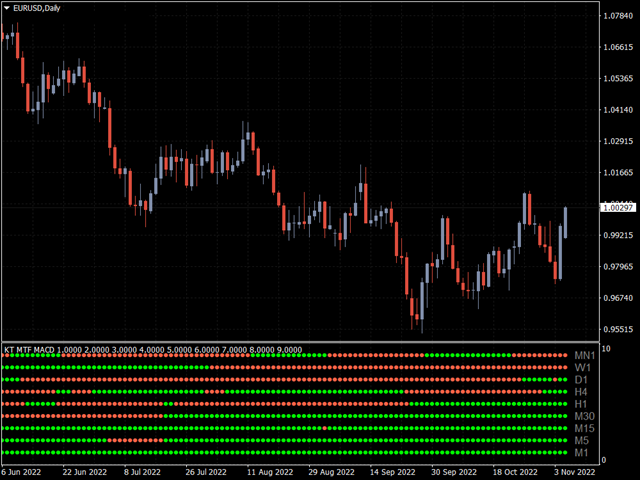
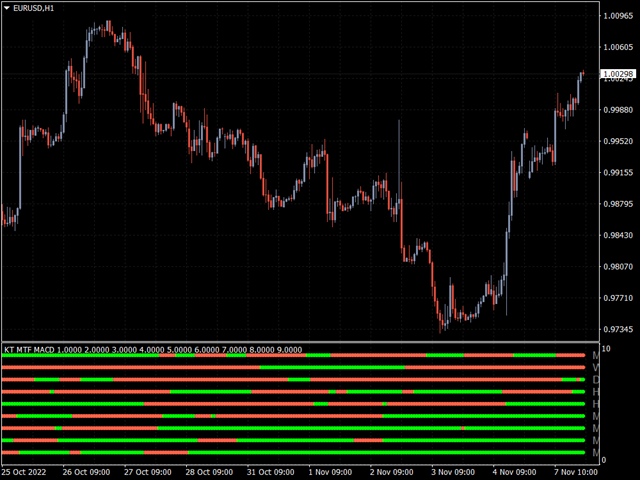
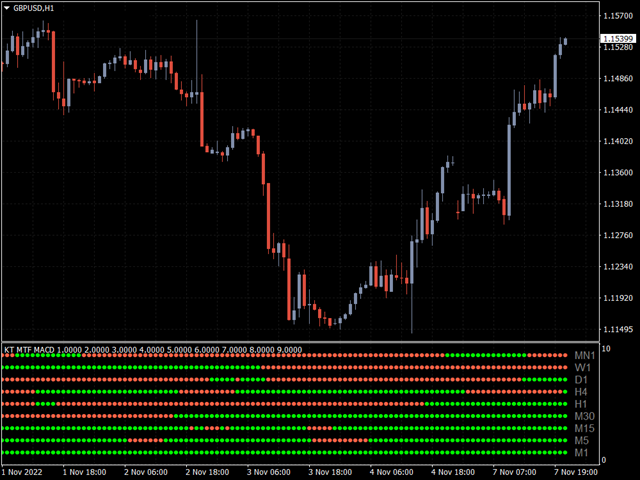
Como trader, supervisar varios marcos de tiempo simultáneamente te ayuda a comprender mejor la tendencia y a identificar cuándo hay concordancia o discrepancia entre los distintos marcos temporales.
KT Multiple Time Frame (MTF) MACD muestra la dirección general de un instrumento en un solo gráfico al representar el MACD (convergencia/divergencia de medias móviles) de todos los marcos de tiempo.
El indicador muestra una tabla simple con la tendencia del MACD para cada marco temporal. También puedes visualizar si el MACD está ganando o perdiendo fuerza en cada uno de ellos directamente en el gráfico.
Características
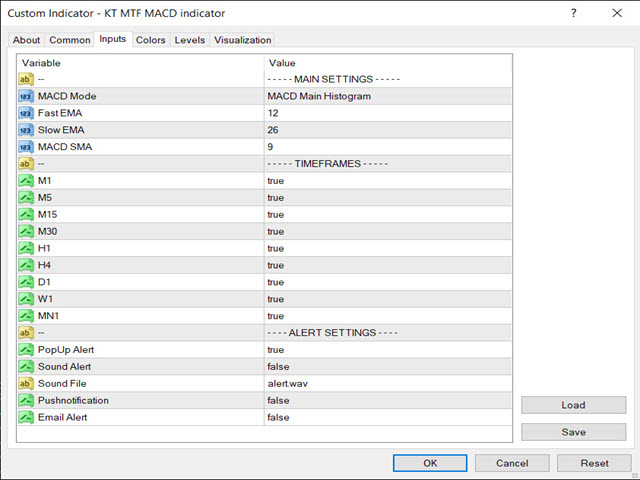
- KT MTF MACD puede monitorear hasta 5 marcos de tiempo, intervalos e instrumentos diferentes al mismo tiempo.
- Reconoce las condiciones y señales de tendencia del MACD para cada flujo de datos.
- Reduce la complejidad de utilizar múltiples gráficos en distintos marcos de tiempo al mostrar un resumen en uno solo.
- Ahorra recursos del PC utilizando menos gráficos e indicadores.
- Incluye funciones avanzadas de codificación por colores y opciones personalizables.
- Cuenta con una función de alerta que notifica cuando la tendencia cambia.
Conclusión
El análisis de múltiples marcos temporales es una excelente forma de mejorar tus resultados, ya que te permite encontrar puntos de entrada óptimos dentro de una tendencia a largo plazo.
Con KT MTF MACD no necesitas revisar cada gráfico por separado; el indicador te permite analizar varios marcos temporales al mismo tiempo en un solo lugar.
Prueba este indicador en una cuenta demo para ver cómo puedes integrarlo en tus estrategias de trading.