KT Multi Timeframe MACD MT5
- Indicatori
-
KEENBASE SOFTWARE SOLUTIONS
 Keenbase Trading sviluppa indicatori professionali ed Expert Advisor per MetaTrader 4 e MetaTrader 5, progettati per aiutare i trader a prendere decisioni di trading più consapevoli.
 - Versione: 1.0
- Attivazioni: 10
Come trader, monitorare più timeframe contemporaneamente ti aiuta a comprendere meglio la tendenza e a sapere quando i diversi timeframe sono in accordo o in contrasto tra loro.
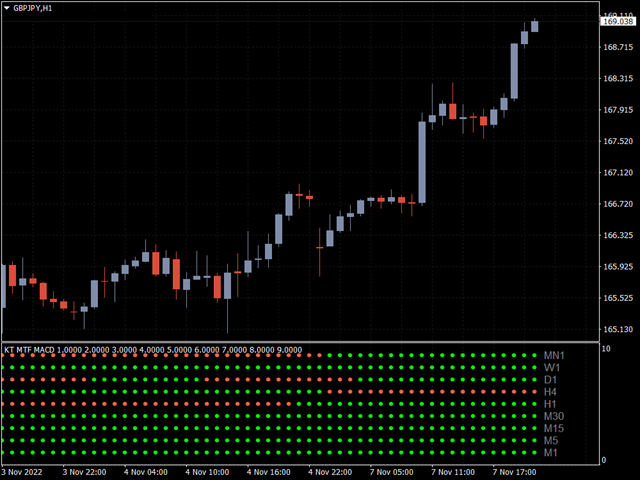
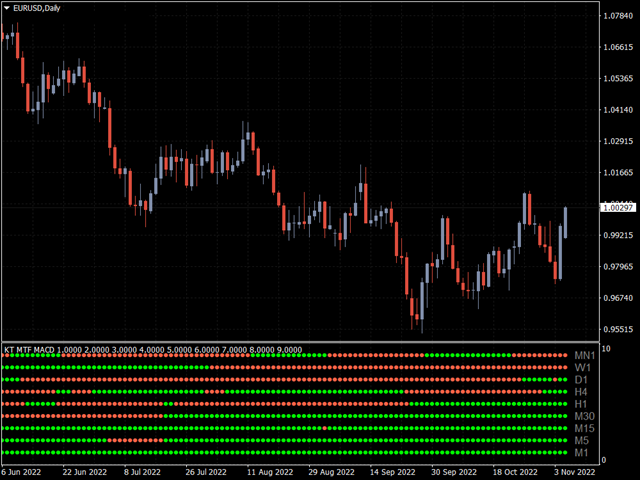
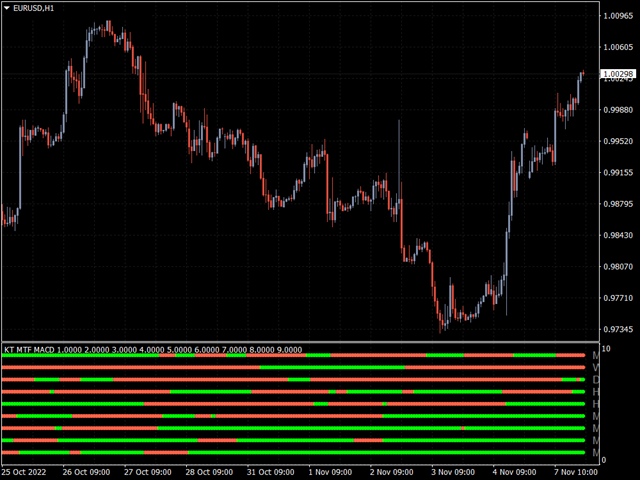
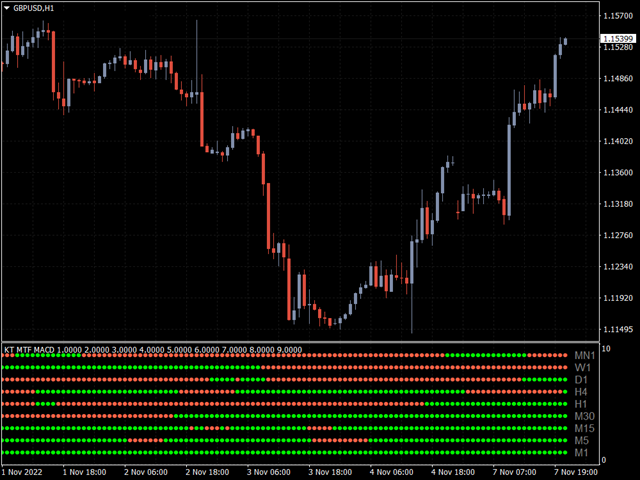
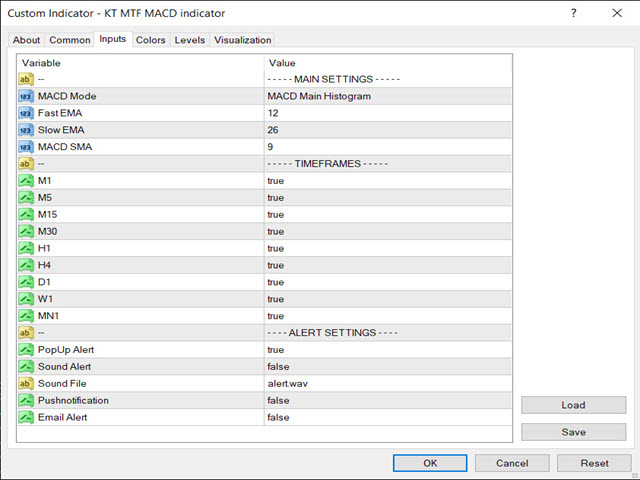
Il KT Multiple Time Frame (MTF) MACD mostra la direzione generale di uno strumento su un unico grafico visualizzando il MACD (Moving Average Convergence Divergence) per tutti i timeframe.
L’indicatore presenta una tabella semplice con la tendenza MACD corrispondente a ciascun timeframe. Inoltre, puoi osservare se il MACD sta guadagnando o perdendo momentum su tutti i timeframe direttamente sul grafico.
Caratteristiche
- Il KT MTF MACD può monitorare fino a 5 timeframe, intervalli e strumenti differenti contemporaneamente.
- Rileva le condizioni di tendenza e i segnali MACD per ogni flusso di dati.
- Riduce la complessità dei grafici multi-timeframe in una visualizzazione riepilogativa unica.
- Risparmia risorse del PC utilizzando meno grafici e indicatori.
- Include funzioni avanzate di codifica a colori e opzioni personalizzabili.
- Include anche un sistema di avviso quando la tendenza cambia.
Conclusione
Il trading multi-timeframe è un ottimo modo per migliorare i tuoi risultati, perché ti consente di individuare il miglior punto d’ingresso all’interno di una tendenza a lungo termine.
Con KT MTF MACD, non è necessario monitorare manualmente ogni timeframe. L’indicatore ti permette di analizzarli tutti in un’unica visualizzazione.
Provalo prima su un conto demo per capire come integrarlo nelle tue strategie di trading.