KT Multi Timeframe MACD MT5
- Indicateurs
-
KEENBASE SOFTWARE SOLUTIONS
 Welcome to Keenbase Trading,
📢 Join our Telegram for real-time updates & algo trading tips: https://t.me/keenbasetrading - Version: 1.0
- Activations: 10
En tant que trader, surveiller plusieurs unités de temps simultanément vous permet de mieux comprendre la tendance générale et de savoir si ces unités de temps sont en accord ou en contradiction.
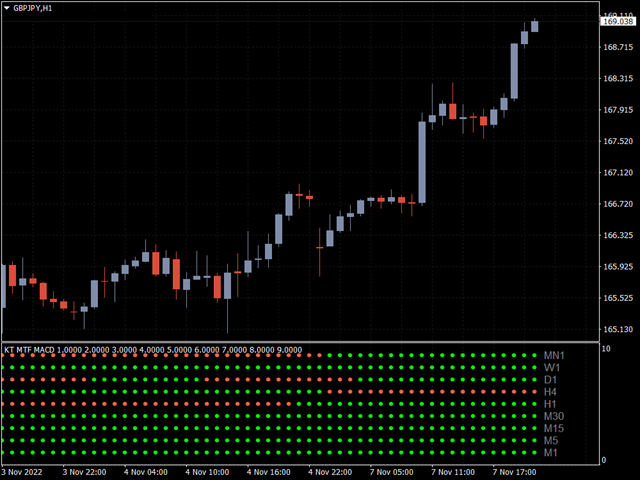
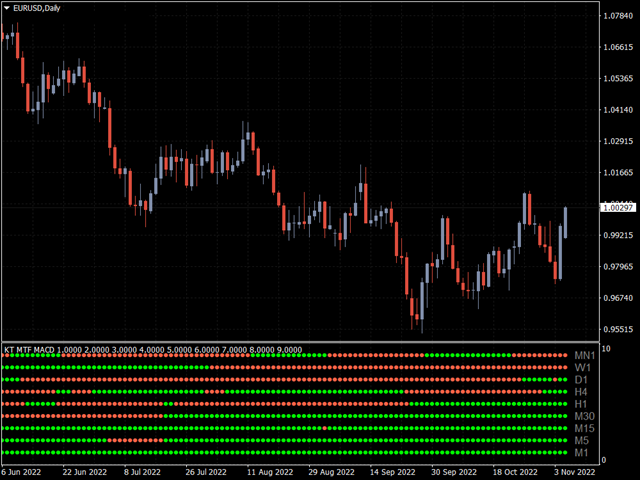
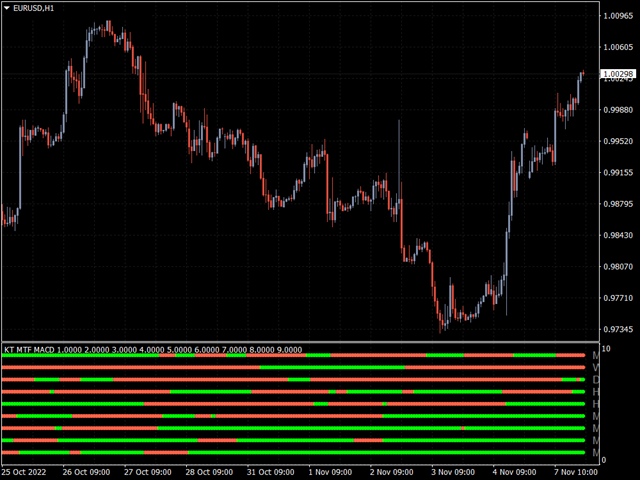
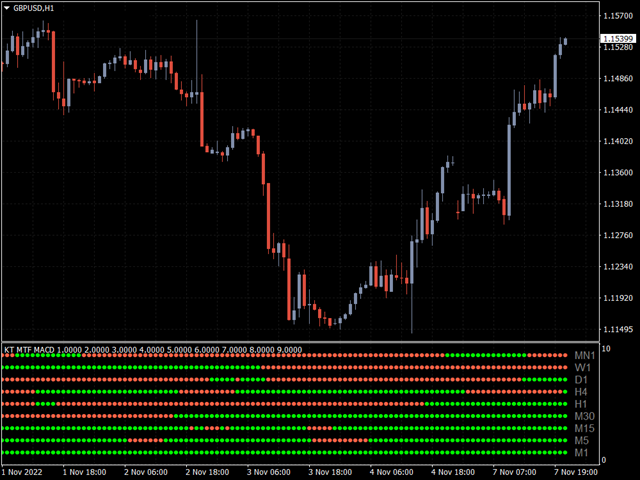
Le KT Multiple Time Frame (MTF) MACD affiche la direction globale d’un instrument sur un seul graphique en montrant la convergence/divergence des moyennes mobiles (MACD) pour toutes les unités de temps.
L’indicateur présente un tableau simple indiquant la tendance MACD associée à chaque unité de temps. Vous pouvez également observer si le MACD gagne ou perd en momentum sur l’ensemble des unités.
Fonctionnalités
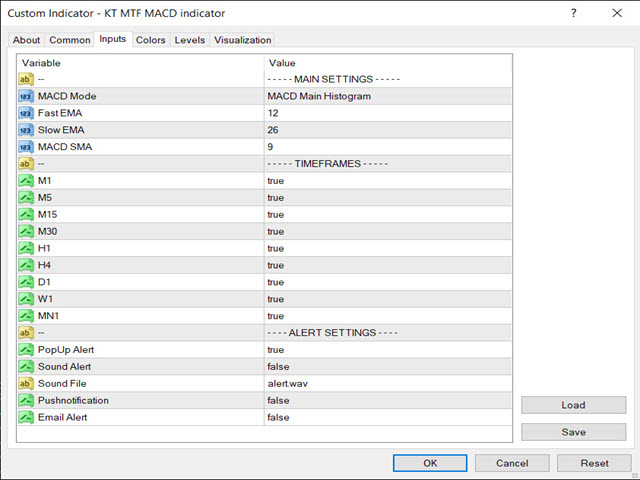
- Le KT MTF MACD peut surveiller simultanément jusqu’à 5 unités de temps, intervalles ou instruments différents.
- Il détecte les conditions de tendance et les signaux MACD pour chaque flux de données.
- Il simplifie l’analyse multi-timeframe en un seul aperçu clair sur un graphique unique.
- Il économise les ressources du PC en réduisant le nombre de graphiques et d’indicateurs nécessaires.
- Il intègre des fonctionnalités de codage couleur avancées et personnalisables.
- Inclut également une alerte en cas de changement de tendance.
Conclusion
Le trading multi-timeframe est un excellent moyen d’améliorer vos performances, car il vous permet de repérer le meilleur point d’entrée dans le cadre d’une tendance à plus long terme.
Avec le KT MTF MACD, vous n’avez plus besoin de suivre le marché sur plusieurs graphiques — il vous offre une vue d’ensemble des différentes unités de temps sur un seul écran.
Essayez l’indicateur sur un compte démo pour voir comment l’intégrer à vos stratégies de trading.