• Visão global
  • Comentários
  • Discussão (1)
  • O que há de novo

HV Models

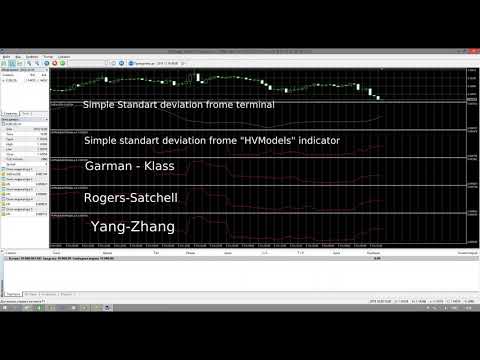
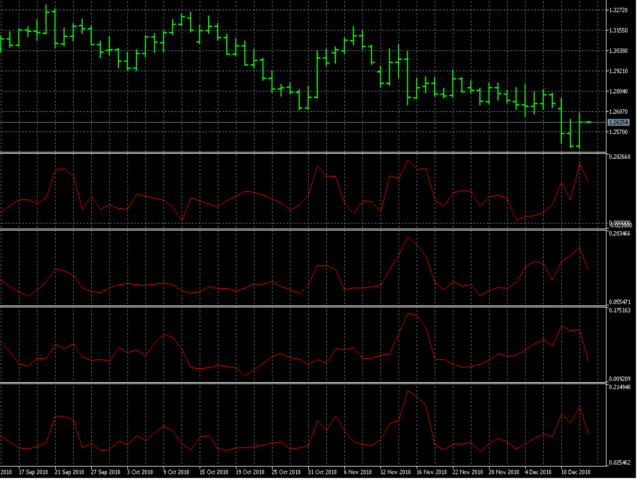
HV Models is an Indicator that containes 4 methods for calculating historical volatility of the selected asset.

Volatility is one of the fundamental values ​​describing changes in the underlying asset. In statistics, it usualy describes as a standard deviation. The price chart has 4 values ​​(Open High Low Close) when we calculate volatility using a standard indicator, only one of these values ​​is used as a result we get one-sided volatility picture. The presented indicator uses 4 volatility calculation formulas developed specifically for financial markets:

Simple:

When choosing this mode, first of all we calculate logrifmic increments by closing price which allows filtering out the trend, seasonality and other inclusions that spoil the volatility picture. then calculates standard deviation - volatility by logrifmic increments.

Garman - Klass:

This variant of volatility takes into account intraday fluctuations in price, unlike the previous version, it focuses on the measurement of candlestick volatility.

Rogers-Satchell

This variant just like the previous version of volatility takes into account the measurement of candle volatility, however this method, compared to the previous one emphasis is placed on measuring each of the price fluctuations (H / C, H / O, LC, LO) - which gives more detailed measurement.

Yang-Zhang

This method combines all the previously described types of volatility calculations. It measures volatility both within the day and in relation to the previous day.


The indicator allows to recalculate volatility from the current timeframe to another one. For example to get annual volatility frome daily volatility parameter "Calendar Amendment"  must be equals to 365 (dayse per year). To recalculate minute volatility to one year volatiolity paranetr Calendar Amendment mast be equal to 525600. This number was found using following formula: (24 (hours per day) * 60 (minutes per hour) * 365 (days per year)). If this parameter equals 1, the recalculation is not performed and the volatility is shown for the selected timeframe.

For those who will use the indicator in EA - the indicator has 2 buffers, however the indicator itself is stored in a buffer with a zero index.


Produtos recomendados
MW Manual Trading Helper
Martin Bittencourt
5 (1)
O indicador Martinware Manual Trading Helper (Auxiliar de Negociação Manual) tem por objetivo ajudar as pessoas a iniciar suas vidas na especulação manual. Ele pode ser usado para exibir tanto algumas imagens genéricas no lado direito do gráfico, onde observações operacionais personalizadas podem ser exibidas, quanto apenas um retângulo em branco que oculta o gráfico durante o backtest. Além disso, pode reproduzir periodicamente uma lista de sons. Para mostrar um retângulo em branco, deixe o pr
FREE
Multiple Timeframe MACD indicator. This indicator was built for making multiple timeframe analysis possible in MT5 using MACD Indicator. MACD Indicator traditionally shows two lines and one histogram. MACD Line(Yellow) is calculated by subtracting 12period EMA(fast) from 26period EMA (slow). Signal Line(Blue) is created by a 9period EMA from MACD Line. Histogram is just the difference between MACD and Signal lines. Histogram is colored based on the difference between its value and the previous h
Volume Profile Indicator used by professional Traders at Traders Inside Ltd. If you want to succeed in trading you need to know if current price is cheap, expensive or fair valued. Key features: Fair price (Point of control, POC), high and low price zones (POH, POL) POC in different timeframes for better orientation Symbol and timeframe Chart resize on open positions/orders, VPRmax/min Historic POC - see, how POC has changed the last periods Button to show/hide VPR Calculated Bars (best results
Exclusive Arrival: Presenting for the First Time . This is your secret weapon for predicting which way the wind will blow with the next market shift. It assists you in developing your trading strategy by predicting the direction of the next candle.  Compatible with forex, stocks, and cryptocurrencies on all timeframes, but higher timeframes are recommended. MT4 Version -  https://www.mql5.com/en/market/product/108931/ How does it work ? It's pretty neat. The algorithm separates green and red ca
Based on the Dow Theory, the system automatically draws a turning point, which is the starting point for buying or selling. It also automatically tells you whether the market is in a buying or selling condition and recognizes the environment. It is also a good tool to prevent false trades and to make profitable trades. We are live-streaming the actual operation of the system. Please check for yourself if it is usable. Please check it out for yourself. https://www.youtube.com/@ganesha_forex
Este é o indicador de Bandas Bollinger da Gekko. Ele amplia o uso das famosas bandas de bollinger e calcula sinais fortes de entrada e saída usando a ação do preço contra as bandas superior, inferior e do meio. Você pode configurá-lo de muitas maneiras diferentes, por exemplo: pullback, pullback contra a tendência, cruzamento da banda do meio, etc. Parâmetros de Entrada Number of Bars to Plot Indicator:  número de barras históricas para plotar o indicador, mantenha  baixo para melhor desempenho;
O indicador rastreia a tendência em 5 tempos gráficos diferentes do mesmo ativo, tendo como base 6 sinais par cada tempo gráfico. O indicador tem como principal objetivo, nos mostrar a tendência majoritária do ativo financeiro em que ele foi colocado. O sistema passa as informações das tendências em diversos tempos gráficos, dessa forma o usuário consegue ter uma visão ampla do movimento do ativo, este tipo de ferramenta faz com que o usuário tenha uma maior taxa de acerto pelo fato de auxili
XCalper HiLo Activator
Aecio de Feo Flora Neto
HiLo Activator v1.02 by xCalper The HiLo Activator is similar to moving average of previous highs and lows. It is a trend-following indicator used to display market’s direction of movement. The indicator is responsible for entry signals and also helps determine stop-loss levels. The HiLo Activator was first introduced by Robert Krausz in the Feb. 1998 issue of Stocks & Commodities Magazine.
The   Advanced Trend Scalper MT5  indicator is designed to help both novices and professional traders. The indicator analyses the market and gives you buy and sell signals. It does not use any other indicators, it works only with the market actions. The signal appears right after the candle close and it does not repaint. The efficient algorithm provides a high degree of reliability of such signals.  Advanced Trend Scalpe r  for the MetaTrader 4 terminal :  https://www.mql5.com/en/market/product/
DG TrendSigns
David Gadelha
3 (1)
Purpose DG Trend+Signs is an indicator that paints candles with trend colors and clearly shows consolidations, using both DoGMA Trend and DoGMA Channel indicators. It was created to help users in their trades, showing trends, consolidations and marking entry and exit points. The indicator also takes consolidations in consideration to identify breakouts. Key features Designed to be simple to use, with a few parameters Does NOT repaint Does NOT recalculate Signals on entries Works in ALL pairs W
TrukhinREAL
Andrei Trukhin
This indicator is designed for those people who want to trade and make money on any instrument and time frame. It gives a very good point to enter the market, to trade is very simple, arrows will show when to open a deal, set and trade without thinking about anything, stop-loss and take profit, set everything depends on your trading style, who is scalping and who keeps the deal for a few days.
Pinpoint Pro MT5
Habibu Asini Shabani
Pinpoint Pro Indicator is a multi-time frames indicator, which uses more than five built-in MT5 indicator to generate trading signals. This indicator can perform several functions, such as: Send signals notification to mobile phone Gives precise signal entry upon following signal checklist points Can be used in all market such as currency pairs, stock market, metals, commodity, synthetic pairs and cryptocurrency pairs  One built-in indicator can be used for signal verification before entering th
Outside The Box
Innovicient Limited
The Outside The Box (OTB) is a complete trading system that provides the user with immense trading ability by highlighting on the chart areas where the trader should prepare to Re-enter the trend after pullbacks (Pullback trading strategy) Take partial/complete profit(Profit taking strategy), and Trade breakouts (Stock breakout strategy) - We have updated the indicator to show/hide Micro breakout areas around the major breakouts (Micro Breakouts).  The above is supported by an alert system to no
The Hurst Exponent gauges a time series' long-term memory and is named after Harold Edwin Hurst. The MetaTrader's Hurst Exponent Indicator analyzes an asset's price memory, helping predict future trends. It's valuable for traders of all levels, suitable for various styles like scalping or swing trading. In Forex terms, the Hurst Exponent measures a series' dependence, indicating whether it regresses to the mean or clusters in a direction. H values between 0.5-1 suggest positive autocorrelatio
Index Volatility Trend
Pedro Luis Oiaz Villamar
Indicador de tendência de volatilidade do índice. Características principais: É usado apenas para Índices Sintéticos no corretor Binário ou Deriv, que são os mesmos. Possui filtro de tendência. Possui um alerta sonoro para alertar sobre uma possível queda de preço. Ele pode enviar alertas móveis se você o colocar em um VPS. Ele é configurado com o algoritmo L566b12, projetado para melhor eficiência. Como usar o indicador Funciona na temporalidade de M1. A tendência deve ser forte
Noize Absorption Index - is the manual trading system that measures the difference of pressure between bears forces and bulls forces. Green line - is a noize free index that showing curent situation. Zero value of index shows totally choppy/flat market.Values above zero level shows how powerfull bullish wave is and values below zero measures bearish forces.Up arrow appears on bearish market when it's ready to reverse, dn arrow appears on weak bullish market, as a result of reverse expectation.
Differential Marker
Ruslan Ziyatdinov
5 (1)
The dream of any trader is to predict the trend reversal point. The Differential Marker indicator calculates the differential of the chart of currency pair rates in real time. Thus, it becomes possible to predict the extremes of the live chart and predict the trend reversal points. Using differentiation of the chart in real time significantly facilitates trading, and when used in experts, makes them more efficient and reduces the drawdown. For a more accurate forecast, it is necessary to optimiz
Strong Candle Indica o tamanho de cada vela com o valor em texto acima dela e indica qual vela possui um corpo maior que o especificado nos parametros em porcentagem, ou seja, uma vela forte (entre Size_Min e Size_Max) com no minimo x% de corpo. O tamanho da vela é colocado no buffer e essa é a indicação de compra ou venda, sendo: valor > 0 = vela de alta ou valor < 0 vela de baixa, valor = 0 significa nenhuma indicação (a vela não correspondeu ao padrão desejado)
Currency pairs never go up or down in a straight line. They rise and fall constantly, creating pullbacks and reversals. And with each rise and fall, so your emotions rise and fall. Hope, then fear, then hope. This is when the market will try to frighten you out of a strong position. It is when you are most vulnerable. But not if you have the Quantum Trend Monitor. And here, you even get two indicators for the price of one! The Quantum Trend Monitor has been designed to absorb these temporary pau
A lot of professional traders use high quality divergence signals as a part of their strategy to enter a position. Spotting correct divergences quickly can often be hard, especially if your eye isn’t trained for it yet. For this reason we’ve created a series of easy to use professional oscillator divergence indicators that are very customisable so you get only the signals you want to trade. We have this divergence indicator for RSI, MACD, Stochastics, CCI and OBV. RSI:   https://www.mql5.com/en/
Trend Direction ADX indicator Trend Direction ADX is part of a serie of indicators used to characterize market conditions. Almost any strategy only work under certain market conditions. Therefore it is important to be able to characterize market conditions at any time: trend direction, trend strength, volatility, etc.. Trend Direction ADX is an indicator to be used to characterize trend direction: trending up trending down ranging Trend Direction ADX is based on ADX standard indicator.
How to use Pair Trading Station Pair Trading Station is recommended for H1 time frame and you can use it for any currency pairs. To generate buy and sell signal, follow few steps below to apply Pair Trading Station to your MetaTrader terminal. When you load Pair Trading Station on your chart, Pair Trading station will assess available historical data in your MetaTrader platforms for each currency pair. On your chart, the amount of historical data available will be displayed for each currency pai
O produto DidiScanner trabalha procurando as famosas "Agulhadas", mundialmente conhecida, a estratégia foi desenvolvida pelo analista Odir Aguiar (Didi). O conceito é muito simples, quando você insere 3 Médias Móveis em exibição, um período igual a 3, um igual a 8 e outro igual a 20, surge então a formação do padrão que trabalha em eixo ou centro de linha igual a 0 (zero). É necessário ocorrer a intersecção das médias móveis ao se aproximarem da linha 0. O scanner monitora 100(cem) papéis da ca
This indicator scans the 1-3 Trendline pattern . The indicator is a 100 % non repaint low risk breakout system . The patterns are formed around swing high and swing lows which make them a low risk pattern with high reward. PATTERN BACKGROUND The 1-3 Trendline Breakout pattern is formed by four(4) points which are composed of three (3) primary points and the pattern neck. A trendline is always formed by the point 1 and the neck of the pattern . When price breaks out of the trendline formed ,
Buy DEMA 3 Scalp  Indicator, Signaling and Trend Finder for Forex DEMA 3 indicator is a professional indicator for finding trends as well as finding entry and exit points for a symbol. This indicator is designed based on the DEMA indicator, which can tell you the signals accurately and quickly. The DEMA 3 indicator can give you accurate and early entry points for swings. Features of the DEMA indicator 3 Receive signals as notifications on the Metatrader mobile application. Receive signals by em
Tipo:  Padrão/Tendência Este é o famoso indicador da Gekko chamado de Strong Bars (Barras Fortes), ele produzirá um sinal toda vez que houver uma barra forte, maior que a média das últimas barras, ultrapassando topos e fundos das últimas barras com uma cauda curta de candle. Parâmetros de Entrada Plot Strong Bar Arrows for the past X Historical Bars:  número de barras históricas que o indicador irá plotar os sinais; How the Size of Bars will be calculated:  1- Tamanho da barra será calculado pel
What is KTrend indicator ? KTrend is a powerful indicator for trading medium-term binary options that identify the trend of price by candlesticks. Sell signal is formed when the value is below the zero line. Similarly, buy signal is formed when the value is above the zero line. It is separated from KTrend trading system and you can get the backtest result from the pictures below.
This indicator builds upon the previously posted Nadaraya-Watson smoothers. Here we have created an envelope indicator based on Kernel Smoothing with integrated alerts from crosses between the price and envelope extremities. Unlike the Nadaraya-Watson estimator, this indicator follows a contrarian methodology. Please note that by default this indicator can be subject to repainting. Users can use a non-repainting smoothing method available from the settings. The triangle labels are designed
O HAshi-E é uma forma aprimorada de analisar os sinais do Heiken-Ashi. Resumo: O Heiken-Ashi é particularmente valorizado por sua capacidade de filtrar a volatilidade de curto prazo, o que o torna a ferramenta preferida para identificar e acompanhar tendências, ajuda na tomada de decisões sobre pontos de entrada e saída e auxilia na distinção entre sinais falsos e reversões genuínas de tendências. Diferentemente dos gráficos de velas tradicionais, as velas Heiken-Ashi são calculadas usando
Os compradores deste produto também adquirem
Atomic Analyst MT5
Issam Kassas
4.22 (9)
Primeiramente, vale ressaltar que este Indicador de Negociação não repinta, não redesenha e não apresenta atrasos, tornando-o ideal tanto para negociação manual quanto automatizada. O Analista Atômico é um Indicador de Ação de Preço PA que utiliza a força e o momentum do preço para encontrar uma vantagem melhor no mercado. Equipado com filtros avançados que ajudam a remover ruídos e sinais falsos, e aumentam o potencial de negociação. Utilizando múltiplas camadas de indicadores complexos, o A
Primeiramente, vale ressaltar que este Sistema de Trading é um Indicador Não Repintado, Não Redesenho e Não Atrasado, o que o torna ideal tanto para o trading manual quanto para o automatizado. O "Sistema de Trading Inteligente MT5" é uma solução completa de trading projetada para traders novos e experientes. Ele combina mais de 10 indicadores premium e apresenta mais de 7 estratégias de trading robustas, tornando-o uma escolha versátil para diversas condições de mercado. Estratégia de Seguime
Quantum Trend Sniper
Bogdan Ion Puscasu
5 (36)
Apresentando       Quantum Trend Sniper Indicator   , o inovador Indicador MQL5 que está transformando a maneira como você identifica e negocia as reversões de tendência! Desenvolvido por uma equipe de traders experientes com experiência comercial de mais de 13 anos,       Indicador de Atirador de Tendência Quântica       foi projetado para impulsionar sua jornada de negociação a novos patamares com sua forma inovadora de identificar reversões de tendência com precisão extremamente alta. ***C
Trend Screener Pro MT5
STE S.S.COMPANY
4.89 (61)
Desbloqueie o poder da negociação de tendências com o indicador Trend Screener: sua solução definitiva de negociação de tendências, alimentada por lógica difusa e sistema de múltiplas moedas! Eleve sua negociação de tendências com o Trend Screener, o revolucionário indicador de tendências alimentado por lógica difusa. É um poderoso indicador de acompanhamento de tendências que combina mais de 13 ferramentas e recursos premium e 3 estratégias de negociação, tornando-o uma escolha versátil para to
Advanced Supply Demand MT5
Bernhard Schweigert
4.53 (15)
Atualmente com 33% de desconto! A melhor solução para qualquer Trader Novato ou especialista! Este indicador é uma ferramenta de negociação exclusiva, de alta qualidade e acessível porque incorporamos uma série de recursos proprietários e uma nova fórmula. Com esta atualização, você poderá mostrar fusos horários duplos. Você não só será capaz de mostrar um TF mais alto, mas também mostrar ambos, o TF do gráfico, MAIS o TF mais alto: MOSTRANDO ZONAS ANINHADAS. Todos os traders de Oferta e Demanda
RelicusRoad Pro MT5
Relicus LLC
4.81 (21)
Agora US $ 147 (aumentando para US $ 499 após algumas atualizações) - Contas ilimitadas (PCs ou Macs) Manual do usuário do RelicusRoad + vídeos de treinamento + acesso ao grupo de discórdia privado + status VIP UMA NOVA FORMA DE OLHAR PARA O MERCADO O RelicusRoad é o indicador de negociação mais poderoso do mundo para forex, futuros, criptomoedas, ações e índices, oferecendo aos traders todas as informações e ferramentas necessárias para se manterem rentáveis. Fornecemos análises técnica
Antes de tudo, vale ressaltar que esta Ferramenta de Negociação é um Indicador Não Repintante, Não Redesenhante e Não Atrasado, o que a torna ideal para negociação profissional. O Indicador de Conceitos de Ação de Preço Inteligente é uma ferramenta muito poderosa tanto para traders novos quanto experientes. Ele combina mais de 20 indicadores úteis em um único, combinando ideias avançadas de negociação como Análise do Trader do Círculo Interno e Estratégias de Negociação de Conceitos de Dinhei
Apresentando       Quantum Breakout PRO   , o inovador Indicador MQL5 que está transformando a maneira como você negocia Breakout Zones! Desenvolvido por uma equipe de traders experientes com experiência comercial de mais de 13 anos,       Quantum Breakout PRO       foi projetado para impulsionar sua jornada comercial a novos patamares com sua estratégia de zona de fuga inovadora e dinâmica. O Quantum Breakout Indicator lhe dará setas de sinal em zonas de breakout com 5 zonas-alvo de lucro e
FX Power MT5 NG
Daniel Stein
5 (4)
Receba a sua atualização diária do mercado com detalhes e screenshots através do nosso Morning Briefing aqui no mql5 e no Telegram ! O FX Power MT5 NG é a próxima geração do nosso medidor de força de moeda muito popular de longa data, o FX Power. E o que é que este medidor de força da próxima geração oferece? Tudo o que adorou no FX Power original MAIS Análise de força GOLD/XAU Resultados de cálculo ainda mais precisos Períodos de análise configuráveis individualmente Limite de cálculo personal
AW Trend Predictor MT5
AW Trading Software Limited
4.76 (54)
A combinação de níveis de tendência e quebra em um sistema. Um algoritmo de indicador avançado filtra o ruído do mercado, determina a tendência, os pontos de entrada e os possíveis níveis de saída. Os sinais indicadores são registrados em um módulo estatístico, que permite selecionar as ferramentas mais adequadas, mostrando a eficácia do histórico do sinal. O indicador calcula as marcas Take Profit e Stop Loss. Manual e instruções ->   AQUI   / versão MT4 ->   AQUI Como negociar com o indicador
FX Volume MT5
Daniel Stein
4.94 (17)
Receba a sua atualização diária do mercado com detalhes e screenshots através do nosso Morning Briefing aqui no mql5 e no Telegram ! O Volume FX é o PRIMEIRO e ÚNICO indicador de volume que fornece uma visão REAL do sentimento do mercado do ponto de vista de um corretor. Ele fornece uma visão incrível de como os participantes do mercado institucional, como corretores, estão posicionados no mercado Forex, muito mais rápido do que os relatórios COT. Ver essas informações diretamente no seu gráfi
Este é um indicador para MT5 que fornece sinais precisos para entrar em uma negociação sem redesenhar. Ele pode ser aplicado a qualquer ativo financeiro: forex, criptomoedas, metais, ações, índices. Ele fornecerá estimativas bastante precisas e informará quando é melhor abrir e fechar um negócio. Assista o vídeo (6:22) com um exemplo de processamento de apenas um sinal que compensou o indicador! A maioria dos traders melhora seus resultados de negociação durante a primeira semana de negociação c
TPSpro TRENDPRO  - is a trend indicator that automatically analyzes the market and provides information about the trend and each of its changes, as well as giving signals for entering trades without redrawing! The indicator uses each candle, analyzing them separately. referring to different impulses - up or down impulse. Exact entry points into transactions for currencies, crypto, metals, stocks, indices!  -  Version MT4                  DETAILED DESCRIPTION        /       TRADING SETUPS       
Bill Williams Advanced
Siarhei Vashchylka
5 (3)
Bill Williams Advanced is designed for automatic chart analysis using Bill Williams' "Profitunity" system. The indicator analyzes four timeframes at once. Manual (Be sure to read before purchasing) Advantages 1. Automatically analyzes the chart using the "Profitunity" system of Bill Williams. The found signals are placed in a table in the corner of the screen. 2. Equipped with a trend filter based on the Alligator indicator. Most of the system signals are recommended to be used only accordi
ICT, SMC, SMART MONEY CONCEPTS, SMART MONEY, Smart Money Concept, Support and Resistance, Trend Analysis, Price Action, Market Structure, Order Blocks, BOS/CHoCH,   Breaker Blocks ,  Momentum Shift,   Supply&Demand Zone/Order Blocks , Strong Imbalance,   HH/LL/HL/LH,    Fair Value Gap, FVG,  Premium  &   Discount   Zones, Fibonacci Retracement, OTE, Buy Side Liquidity, Sell Side Liquidity, BSL/SSL Taken, Equal Highs & Lows, MTF Dashboard, Multiple Time Frame, BigBar, HTF OB, HTF Market Structure
TrendMaestro5
Stefano Frisetti
note: this indicator is for METATRADER4, if you want the version for METATRADER5 this is the link:  https://www.mql5.com/it/market/product/108106 TRENDMAESTRO recognizes a new TREND in the bud, he never makes mistakes. The certainty of identifying a new TREND is priceless. DESCRIPTION TRENDMAESTRO identifies a new TREND in the bud, this indicator examines the volatility, volumes and momentum to identify the moment in which there is an explosion of one or more of these data and therefore the mome
Auto Order Block with break of structure based on ICT and Smart Money Concepts Futures Break of Structure ( BoS )             Order block ( OB )            Higher time frame Order block / Point of Interest ( POI )    shown on current chart           Fair value Gap ( FVG ) / Imbalance   ,  MTF      ( Multi Time Frame )    Volume Imbalance     ,  MTF          vIMB Gap’s Equal High / Low’s     ,  MTF             EQH / EQL Liquidity               Current Day High / Low           HOD /
TrendDecoder Premium MT5
Christophe, Pa Trouillas
5 (1)
Identifica os intervalos e os próximos movimentos prováveis  |  Obter os primeiros sinais e a força das tendências  |  Obter saídas claras antes da reversão | Detetar os níveis Fibo que o preço irá testar   |  Indicador não repintável e não atrasado - ideal para trading manual e automatizado - adequado para todos os activos e todas as unidades de tempo $69   no lançamento - depois volta a >>   $149 Após a compra,   por favor contacte-me neste canal  para obter as definições recomendadas Versão
XQ Indicator MetaTrader 5
Marzena Maria Szmit
5 (1)
Step into the realm of Forex trading with confidence and precision using XQ, a cutting-edge Forex indicator designed to elevate your trading game to unprecedented heights. Whether you're a seasoned trader or just stepping into the world of currency exchange, XQ Forex Indicator empowers you with the insights and signals needed to make informed trading decisions. The signal conditions are a combination of three indicators, and XQ Forex Indicator only display  medium and long-term trends . The ind
Torne-se um Negociador Breaker e lucre com as mudanças na estrutura do mercado à medida que o preço reverte. O indicador de quebra de bloco de pedidos identifica quando uma tendência ou movimento de preço está chegando à exaustão e pronto para reverter. Ele o alerta sobre mudanças na estrutura do mercado, que normalmente ocorrem quando uma reversão ou uma grande retração está prestes a ocorrer. O indicador usa um cálculo proprietário que identifica rupturas e momento do preço. Toda vez que
TrendLine PRO MT5
Evgenii Aksenov
4.78 (49)
The Trend Line PRO indicator is an independent trading strategy. It shows the trend change, the entry point to the transaction, as well as automatically calculates three levels of Take Profit and Stop Loss protection Trend Line PRO is perfect for all Meta Trader symbols: currencies, metals, cryptocurrencies, stocks and indices Advantages of Trend Line PRO Never redraws its signals The possibility of using it as an independent strategy It has three automatic levels Take Profit and Stop Loss lev
IX Power MT5
Daniel Stein
5 (1)
O   IX Power   traz finalmente a precisão imbatível do FX Power para símbolos não-Forex. Determina com exatidão a intensidade das tendências a curto, médio e longo prazo nos seus índices, acções, mercadorias, ETFs e até criptomoedas favoritos. Pode   analisar tudo o que   o seu terminal tem para oferecer. Experimente e veja como   o seu timing melhora significativamente   quando negoceia. Características principais do IX Power Resultados de cálculo 100% precisos e sem repintura - para tod
The Volume by Price Indicator for MetaTrader 5 features Volume Profile and Market Profile TPO (Time Price Opportunity). Get valuable insights out of currencies, equities and commodities data. Gain an edge trading financial markets. Volume and TPO histogram bar and line charts. Volume Footprint charts. TPO letter and block marker charts including split structures. Versatile segmentation and compositing methods. Static, dynamic and flexible ranges with relative and/or absolute visualizations. Lay
Quantum Heiken Ashi PRO MT5
Bogdan Ion Puscasu
4.5 (8)
Apresentando o   Quantum Heiken Ashi PRO Projetadas para fornecer informações claras sobre as tendências do mercado, as velas Heiken Ashi são conhecidas por sua capacidade de filtrar o ruído e eliminar sinais falsos. Diga adeus às confusas flutuações de preços e olá para uma representação gráfica mais suave e confiável. O que torna o Quantum Heiken Ashi PRO verdadeiramente único é sua fórmula inovadora, que transforma os dados tradicionais de velas em barras coloridas fáceis de ler. As barras ve
A key element in trading is zones or levels from which decisions to buy or sell a trading instrument are made. Despite attempts by major players to conceal their presence in the market, they inevitably leave traces. Our task was to learn how to identify these traces and interpret them correctly. Reversal First Impulse levels (RFI)   -  Version MT4                  INSTRUCTIONS                 RUS                 ENG                         R ecommended to use with an indicator   -  TREND PRO  
Was: $249  Now: $99   Market Profile defines a number of day types that can help the trader to determine market behaviour. A key feature is the Value Area, representing the range of price action where 70% of trading took place. Understanding the Value Area can give traders valuable insight into market direction and establish the higher odds trade. It is an excellent addition to any system you may be using. Inspired by Jim Dalton’s book “Mind Over Markets”, this indicator is designed to suit the
Dark Power MT5
Marco Solito
4.84 (56)
Dark Power  is an Indicator for intraday trading. This Indicator is based on   Trend Following  strategy, also adopting the use of an histogram to determine the right power . We can enter in good price with this Indicator, in order to follow the   strong trend   on the current instrument. The histogram is calculated based on the size of the bars and two moving averages calculated on the histogram determine the direction of the signal Key benefits Easily visible take profit/stop loss lines Int
Golden Gate Algo MT5
James David Lane
4 (6)
40% DE DESCONTO PARA O NATAL! AUMENTO DE PREÇO PARA $250 EM 1º DE JANEIRO! Apresentando GoldenGate Entries: Uma Solução de Negociação de Ponta! Descubra uma abordagem revolucionária para a negociação com o GoldenGate Entries (GGE), um indicador avançado projetado para elevar sua experiência de negociação. O GGE oferece um conjunto abrangente de recursos para capacitar os usuários com precisão e confiança em suas decisões de negociação. Pares: Qualquer (FX - Commodities - Equities - Ações
Gartley Hunter Multi
Siarhei Vashchylka
5 (5)
Gartley Hunter Multi - An indicator for searching for harmonic patterns simultaneously on dozens of trading instruments and on all classic timeframes: (m1, m5, m15, m30, H1, H4, D1, Wk, Mn). Manual (Be sure to read before purchasing) | Version for MT4 Advantages 1. Patterns: Gartley, Butterfly, Shark, Crab. Bat, Alternate Bat, Deep Crab, Cypher 2. Simultaneous search for patterns on dozens of trading instruments and on all classic timeframes 3. Search for patterns of all possible sizes. Fr
PZ Swing Trading MT5
PZ TRADING SLU
5 (4)
Swing Trading é o primeiro indicador projetado para detectar oscilações na direção da tendência e possíveis oscilações de reversão. Ele usa a abordagem de negociação de linha de base, amplamente descrita na literatura de negociação. O indicador estuda vários vetores de preço e tempo para rastrear a direção da tendência agregada e detecta situações nas quais o mercado está sobrevendido ou sobrecomprado em excesso e pronto para corrigir. [ Guia de instalação | Guia de atualização | Solução de prob
Filtro:
Sem comentários
Responder ao comentário
Versão 1.2 2018.12.16
Yang-Zhang method was added.
Versão 1.1 2018.12.13
Ускорена процедура расчета волатильности