Volume Trio
- Göstergeler
- Sürüm: 1.44
- Güncellendi: 7 Ağustos 2026

Three institutional lenses. One deterministic engine.
Most tools show you one dimension of the market. This indicator fuses the three that professionals cross-check constantly — and makes them talk to each other on a single chart:
- WHERE — Session Volume Profile. Per-session horizontal profiles with POC, VAH/VAL and a shaded Value Area, split into buying vs. selling pressure. You see the levels the market has actually accepted — and the thin air pockets it hasn't.
- WHEN — CVD Pressure Divergence. A signed volume-pressure histogram with a strict, multi-gate Regular divergence engine (Classic -> Continuity -> Swing -> Minimum Separation). Confirmed +RD/-RD events are drawn on price and on the pane, with rich hover tooltips, alerts and live counters. An optional Micro 5m confirmation validates pivots with closed 5-minute sub-bars for an earlier known-time.
- HOW FAR — Anchored VWAP with sigma bands. Daily/Weekly/Monthly VWAP with +/- standard-deviation bands (default 2.0). Hover any line and a tooltip tells you exactly what you are looking at.
Plus an independent ET (Exhaustion Trajectory) lane that flags when the participation behind a sustained push is fading — a slow "pay attention" flag, deliberately separate from the divergence engine.
Why the combination is the edge
alone is just stretch; stretch plus a fading-pressure print plus a profile shelf underneath is a complete, three-dimensional context. That cross-confirmation is what one-dimensional indicators cannot give you.
Two strategy hints to explore
- Reversion at the band. Try the m15 and m5 timeframe: when price tags the 2.0 standard-deviation VWAP band, watch for a CVD divergence print, targeting a rotation back to VWAP or the session POC. In our observation, divergences that print inside key Volume Profile zones — the POC, the VAH/VAL boundaries, or a prior session's ledge — are considerably more decisive than those appearing in low-volume gaps.
- Continuation at VWAP. Note which side of VWAP price has been accepted on today — where most bars have closed so far. When price stretches away on that side and then returns to VWAP, watch for a reversal print at the line: a CVD divergence back in the accepted direction, or an ET flag against the pullback. The idea is that the accepted side reasserting itself at VWAP is the day's trend defending its average. Treat the print as context for your own timing and exits, not as a mechanical trigger.
Both are research starting points, not trading systems: forward-test them yourself, on your own instruments, spreads and sessions, before risking anything. Past behaviour never guarantees future results.
Don't have time to track your whole watchlist?
Volume Trio Multi is the Pro edition of this indicator. The engine is the same. It alerts you when the stars are aligned for a pair in your watchlist.
If you want to track many pairs at the same time without spending hours watching charts, that is what Multi is built for. The terminal does the watching; you step in only when something actually lines up. And when you do open a chart, more of the profile's history is already drawn for you: where value formed during the session, where it moved, and which levels the market has left unfinished.What it adds first is a watchlist scanner: the same three-layer logic run across the symbols already in your Market Watch, on a timeframe you choose, with an alert for each of the two strategy hints above — the reversion reading, when a divergence lines up with a sigma-band tag or a key profile zone, and the continuation reading, when the day's accepted side of VWAP defends the line with a divergence in its direction. A dashboard shows every symbol's state at a glance, and clicking a row opens that chart.
Beyond the scanner: composite profiles over the last N sessions or a custom date range, developing POC and Value Area traces with VPOC migration, naked POC tracking, and hover tooltips on every line drawn on the chart.
In short: this free version reads one chart. Multi watches your whole list.
For Multi Version: https://www.mql5.com/en/market/product/188176
This free edition stays free and stays complete. It is not a trial, and nothing here is time-limited or reduced in function.
Built honestly
- All readings derive from provider-local volume and OHLC — a pressure proxy, not centralized order flow. Markers are context, never buy/sell signals.
- Fully deterministic on closed bars: reloads and timeframe switches reproduce the identical event history.
- Auto profiles tuned for 5m / 15m / 30m; graceful manual fallbacks everywhere (nothing silently goes dark).
- Diagnostics panel exposes the whole engine: every counter, every rejection gate, the full ET state.
- Three master layer toggles, dark/light auto theme, alert channels (popup / sound / push), English glossary panel.
Quick start
- Drop it on a 5m or 15m chart with defaults (Auto profile does the tuning).
- Hover the blue VWAP line and its dotted bands — the tooltips introduce themselves.
- Turn on the Diagnostics and Glossary panels while you learn the markers, then switch them off.
Trading involves substantial risk; test every idea independently.
Every abbreviation on the chart
Main chart (price window)
| Mark | Meaning | How to read it |
|---|---|---|
| POC (gold bar + label) | Point of Control — the price level with the highest traded activity of that session's profile | The session's strongest "magnet" / acceptance level. Price tends to revisit it. |
| VAH (green label) | Value Area High — upper boundary of the zone holding the configured percent (default 70%) of session activity | Above VAH = price trading at a premium vs. the session's accepted value. |
| VAL (green label) | Value Area Low — lower boundary of the same zone | Below VAL = price trading at a discount vs. accepted value. |
| Profile bars (horizontal green/red) | Per-price-level activity, split into buying vs. selling pressure by the proxy | Long bars = heavy acceptance ("shelves"). Thin gaps = low-volume air pockets price crosses quickly. |
| Shaded band | The Value Area itself | The session's "fair" zone between VAH and VAL. |
| Dotted vertical line | Session boundary (Daily / Weekly / Monthly anchor) | Each profile is built per session. |
| Blue line | Anchored VWAP — volume-weighted average price since the session anchor | The session's volume-fair price. Hover it: a tooltip confirms what it is. |
| Dotted blue lines | VWAP sigma bands — VWAP +/- (multiplier x standard deviation), default 2.0 | Statistical stretch. Hover a band: the tooltip shows the exact multiplier. |
| C +RD / C -RD (green / red) | Confirmed Regular Divergence, bullish (+) or bearish (-), confirmed by Standard chart bars | Price made a lower low while the pressure index made a higher low (+RD), or a higher high with a lower pressure high (-RD). The connecting line joins the two pivot origins. |
| M +RD / M -RD | The same event confirmed by Micro 5m mode | Identical logic; the pivot was validated earlier using a quota of closed 5-minute sub-bars instead of full chart bars. |
| ET+ (cyan) | Exhaustion Trajectory, bullish setup proxy | Price kept pressing lower while downside participation faded sharply in the second half of the measured window. Watched as bullish-reaction context. |
| ET- (orange) | Exhaustion Trajectory, bearish setup proxy | Price kept pressing higher while upside participation faded. Watched as pullback context. |
Every divergence and ET label carries a hover tooltip with the measured span, the price change, the pressure-index change and a plain-language interpretation.
Indicator pane (bottom window)
| Element | Meaning |
|---|---|
| Histogram | Signed volume-pressure proxy: rolling sum (Periodic) or EMA of the per-bar pressure delta. Green above zero = net buying pressure, red below = net selling pressure. Muted hues by design so markers stay readable. |
| Divergence lines + C/M labels | The pane mirror of every confirmed divergence, joining the two pressure pivots. |
| Diagnostics panel (optional, top-right) | Live engine state: timeframe/profile, pressure mode, pivot geometry, confirmation mode, structure guard, continuity epochs, pivot/event counters, rejection counters (E=epoch, S=swing, M=min-separation, Q=micro quota), full ET status, layer toggles. |
| Glossary panel (optional, top-left) | A one-screen reminder of every abbreviation. |
Inputs, group by group
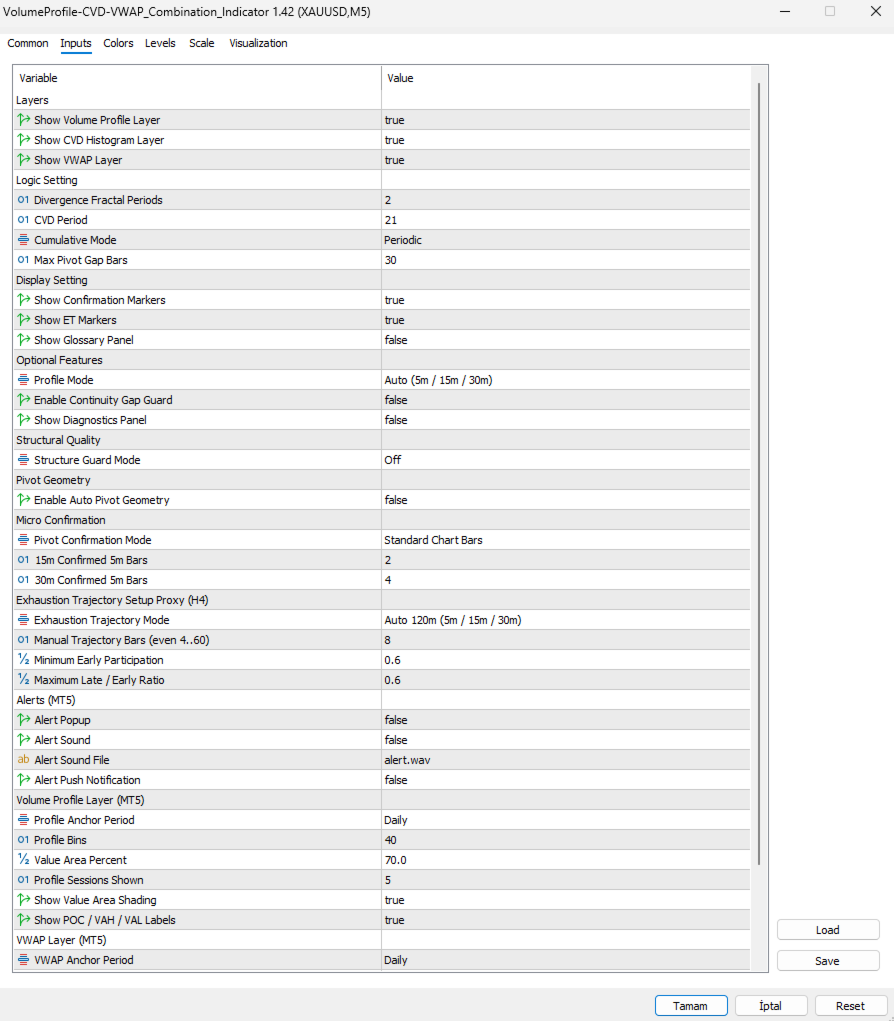
- Show Volume Profile / CVD Histogram / VWAP Layer — master switches. The CVD engine keeps computing even when its plot is hidden, so divergences and alerts stay alive.
- Divergence Fractal Periods (2) — manual pivot width (left/right bars in Standard mode; left width in Micro mode).
- CVD Period (21) — window of the pressure histogram (Periodic sum or EMA).
- Cumulative Mode (Periodic) — Periodic = moving sum of the last P deltas; EMA = exponential average, faster on new bars.
- Max Pivot Gap Bars (30) — exclusive upper bound for the distance between the two divergence pivots.
- Show Confirmation Markers (on) — C/M +/-RD labels only; lines, counters and alerts are unaffected.
- Show ET Markers (on) — ET+/ET- labels only; ET events and alerts continue.
- Show Glossary Panel (off) — the abbreviation cheat-sheet.
- Profile Mode (Auto) — on exact 5m/15m/30m charts, P/Trend/Gap auto-set to 63/150/<90, 21/50/<30, 11/25/<15. Elsewhere the Manual values apply.
- Enable Continuity Gap Guard (off) — rejects pivot pairs separated by a chart-time gap larger than 1.5x the nominal bar; weekend gaps count.
- Show Diagnostics Panel (off) — the live engine table.
- Structure Guard Mode (Off) — optional extra admission rules: Swing Guard (an opposite pivot must sit between the pair), Minimum Separation (gap >= Left + right-footprint + 1), or both.
- Enable Auto Pivot Geometry (off) — on 5m/15m/30m uses L=4/3/2 with R=2 instead of the manual n/n.
- Pivot Confirmation Mode (Standard) — Standard = classic right-side chart bars. Micro 5m = the pivot on the previous closed host bar is validated by a quota of closed 5-minute sub-bars, giving an earlier known-time. Only on exact 15m/30m charts; elsewhere it falls back to Standard.
- 15m / 30m Confirmed 5m Bars (2 / 4) — the closed sub-bar quota. Touching the pivot level exactly is tolerated; a decisive break before the quota completes cancels the candidate.
- Exhaustion Trajectory Mode (Auto 120m) — Auto uses W=24/8/4 bars on 5m/15m/30m; elsewhere the Manual window applies as chart bars.
- Manual Trajectory Bars (8) — even 4..60; the observation window W. The engine needs 4W bars of clean history (3W calibration + W observation).
- Minimum Early Participation (0.60) — required early-half intensity, normalized by the prior 3W mean absolute delta.
- Maximum Late / Early Ratio (0.60) — how much of the early intensity may survive into the late half; lower = stricter fade requirement.
- Popup / Sound / Sound File / Push — delivery channels for divergence and ET alerts. All default off; events fire on the live closed bar only.
- Profile Anchor Period (Daily), Profile Bins (40), Value Area Percent (70), Profile Sessions Shown (5), Show Value Area Shading (on), Show POC / VAH / VAL Labels (on).
- VWAP Anchor Period (Daily), Show VWAP Sigma Bands (on), VWAP Band Multiplier (2.0).
- Color Theme (Auto — follows the chart background), Max Drawn
- Divergences (150 — older drawings are pruned; counters keep the truth).
Practical notes
- Load on m15 or m5 with defaults for the tuned experience (Auto profile). Micro 5m mode requires M5 history; the indicator retries automatically while the terminal downloads it.
- Open the Diagnostics panel whenever something looks quiet — the rejection counters tell you exactly which gate is filtering candidates.
- The engine is fully deterministic on closed bars: scrolling back, reloading or switching timeframes reproduces the identical event history.