Volume Trio

Three institutional lenses. One deterministic engine.

Most tools show you one dimension of the market. This indicator fuses the three that professionals cross-check constantly — and makes them talk to each other on a single chart:

  • WHERE — Session Volume Profile. Per-session horizontal profiles with POC, VAH/VAL and a shaded Value Area, split into buying vs. selling pressure. You see the levels the market has actually accepted — and the thin air pockets it hasn't.
  • WHEN — CVD Pressure Divergence. A signed volume-pressure histogram with a strict, multi-gate Regular divergence engine (Classic -> Continuity -> Swing -> Minimum Separation). Confirmed +RD/-RD events are drawn on price and on the pane, with rich hover tooltips, alerts and live counters. An optional Micro 5m confirmation validates pivots with closed 5-minute sub-bars for an earlier known-time. 
  • HOW FAR — Anchored VWAP with sigma bands. Daily/Weekly/Monthly VWAP with +/- standard-deviation bands (default 2.0). Hover any line and a tooltip tells you exactly what you are looking at.

Plus an independent ET (Exhaustion Trajectory) lane that flags when the participation behind a sustained push is fading — a slow "pay attention" flag, deliberately separate from the divergence engine.


Why the combination is the edge

Each layer filters the noise of the others. A divergence alone is a statistic; a divergence at the POC or a Value Area edge is pressure disagreement meeting a level the market has already proven it defends. A 2-sigma VWAP tag

alone is just stretch; stretch plus a fading-pressure print plus a profile shelf underneath is a complete, three-dimensional context. That cross-confirmation is what one-dimensional indicators cannot give you.


Two strategy hints to explore

  1. Reversion at the band. Try the m15 and m5 timeframe: when price tags the 2.0 standard-deviation VWAP band, watch for a CVD divergence print, targeting a rotation back to VWAP or the session POC. In our observation, divergences that print inside key Volume Profile zones — the POC, the VAH/VAL boundaries, or a prior session's ledge — are considerably more decisive than those appearing in low-volume gaps.
  2. Continuation at VWAP. Note which side of VWAP price has been accepted on today — where most bars have closed so far. When price stretches away on that side and then returns to VWAP, watch for a reversal print at the line: a CVD divergence back in the accepted direction, or an ET flag against the pullback. The idea is that the accepted side reasserting itself at VWAP is the day's trend defending its average. Treat the print as context for your own timing and exits, not as a mechanical trigger.

Both are research starting points, not trading systems: forward-test them yourself, on your own instruments, spreads and sessions, before risking anything. Past behaviour never guarantees future results.

Don't have time to track your whole watchlist?

Volume Trio Multi is the Pro edition of this indicator. The engine is the same. It alerts you when the stars are aligned for a pair in your watchlist.

If you want to track many pairs at the same time without spending hours watching charts, that is what Multi is built for. The terminal does the watching; you step in only when something actually lines up. And when you do open a chart, more of the profile's history is already drawn for you: where value formed during the session, where it moved, and which levels the market has left unfinished.

What it adds first is a watchlist scanner: the same three-layer logic run across the symbols already in your Market Watch, on a timeframe you choose, with an alert for each of the two strategy hints above — the reversion reading, when a divergence lines up with a sigma-band tag or a key profile zone, and the continuation reading, when the day's accepted side of VWAP defends the line with a divergence in its direction. A dashboard shows every symbol's state at a glance, and clicking a row opens that chart.

Beyond the scanner: composite profiles over the last N sessions or a custom date range, developing POC and Value Area traces with VPOC migration, naked POC tracking, and hover tooltips on every line drawn on the chart.

In short: this free version reads one chart. Multi watches your whole list.

For Multi Version: https://www.mql5.com/en/market/product/188176

This free edition stays free and stays complete. It is not a trial, and nothing here is time-limited or reduced in function.


Built honestly

  • All readings derive from provider-local volume and OHLC — a pressure proxy, not centralized order flow. Markers are context, never buy/sell signals.
  • Fully deterministic on closed bars: reloads and timeframe switches reproduce the identical event history.
  • Auto profiles tuned for 5m / 15m / 30m; graceful manual fallbacks everywhere (nothing silently goes dark).
  • Diagnostics panel exposes the whole engine: every counter, every rejection gate, the full ET state.
  • Three master layer toggles, dark/light auto theme, alert channels (popup / sound / push), English glossary panel.


Quick start

  1. Drop it on a 5m or 15m chart with defaults (Auto profile does the tuning).
  2. Hover the blue VWAP line and its dotted bands — the tooltips introduce themselves.
  3. Turn on the Diagnostics and Glossary panels while you learn the markers, then switch them off.
This tool provides analytical context only and makes no profitability claims.

Trading involves substantial risk; test every idea independently.

Every abbreviation on the chart

Main chart (price window)

Mark Meaning How to read it
POC (gold bar + label) Point of Control — the price level with the highest traded activity of that session's profile The session's strongest "magnet" / acceptance level. Price tends to revisit it.
VAH (green label) Value Area High — upper boundary of the zone holding the configured percent (default 70%) of session activity Above VAH = price trading at a premium vs. the session's accepted value.
VAL (green label) Value Area Low — lower boundary of the same zone Below VAL = price trading at a discount vs. accepted value.
Profile bars (horizontal green/red) Per-price-level activity, split into buying vs. selling pressure by the proxy Long bars = heavy acceptance ("shelves"). Thin gaps = low-volume air pockets price crosses quickly.
Shaded band The Value Area itself The session's "fair" zone between VAH and VAL.
Dotted vertical line Session boundary (Daily / Weekly / Monthly anchor) Each profile is built per session.
Blue line Anchored VWAP — volume-weighted average price since the session anchor The session's volume-fair price. Hover it: a tooltip confirms what it is.
Dotted blue lines VWAP sigma bands — VWAP +/- (multiplier x standard deviation), default 2.0 Statistical stretch. Hover a band: the tooltip shows the exact multiplier.
C +RD / C -RD (green / red) Confirmed Regular Divergence, bullish (+) or bearish (-), confirmed by Standard chart bars Price made a lower low while the pressure index made a higher low (+RD), or a higher high with a lower pressure high (-RD). The connecting line joins the two pivot origins.
M +RD / M -RD The same event confirmed by Micro 5m mode Identical logic; the pivot was validated earlier using a quota of closed 5-minute sub-bars instead of full chart bars.
ET+ (cyan) Exhaustion Trajectory, bullish setup proxy Price kept pressing lower while downside participation faded sharply in the second half of the measured window. Watched as bullish-reaction context.
ET- (orange) Exhaustion Trajectory, bearish setup proxy Price kept pressing higher while upside participation faded. Watched as pullback context.

Every divergence and ET label carries a hover tooltip with the measured span, the price change, the pressure-index change and a plain-language interpretation.


Indicator pane (bottom window)

Element Meaning
Histogram Signed volume-pressure proxy: rolling sum (Periodic) or EMA of the per-bar pressure delta. Green above zero = net buying pressure, red below = net selling pressure.
Muted hues by design so markers stay readable.
Divergence lines + C/M labels The pane mirror of every confirmed divergence, joining the two pressure pivots.
Diagnostics panel (optional, top-right) Live engine state: timeframe/profile, pressure mode, pivot geometry, confirmation mode, structure guard, continuity epochs, pivot/event counters, rejection counters
(E=epoch, S=swing, M=min-separation, Q=micro quota), full ET status, layer toggles.
Glossary panel (optional, top-left) A one-screen reminder of every abbreviation.


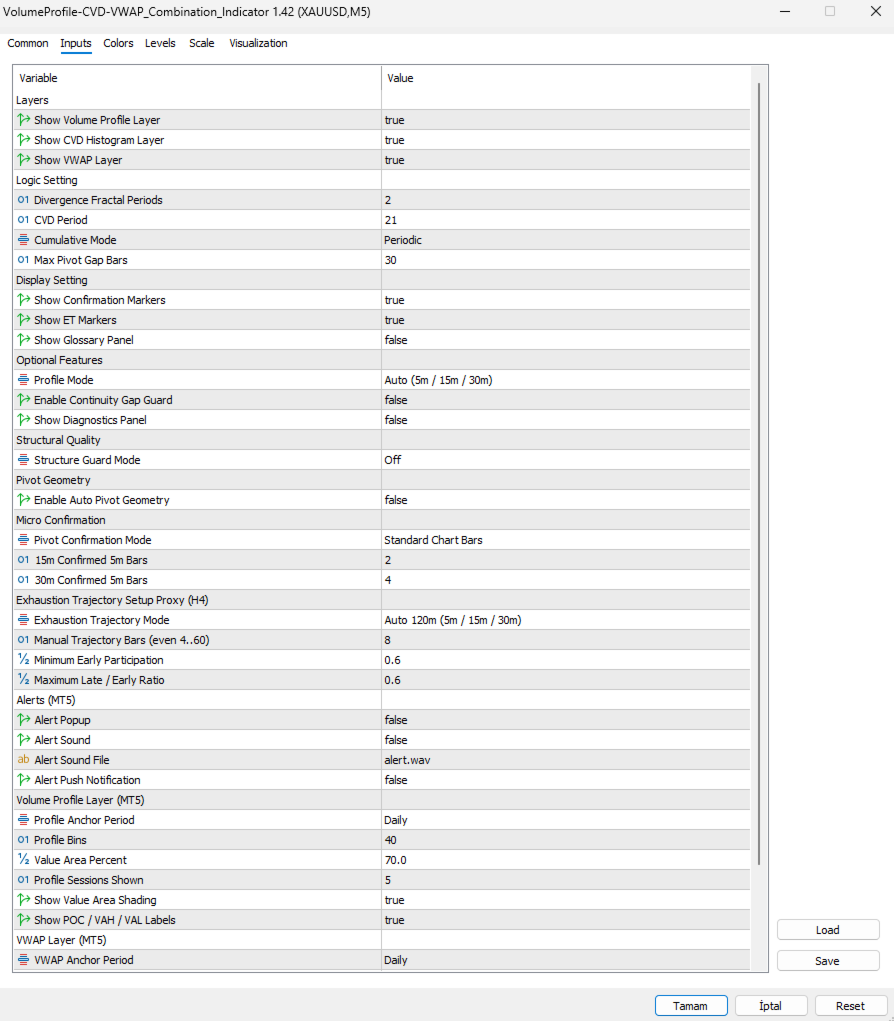
Inputs, group by group

Layers
  • Show Volume Profile / CVD Histogram / VWAP Layer — master switches. The CVD engine keeps computing even when its plot is hidden, so divergences and alerts stay alive.
Logic Setting
  • Divergence Fractal Periods (2) — manual pivot width (left/right bars in Standard mode; left width in Micro mode).
  • CVD Period (21) — window of the pressure histogram (Periodic sum or EMA).
  • Cumulative Mode (Periodic) — Periodic = moving sum of the last P deltas; EMA = exponential average, faster on new bars.
  • Max Pivot Gap Bars (30) — exclusive upper bound for the distance between the two divergence pivots.
Display Setting
  • Show Confirmation Markers (on) — C/M +/-RD labels only; lines, counters and alerts are unaffected.
  • Show ET Markers (on) — ET+/ET- labels only; ET events and alerts continue.
  • Show Glossary Panel (off) — the abbreviation cheat-sheet.
Optional Features
  • Profile Mode (Auto) — on exact 5m/15m/30m charts, P/Trend/Gap auto-set to 63/150/<90, 21/50/<30, 11/25/<15. Elsewhere the Manual values apply.
  • Enable Continuity Gap Guard (off) — rejects pivot pairs separated by a chart-time gap larger than 1.5x the nominal bar; weekend gaps count.
  • Show Diagnostics Panel (off) — the live engine table.
Structural Quality
  • Structure Guard Mode (Off) — optional extra admission rules: Swing Guard (an opposite pivot must sit between the pair), Minimum Separation (gap >= Left + right-footprint + 1), or both.
Pivot Geometry
  • Enable Auto Pivot Geometry (off) — on 5m/15m/30m uses L=4/3/2 with R=2 instead of the manual n/n.
Micro Confirmation
  • Pivot Confirmation Mode (Standard) — Standard = classic right-side chart bars. Micro 5m = the pivot on the previous closed host bar is validated by a quota of closed 5-minute sub-bars, giving an earlier known-time. Only on exact 15m/30m charts; elsewhere it falls back to Standard.
  • 15m / 30m Confirmed 5m Bars (2 / 4) — the closed sub-bar quota. Touching the pivot level exactly is tolerated; a decisive break before the quota completes cancels the candidate.
Exhaustion Trajectory Setup Proxy (H4)
  • Exhaustion Trajectory Mode (Auto 120m) — Auto uses W=24/8/4 bars on 5m/15m/30m; elsewhere the Manual window applies as chart bars.
  • Manual Trajectory Bars (8) — even 4..60; the observation window W. The engine needs 4W bars of clean history (3W calibration + W observation).
  • Minimum Early Participation (0.60) — required early-half intensity, normalized by the prior 3W mean absolute delta.
  • Maximum Late / Early Ratio (0.60) — how much of the early intensity may survive into the late half; lower = stricter fade requirement.
Alerts (MT5)
  • Popup / Sound / Sound File / Push — delivery channels for divergence and ET alerts. All default off; events fire on the live closed bar only.
Volume Profile Layer
  • Profile Anchor Period (Daily), Profile Bins (40), Value Area Percent (70), Profile Sessions Shown (5), Show Value Area Shading (on), Show POC / VAH / VAL Labels (on).
VWAP Layer
  • VWAP Anchor Period (Daily), Show VWAP Sigma Bands (on), VWAP Band Multiplier (2.0).
Appearance
  • Color Theme (Auto — follows the chart background), Max Drawn
  • Divergences (150 — older drawings are pruned; counters keep the truth).


Practical notes

  • Load on m15 or m5 with defaults for the tuned experience (Auto profile). Micro 5m mode requires M5 history; the indicator retries automatically while the terminal downloads it.
  • Open the Diagnostics panel whenever something looks quiet — the rejection counters tell you exactly which gate is filtering candidates.
  • The engine is fully deterministic on closed bars: scrolling back, reloading or switching timeframes reproduces the identical event history.

Produits recommandés
Value Chart Candlesticks
Flavio Javier Jarabeck
4.57 (14)
The idea of a Value Chart indicator was presented in the very good book I read back in 2020 , " Dynamic Trading Indicators: Winning with Value Charts and Price Action Profile ", from the authors Mark Helweg and David Stendahl. The idea is simple and the result is pure genius: Present candlestick Price analysis in a detrended way! HOW TO READ THIS INDICATOR Look for Overbought and Oversold levels. Of course, you will need to test the settings a lot to find the "correct" one for your approach. It
FREE
Daily High Low Danilo Monteiro
Danilo Hudson Couto Monteiro
4 (2)
# Indicador Daily High - Danilo Monteiro - MT5 ## Descrição O Daily High/Low Labels é um indicador personalizado para MetaTrader 5 que exibe automaticamente as máximas e mínimas diárias no gráfico, facilitando a identificação rápida dos níveis importantes de preço. O indicador marca os preços com etiquetas e linhas horizontais, permitindo uma visualização clara dos níveis críticos do dia atual e anterior. ## Principais Características ### 1. Marcação Automática - Exibe automaticamente as máxi
FREE
LT Donchian Channel
Thiago Duarte
4.86 (7)
Donchian Channel is an indicator created by Richard Donchian. It is formed by taking the highest high and the lowest low of the last specified period in candles. The area between high and low is the channel for the chosen period. Its configuration is simple. It is possible to have the average between the upper and lower lines, plus you have alerts when price hits one side. If you have any questions or find any bugs, please contact me. Enjoy!
FREE
Institutional Tick Engine Lite: Outil de Vélocité des Ticks et de Renversement Institutional Tick Engine Lite est un indicateur technique conçu pour analyser la vélocité du marché et la logique de microstructure à l'aide de données tick brutes. Il fournit des métriques en temps réel pour le scalping et le day trading. Fonctionnalités Incluses Moniteur de Vélocité: Histogramme en temps réel affichant les "Ticks Par Seconde" (TPS). Signaux de Renversement (Lite): Identifie les points de retourneme
FREE
Indicador Regressão Linear – Par de Ativos - INTRADAY Indicador é um oscilador que faz o plot do Resíduo resultado da regressão linear entre os dois ativos inseridos como input do indicador, representado pela fórmula: Y = aX + b + R Onde Y é o valor do ativo dependente, X é o valor do ativo independente, a é a inclinação da reta entre os dois ativos, b é a intersecção da reta e R é o resíduo. O resíduo representa a quantidade da variabilidade que Y que o modelo ajustado não consegue explicar. E
FREE
MIDAS Super VWAP
Flavio Javier Jarabeck
4.27 (11)
Imagine VWAP, MVWAP and MIDAS in one place... Well, you found it! Now you can track the movement of Big Players in various ways, as they in general pursue the benchmarks related to this measuring, gauging if they had good execution or poor execution on their orders. Traders and analysts use the VWAP to eliminate the noise that occurs throughout the day, so they can measure what prices buyers and sellers are really trading. VWAP gives traders insight into how a stock trades for that day and deter
FREE
Follow The Line MT5
Oliver Gideon Amofa Appiah
4.6 (35)
This indicator obeys the popular maxim that: "THE TREND IS YOUR FRIEND" It paints a GREEN line for BUY and also paints a RED line for SELL. (you can change the colors). It gives alarms and alerts of all kinds. IT DOES NOT REPAINT and can be used for all currency pairs and timeframes. Yes, as easy and simple as that. Even a newbie can use it to make great and reliable trades. NB: For best results, get my other premium indicators for more powerful and reliable signals. Get them here: https://www.m
FREE
Heiken Ashi Smoothwave
Alexandre Vincent Traber
Aperçu Heiken Ashi Smoothwave transforme votre graphique en bougies Heiken Ashi lissées directement dans la fenêtre principale du graphique, remplaçant les bougies standard pour une vue de tendance plus claire. Pas de fenêtre séparée, pas d'encombrement. Fonctionnement Calcule les valeurs OHLC Heiken Ashi à partir des données de prix réelles sur chaque bougie. Trace des bougies Heiken Ashi colorées directement sur le graphique principal. Masque automatiquement les bougies natives du graphique,
FREE
Girassol Sunflower MT5 Indicator
Saullo De Oliveira Pacheco
3.86 (7)
This is the famous Sunflower indicator for Metatrader5. This indicator marks possible tops and bottoms on price charts. The indicator identifies tops and bottoms in the asset's price history, keep in mind that the current sunflower of the last candle repaints, as it is not possible to identify a top until the market reverses and it is also not possible to identify a bottom without the market stop falling and start rising. If you are looking for a professional programmer for Metatrader5, please
FREE
VWAP and MVWAP
Flavio Javier Jarabeck
4 (9)
Volume Weighted Average Price (VWAP) is a trading benchmark commonly used by Big Players that gives the average price a Symbol has traded throughout the day. It is based on both Volume and price. Additionally we put in this indicator the MVWAP (Moving Volume Weighted Average Price). For those who do not know the usage and the importance od this indicator I recommend a great article about this subject at Investopedia ( https://www.investopedia.com/articles/trading/11/trading-with-vwap-mvwap.asp )
FREE
Stackable VWAP
Flavio Javier Jarabeck
3.5 (4)
Volume Weighted Average Price (VWAP) is a trading benchmark commonly used by Big Players that gives the average price a Symbol has traded throughout the day. It is based on both Volume and price. Additionally we put in this indicator the MVWAP (Moving Volume Weighted Average Price). For those who do not know the usage and the importance od this indicator I recommend a great article about this subject at Investopedia ( https://www.investopedia.com/articles/trading/11/trading-with-vwap-mvwap.asp
FREE
Donchian Breakout And Rsi
Mattia Impicciatore
4.5 (2)
Description générale Cet indicateur est une version améliorée du Canal Donchian classique, enrichie de fonctionnalités pratiques pour le trading réel. En plus des trois lignes standard (supérieure, inférieure et ligne médiane), le système détecte les cassures et les affiche visuellement avec des flèches sur le graphique, en montrant uniquement la ligne opposée à la direction actuelle de la tendance pour une lecture plus claire. L’indicateur comprend : Signaux visuels : flèches colorées lors des
FREE
Phoenix Delta Volume
Nigel Nii Darku Narnor Darko
5 (1)
This is the Phoenix Institutional SMC Dashboard (Emerald-Teal Edition). It is engineered to provide retail traders with the same "Volume-at-Price" clarity used by institutional desks. Below is a full breakdown of the benefits, the high-confluence logic for entries, and how to manage your trades using the current visual engine. Strategic Benefits to the User Sentiment over Price: Most indicators only look at where the price is. This dashboard tells you how much effort (Volume Delta) was required
FREE
Support and Ressistance
Raphael Lorenz Baumgartner
Last Day Support & Resistance Platform: MetaTrader 5 Type: Custom Indicator Display: Chart Window (Overlay) Functions: Calculates Support and Resistance zones based on high/low patterns of the previous day. Uses a sliding sampling window ( SampleWindowSize ) to detect recent price ranges. Detects potential support if current price range is significantly below previous highs. Detects potential resistance if price range is significantly above previous lows. Updates four output buffers: LDResistanc
FREE
Waves Sizer
Flavio Javier Jarabeck
3.86 (7)
Wyckoff fans, enjoy! Ideally to be used with the Weis Waves indicator, but it can be easily used alone, the Waves Sizer puts the range (in resulting Price movement) done by the Price on its market swings. You can control how accurate or loose will be the swings. This tool is very helpful for visually know how much the Price has traveled in your Timeframe. This way you can confront this level of effort with the resulting Volume, etc... Weis Waves indicator: https://www.mql5.com/en/market/produc
FREE
Super Trend eu
Emin Ulucanli
4.83 (6)
SUPERTREND ; C'est un indicateur de suivi de tendance basé sur l'ATR SuperTrend créé par Olivier Seban. Il peut être utilisé pour détecter les changements de direction de la tendance et localiser les arrêts. Lorsque le prix tombe en dessous de la courbe indicatrice, il devient rouge et indique une tendance à la baisse. À l'inverse, lorsque le prix se déplace au-dessus de la courbe, l'indicateur passe au vert, indiquant une tendance haussière. Comme d'autres indicateurs, il fonctionne bien sur Su
FREE
Dual RSI
Paul Conrad Carlson
3.5 (2)
Indicator alerts for Dual Relative strength index rsi. Large rsi preset at 14 is below 30 small rsi preset at 4 is below 10 for buy bullish signals . Large rsi preset are 14 is above 70 small rsi preset at 4 is above 90 for sell bearish signals . Includes mobile and terminal alerts. draws lines when alerts. This indicator can help identify extremes and then the tops or bottoms of those extremes .
FREE
RaysFX Pattern Detector è uno strumento di analisi tecnica all'avanguardia progettato per i trader che basano le loro decisioni sull'azione dei prezzi (Price Action). Questo indicatore scannerizza automaticamente il grafico in tempo reale per identificare e segnalare i pattern candlestick più affidabili e noti, eliminando il lavoro manuale e aiutandoti a non perdere mai un'opportunità di trading. Che tu sia un trader discrezionale, un principiante che sta imparando a riconoscere le candele, o un
FREE
VWAP Indicator
LUC JACOBUS A VERHEECKE
4.11 (27)
Volume Weighted Average Price (VWAP) The volume weighted average price (VWAP) is a  trading   benchmark  used by traders that gives the average price a security has traded at throughout the day, based on both volume and price. It is important because it provides traders with insight into both the trend and value of a security. This indicator VWAP V2 is free and is the manual version of the extended Easy VWAP indicator (30 Euro), where the date and time properties are automatically entered. With
FREE
Renko subwindow
Alexandre Vincent Traber
Overview Renko SubWindow affiche un graphique Renko en bougies colorées dans une fenêtre d'indicateur séparée, sans affecter le graphique principal. La taille de brique peut être fixe en points ou calculée dynamiquement via l'ATR pour des briques adaptatives basées sur la volatilité. How it works Reconstruit les briques Renko à partir des prix de clôture du symbole/timeframe actuel. Une nouvelle brique se forme dès que le prix dépasse la taille définie depuis la clôture de la brique précédente.
FREE
Premium trend entry pro TZ Trade Logics, presents you,  the enhance version of Premium trend entry  This release, bring you much more relaxed trading state with advanced features for trend filtering and premium signal entry timings. For us, is not the creating of the product which matters! but continued maintenance and education to users. through our dedicated means of reaching to us, you will enjoy close guide on how to use the product and other relevant training related to trading.  This tradi
FREE
PROMETHEUS TECHNICAN VERSION Free | By THE SONS A gift from The Sons — no strings, no trial, no expiry. Every trader deserves access to professional-grade market intelligence. That belief is why Prometheus Technical Version exists, and why it costs nothing. Consider it our handshake to the trading community. What You're Getting This is not a simplified tool dressed up as a gift. Prometheus Technican Version is a fully built, institutional-quality technical analysis indicator running a dual-model
FREE
Basic Vwap
james mugendi
4 (1)
Simple Vwap with the daily, weekly and monthly VWAP is the abbreviation for   volume-weighted average price , which is a technical analysis tool that shows the ratio of an asset's price to its total trade volume. It provides traders and investors with a measure of the average price at which a stock is traded over a given period of time. How it's used Identify entry and exit points:   Traders can use VWAP to determine when to buy or sell an asset.   Understand price trends :  Traders can use V
FREE
DS RVOL: The Relative Volume Indicator for MT5 RVOL is a straightforward Relative Volume (RVOL) indicator for MetaTrader 5. It shows you how current volume compares to a historical average, providing a quick way to gauge the strength of a price move. How it Works Relative Volume is a simple ratio: R V O L = C u rre n t V o l u m e ​/ A v er a g e H i s t or i c a l V o l u m e RVOL > 1.0 : Volume is higher than usual. This suggests there's strong interest and potential for a sustained move. RVOL
FREE
Wave Box Market Frenquency
Jean Jacques Huve Ribeiro
4.75 (4)
Totally linked to the result of a movement and the duration he had. Its height records how many ticks the asset walked during a given movement, its width shows us the duration that movement had. Its configuration must be in line with the Weis Wave Indicator configuration to observe the movement force and can indicate a possible accumulation or distribution of the movement;
FREE
Weis Wave Scouter Basic
Jean Carlos Martins Roso
5 (1)
Le Weis Wave Scouter Basic est la version essentielle de notre célèbre indicateur pour MetaTrader 5, conçu pour les traders souhaitant explorer les concepts de la méthode Wyckoff et de l'analyse VSA (Volume Spread Analysis) de manière accessible et efficace. Basé sur la lecture des vagues de volume, cet indicateur simplifié permet d'identifier clairement les mouvements du marché, en se concentrant sur les principes d'effort vs résultat et d'offre et demande, tels qu'enseignés par Richard Wyckof
FREE
VWAP + Volume Profile Combined Indicator FREE Launch Offer OVERVIEW Professional combination of VWAP (Volume Weighted Average Price)  and Volume Profile in a single MT5 indicator. This powerful tool  combines two of the most respected institutional trading tools  into one seamless display. KEY FEATURES 1. VWAP with 6 calculation modes 2. Volume Profile with Value Area analysis 3. Point of Control identification 4. Standard deviation bands 5. Dynamic color changing 6. Separate buy/sell vol
FREE
Swiss VWAPsimple
Terence Gronowski
4.8 (5)
Swiss VWAPsimple Motivation Did not find free VWAP that works, the one that I found craseh. So I created a VWAP which calculates values only for the actual day. So computer resouces are not over stressed. What is VWAP, how is it used?  VWAP stands for Volume Weighed Average Price, it calculates the running sum of tick volume and the runnung sum of price times tickvolume. The division of these sums result in a weighed price (Sum P*V/Sum V). The calculation starts normally at midnight. The values
FREE
VolumeBasedColorsBars
Henrique Magalhaes Lopes
VolumeBasedColorsBars — Free Powerful Volume Analysis for All Traders Unlock the hidden story behind every price bar! VolumeBasedColorsBars is a professional-grade, 100% FREE indicator that colorizes your chart candles based on real, adaptive volume analysis. Instantly spot surges in market activity, identify exhaustion, and catch the moves that matter. This indicator gives you:    • Dynamic color-coded bars for instant volume context    • Adaptive thresholds based on historical, session-awar
FREE
Tabajara V5
Flavio Javier Jarabeck
4.84 (37)
Metatrader 5 version of the famous Andre Machado's Tabajara indicator. If you don't know Andre Machado's Technical Analysis work you don't need this indicator... For those who need it and for those several friend traders who asked this porting from other platforms, here it is... FEATURES 8-period Moving Average 20-period Moving Average 50-period Moving Average 200-period Moving Average Colored candles according to the inflexion of the 20-period MA SETTINGS You can change the Period of all MA's
FREE
Les acheteurs de ce produit ont également acheté
Ce produit a été mis à jour pour le marché 2026 et optimisé pour les dernières versions de MT5. AVIS DE MISE À JOUR DU PRIX : Smart Trend Trading System est actuellement disponible à $99 . Le prix passera à $199 après les 30 prochains achats . OFFRE SPÉCIALE : Après avoir acheté Smart Trend Trading System, envoyez-moi un message privé pour recevoir Smart Universal EA GRATUITEMENT et transformer vos signaux Smart Trend en trades automatisés. Smart Trend Trading System est un système de trading c
Trend Sniper X
Sarvarbek Abduvoxobov
4.88 (32)
Trend Sniper X est un indicateur de suivi de tendance multi-unités de temps pour MetaTrader 5 qui aide les traders à identifier la direction de la tendance et les points d'inversion potentiels avec clarté et précision. pour MT4: https://www.mql5.com/en/market/product/193245 Informations sur le prix : Le prix actuel est un prix promotionnel et est susceptible de changer lors des prochaines mises à jour et nouvelles fonctionnalités. Offre bonus : Pour obtenir GRATUITEMENT l'Auto-Trade Assistant E
Commençons par être honnêtes. Aucun indicateur ne vous rendra rentable à lui seul. Si quelqu’un vous dit le contraire, il vous vend un rêve. Tout indicateur qui affiche des flèches parfaites d’achat/vente peut être rendu impeccable — il suffit de zoomer sur la bonne partie de l’historique et de capturer uniquement les trades gagnants. Nous ne faisons pas cela.  SMC Intraday Formula est un outil. Il lit la structure du marché pour vous, identifie les zones de prix à la probabilité la plus élevée
Neuro Poseidon MT5
Daria Rezueva
4.79 (53)
Neuro Poseidon is a new indicator by Daria Rezueva. It combines precise trading signals with adaptive TP/SL levels - creating best possible trades as a result! Message me and get  Neuro Poseidon Assistant  as a gift to automize your trading process! What makes it stand out? 1. Proven profitability on all assets and timeframes 2. Only confirmed BUY and SELL signals present on the chart 3. Adaptive TP & SL levels generated by the software for each trade 4. Easy to understand - suitable for al
Welcome to ENTRY IN THE ZONE AND SMC MULTI TIMEFRAME Entry In The Zone and SMC Multi Timeframe is a real-time market analysis tool based on Smart Money Concepts (SMC), designed to analyze market structure, price direction, and key trading zones. It supports both Single-Timeframe Analysis and Multi-Timeframe Analysis, providing a clearer view of the overall market structure across multiple timeframes, with real-time BUY / SELL signals that do not repaint. It is designed to help filter trading opp
Zoryk Gold
Reda El Koutbane
5 (7)
ZORYK — Système avancé de signaux XAUUSD pour MetaTrader 5 Vous connaissez certainement cette sensation. Vous passez du temps à analyser l’or. Vous attendez le bon point d’entrée. Vous ouvrez enfin la position, puis le prix commence immédiatement à évoluer contre vous. Vous fermez trop tôt, déplacez le Stop Loss ou hésitez pendant quelques secondes. Ensuite, le marché atteint exactement l’objectif que vous aviez initialement prévu, mais sans vous dans la position. Le problème n’était pas toujour
SuperScalp Pro
Van Minh Nguyen
4.63 (32)
SuperScalp Pro - Professional Multi-Layer Confluence Scalping System SuperScalp Pro est un indicateur avancé de scalping qui améliore le Supertrend classique grâce à plusieurs filtres intelligents de confirmation. Il aide à identifier des opportunités de Buy/Sell présentant une probabilité plus élevée, tout en réduisant considérablement les faux signaux. Des flèches Buy et Sell claires apparaissent directement sur le graphique, tandis que les niveaux de Stop Loss et Take Profit basés sur l’ATR s
UNIX Scalper — Gold Scalping Indicator for MetaTrader 5 UNIX Scalper is a focused Gold scalping indicator designed primarily for XAUUSD on M1, M2, M3, M5, M10 and M15. It gives the trader a clear BUY, SELL or WAIT decision together with the complete trade plan: Entry, Stop Loss, TP1 and TP2 . The concept is simple: wait for the signal, follow the levels, move the Stop Loss to Break Even after TP1, and trade with discipline. Learn UNIX Scalper Everything you need to learn and use the product is
GoldenX Entry MT5
Kareem Abbas
5 (16)
GoldenX Entry est un indicateur MT5 doté d’un algorithme adaptatif Smart Entry Trend, d’un système de scoring des signaux, d’un détecteur de régime de marché et d’un filtre de volatilité. Chaque signal inclut un niveau d’entrée calculé, trois niveaux de Take-Profit (TP1, TP2, TP3) ainsi qu’un niveau de Stop-Loss. Il est construit sur plusieurs couches analytiques conçues pour s’adapter à différentes conditions de marché, combinant un système analytique multicouche avec un optimiseur intégré et u
Reversion King Indicator
Eugen-alexandru Zibileanu
5 (7)
Un nouveau Roi en ville - Indicateur + Gestion des ordres (TP1 + TP2 + TP3) + Envoi optionnel de signaux Telegram INCLUS (GRATUIT) (SYSTÈME COMPLET DE TRADING et DE SIGNAUX) Notre meilleur EA pour l’Or : Gold Slayer Cet indicateur inclut une stratégie avancée, un système de trading avec gestion des ordres personnalisable ainsi qu’un système de retour à la moyenne combinant des extensions d’enveloppes, soutenu par plusieurs filtres intelligents de confirmation comme le RSI afin de détecter des en
Gann Made Easy   est un système de trading Forex professionnel et facile à utiliser qui est basé sur les meilleurs principes de trading en utilisant la théorie de mr. WD Gann. L'indicateur fournit des signaux d'ACHAT et de VENTE précis, y compris les niveaux Stop Loss et Take Profit. Vous pouvez échanger même en déplacement en utilisant les notifications PUSH. VEUILLEZ ME CONTACTER APRÈS L'ACHAT POUR RECEVOIR GRATUITEMENT DES INSTRUCTIONS DE TRADING ET D'EXCELLENTS INDICATEURS SUPPLÉMENTAIRES! V
M1 Sniper MT5
Oleg Rodin
5 (7)
M1 SNIPER   est un système d'indicateurs de trading facile à utiliser. Il s'agit d'un indicateur à flèche conçu pour l'unité de temps M1. Cet indicateur peut être utilisé seul pour le scalping sur l'unité de temps M1 ou intégré à votre système de trading existant. Bien que conçu spécifiquement pour le trading sur l'unité de temps M1, ce système peut également être utilisé avec d'autres unités de temps. Initialement, j'avais conçu cette méthode pour le trading du XAUUSD et du BTCUSD. Cependant, j
L'indicateur UZFX {SSS} Scalping Smart Signals v5.0 MT5 est un indicateur de trading haute performance sans « repaint », conçu pour les scalpers, les day traders et les swing traders qui recherchent des signaux précis et en temps réel sur des marchés très volatils. Développé par (UZFX-LABS), cet indicateur combine l'analyse de l'action des cours, la confirmation des tendances et un filtrage intelligent pour générer des signaux d'achat et de vente à forte probabilité, des signaux d'alerte et des
Gold Entry Sniper
Tahir Mehmood
5 (19)
Gold Entry Sniper – Tableau de Bord ATR Multi-Unités de Temps pour Scalping et Swing Trading sur l'Or Gold Entry Sniper est un indicateur avancé pour MetaTrader 5 qui fournit des signaux d'achat/vente précis sur XAUUSD et autres actifs, basé sur la logique de Trailing Stop ATR et l' analyse multi-unités de temps . Caractéristiques et Avantages Clés Analyse Multi-Unités de Temps – Affiche les tendances en M1, M5, M15 sur un seul tableau. Trailing Stop Basé sur l'ATR – Ajuste automatiquement selon
La légende est de retour : Entry Points Pro 10. La relance de l'indicateur légendaire qui s'est maintenu 3 ans dans le Top-3 du MQL5 Market. Des centaines d'avis enthousiastes (589 sur les deux versions), des milliers de traders l'utilisent chaque jour, 31 000+ téléchargements de la démo   MT4+MT5 . J'ai lu chacun de vos avis publiés en cinq ans — et au lieu de promettre, j'ai intégré les réponses directement dans la version 10. Par un auteur présent sur les marchés depuis 1999, qui tient à l'ho
Currency Strength Wizard   est un indicateur très puissant qui vous offre une solution tout-en-un pour un trading réussi. L'indicateur calcule la puissance de telle ou telle paire de devises en utilisant les données de toutes les devises sur plusieurs périodes. Ces données sont représentées sous la forme d'un indice de devise facile à utiliser et de lignes électriques de devise que vous pouvez utiliser pour voir la puissance de telle ou telle devise. Tout ce dont vous avez besoin est d'attacher
Atomic Analyst MT5
Issam Kassas
4.45 (55)
Ce produit a été mis à jour pour le marché 2026 et optimisé pour les dernières versions de MT5. AVIS DE MISE À JOUR DU PRIX : Atomic Analyst est actuellement disponible à $99 . Le prix passera à $199 après les 30 prochains achats . OFFRE SPÉCIALE : Après avoir acheté Atomic Analyst, envoyez-moi un message privé pour recevoir Smart Universal EA GRATUITEMENT et transformer vos signaux Atomic Analyst en trades automatisés. Atomic Analyst est un indicateur de trading Price Action sans repaint, san
ATSTRONG PRO: Indicateur de Structure de Marché & Cassure Moteur de Détection de Cassures | 5 Cibles TP Dynamiques | Tableau de Bord en Direct | Sans Repainting Prix de Lancement Prix Actuel: 59 $ — Le prix augmente de 10 $ après chaque 10 ventes. ATSTRONG PRO est un indicateur avancé de cassure (breakout) et de structure de marché institutionnelle conçu pour MetaTrader 5. Il détecte les pivots de swing à haute probabilité, identifie les zones d'accumulation groupées de support et de résistan
Ce produit a été mis à jour pour le marché 2026 et optimisé pour les dernières versions de MT5. AVIS DE MISE À JOUR DU PRIX : Smart Price Action Concepts est actuellement disponible à $200 . Le prix passera à $299 après les 30 prochains achats . OFFRE SPÉCIALE : Après l’achat, envoyez-moi un message privé pour recevoir un bonus gratuit + un cadeau . Tout d’abord, il est important de souligner que cet outil de trading est un indicateur sans repaint, sans redrawing et sans retard, ce qui le rend
Axiom Matrix
Issam Kassas
5 (6)
[User Manual]   ,   [Online Course]   ,   [PDF]  And [DEMO] Axiom Matrix est un scanner de marché professionnel multi-symboles et multi-timeframes, ainsi qu’un tableau de bord de décision pour MetaTrader 5. Il scanne votre Market Watch, analyse plusieurs timeframes, lit plusieurs moteurs de confirmation, compare les opportunités les plus fortes et vous montre la meilleure condition BUY, SELL, WAIT ou bloquée dans un seul tableau de bord matriciel propre. J’ai créé Axiom Matrix parce que je voula
Gem SIGNAL
Shengzu Zhong
5 (1)
GEM Signal Pro GEM Signal Pro est un indicateur de suivi de tendance pour MetaTrader 5, conçu pour les traders qui souhaitent des signaux plus clairs, des configurations de trade plus structurées et une gestion du risque plus pratique directement sur le graphique. Au lieu d’afficher simplement une flèche, GEM Signal Pro aide à présenter l’idée complète du trade de manière plus claire et plus lisible. Lorsque les conditions sont confirmées, l’indicateur peut afficher le prix d’entrée, le stop los
FiboSniper Pro
Van Minh Nguyen
5 (2)
FiboSniper Pro – Multi-Filter Fibonacci System with Auto SL/TP and Control Panel FiboSniper Pro est un indicateur technique qui combine des Fibonacci Envelopes dynamiques avec plusieurs filtres de confirmation afin de générer des signaux Buy et Sell sélectionnés. Les niveaux de Fibonacci sont calculés à partir de Moving Average et ATR, puis filtrés par ADX, EMA, RSI, ATR, Volume, Time et la structure des bougies. L’indicateur affiche directement sur le graphique les niveaux automatiques de Stop
Divergence Bomber
Ihor Otkydach
4.89 (94)
Chaque acheteur de cet indicateur reçoit également gratuitement : L’outil exclusif « Bomber Utility », qui accompagne automatiquement chaque opération de trading, fixe les niveaux de Stop Loss et de Take Profit, et clôture les positions selon les règles de la stratégie Des fichiers de configuration (set files) pour adapter l’indicateur à différents actifs Des set files pour configurer le Bomber Utility selon différents modes : « Risque Minimum », « Risque Équilibré » et « Stratégie d’Attente »
Accès officiel à l'écosystème BlueDigitsFx Recevez les mises à jour d'infrastructure, les ressources de flux de travail, les sorties de produits et l'accès à l'écosystème via l'écosystème officiel BlueDigitsFx. Écosystème Telegram Site web BlueDigitsFx Precision Order Flow MT5 — Suite complète d'analyse du flux d'ordres pour MetaTrader 5 Framework professionnel de structure de marché basé sur les sessions, combinant les Zones de Valeur, le Point of Control, le contexte d'enchères et un support
SR Liquidity   est un indicateur de trading conçu pour révéler les zones cachées où se concentre la liquidité du marché et où le prix réagit avec le plus d'intensité. Ces zones de liquidité spécifiques agissent comme de puissants niveaux de support et de résistance, vous offrant une cartographie claire des points où le marché est le plus susceptible de se retourner. Plutôt que de tracer des lignes de support et de résistance classiques, l'indicateur SR Liquidity analyse le comportement réel des
Crystal Quantum Pro
Muhammad Jawad Shabir
5 (3)
CRYSTAL QUANTUM PRO Institutional Signal & Trade Intelligence for MetaTrader 5 Final Price: 199 USD ----> Price goes up 10 USD after every 10 sales. Limited launch slots available, act fast. Most indicators give you an arrow and leave you alone. A naked arrow is a gamble. Winning consistently requires CONFLUENCE , a clear STOP and TARGET , and honest PROOF that the system works. Crystal Quantum Pro delivers all three in one clean, no-repaint package. Crystal Quantum Pro is a complete decision sy
Scalper Vault   est un système de scalpage professionnel qui vous fournit tout ce dont vous avez besoin pour un scalpage réussi. Cet indicateur est un système de trading complet qui peut être utilisé par les traders de forex et d'options binaires. Le délai recommandé est M5. Le système vous fournit des signaux fléchés précis dans le sens de la tendance. Il vous fournit également des signaux supérieurs et inférieurs et des niveaux de marché Gann. Les indicateurs fournissent tous les types d'alert
Power Candles MT5
Daniel Stein
4.73 (11)
Power Candles V3 - Indicateur de force à optimisation automatique Power Candles V3 transforme la force des devises et des instruments en un plan de trading exploitable sur chaque graphique auquel il est associé. Au lieu de se contenter de colorer les bougies, il effectue une optimisation automatique en temps réel en arrière-plan et vous fournit les meilleurs niveaux de Stop Loss, Take Profit et seuils de signal pour le symbole que vous avez sous les yeux. Un simple clic suffit pour l'adopter en
CRT Candle Range Theory HTF MT5.   Ultimate CRT Indicator: Advanced ICT Concepts and Malaysian SnR Trading System Master the Market Maker's Footprints with the Most Advanced Candle Range Theory Indicator Unlock the true power of  Smart Money Concepts (SMC)  and trade precisely like the institutions with the  Ultimate CRT Indicator . Built exclusively for serious traders, this indicator automates the highly effective  Candle Range Theory (CRT) , a core pillar of  ICT Concepts (Inner Circle Trader
FX Trend MT5 NG
Daniel Stein
5 (6)
FX Trend NG : La Nouvelle Génération d’Intelligence de Tendance Multi-Marchés Vue d’ensemble FX Trend NG est un outil professionnel d’analyse de tendance multi-timeframe et de surveillance des marchés. Il vous permet de comprendre la structure complète du marché en quelques secondes. Au lieu de naviguer entre de nombreux graphiques, vous identifiez immédiatement quels instruments sont en tendance, où le momentum s’affaiblit et où plusieurs unités de temps sont alignées. Offre de Lancement – Ob
Plus de l'auteur
Read-only analytics for accounts running several EAs. Groups your closed trades by magic number and measures how much of their combined risk actually cancels out. Free measurement edition. The monitoring and alerting edition is Portfolio Command Desk:  https://www.mql5.com/en/market/product/188884 The problem You run five Expert Advisors. Each backtest looked fine on its own. But the account does not trade five systems, it trades one portfolio, and no report in MetaTrader tells you how those sys
FREE
Hard limits for prop firm and challenge accounts Prop firm rules are not suggestions. Breach the daily loss limit by one dollar and the account is gone, whatever the equity curve looked like an hour earlier. The problem is that the rule lives on the firm's server while your positions live in your terminal, and nothing in MetaTrader 5 connects the two. Prop Firm Circuit Breaker sits on one chart and watches the whole account. The name is literal: an exchange halts trading when a threshold is bre
FREE
Commencez par la perte, pas par le gain. Décidez d'abord quelle profondeur de drawdown vous êtes prêt à traverser — 5-10 %, 20-30 % ou davantage — et laissez ensuite le système chercher du rendement à l'intérieur de cette limite. C'est dans cet ordre que travaille Veteran Army FX. Et comme personne ne sait quelle paire produira le prochain vrai mouvement, il surveille onze paires à la fois en unité de temps H4, dans les deux sens, au lieu de miser le compte sur un seul graphique. En bref Marché
Volume Trio Multi is a three-layer market-structure tool for MetaTrader 5: session Volume Profile (POC, VAH/VAL, Value Area), a CVD volume-pressure histogram with a strict Regular divergence engine, and anchored VWAP with standard-deviation bands — extended with a watchlist scanner that runs all three across the symbols in your Market Watch. This is the Pro edition of my free indicator, Volume Trio. The base engine is identical, so this page describes only what Pro adds. For the three layers the
Start with the loss, not the profit. First decide how deep a drawdown you are willing to sit through — and then let the system go after returns inside that limit. That is the order Veteran Army Gold works in. And because gold does not move the way currencies move, it works the market one price level at a time, buying and selling, instead of betting the account on a single idea. The same discipline behind Veteran Army FX, applied to a single market that behaves like nothing else. At a glance Mark
Envelope monitoring for multi-EA accounts. Each magic number is watched against its own backtest; you get a traffic light on the chart and an alert only when a state changes. Includes the full free measurement layer. What it is You run several Expert Advisors on one account. This utility reads their closed history, groups it by magic number, and watches every system against its own backtest: a traffic light on the chart, and an alert only when a state actually changes. Underneath sits a full mea
Start with the loss, not the profit. First decide how deep a drawdown you are willing to sit through — 5-10%, 20-30%, or more — and then let the system go after returns inside that limit. That is the order Veteran Army Nasdaq works in. And because no one knows when the index will make its next real move — or in which direction — it stands ready on both sides of one market, with many independent systems instead of one confident bet. At a glance Market: US Tech 100 index, long and short, on the H1
Filtrer:
Aucun avis
Répondre à l'avis