Volume Trio

Three institutional lenses. One deterministic engine.

Most tools show you one dimension of the market. This indicator fuses the three that professionals cross-check constantly — and makes them talk to each other on a single chart:

  • WHERE — Session Volume Profile. Per-session horizontal profiles with POC, VAH/VAL and a shaded Value Area, split into buying vs. selling pressure. You see the levels the market has actually accepted — and the thin air pockets it hasn't.
  • WHEN — CVD Pressure Divergence. A signed volume-pressure histogram with a strict, multi-gate Regular divergence engine (Classic -> Continuity -> Swing -> Minimum Separation). Confirmed +RD/-RD events are drawn on price and on the pane, with rich hover tooltips, alerts and live counters. An optional Micro 5m confirmation validates pivots with closed 5-minute sub-bars for an earlier known-time. 
  • HOW FAR — Anchored VWAP with sigma bands. Daily/Weekly/Monthly VWAP with +/- standard-deviation bands (default 2.0). Hover any line and a tooltip tells you exactly what you are looking at.

Plus an independent ET (Exhaustion Trajectory) lane that flags when the participation behind a sustained push is fading — a slow "pay attention" flag, deliberately separate from the divergence engine.


Why the combination is the edge

Each layer filters the noise of the others. A divergence alone is a statistic; a divergence at the POC or a Value Area edge is pressure disagreement meeting a level the market has already proven it defends. A 2-sigma VWAP tag

alone is just stretch; stretch plus a fading-pressure print plus a profile shelf underneath is a complete, three-dimensional context. That cross-confirmation is what one-dimensional indicators cannot give you.


Two strategy hints to explore

  1. Reversion at the band. Try the m15 and m5 timeframe: when price tags the 2.0 standard-deviation VWAP band, watch for a CVD divergence print, targeting a rotation back to VWAP or the session POC. In our observation, divergences that print inside key Volume Profile zones — the POC, the VAH/VAL boundaries, or a prior session's ledge — are considerably more decisive than those appearing in low-volume gaps.
  2. Continuation at VWAP. Note which side of VWAP price has been accepted on today — where most bars have closed so far. When price stretches away on that side and then returns to VWAP, watch for a reversal print at the line: a CVD divergence back in the accepted direction, or an ET flag against the pullback. The idea is that the accepted side reasserting itself at VWAP is the day's trend defending its average. Treat the print as context for your own timing and exits, not as a mechanical trigger.

Both are research starting points, not trading systems: forward-test them yourself, on your own instruments, spreads and sessions, before risking anything. Past behaviour never guarantees future results.

Don't have time to track your whole watchlist?

Volume Trio Multi is the Pro edition of this indicator. The engine is the same. It alerts you when the stars are aligned for a pair in your watchlist.

If you want to track many pairs at the same time without spending hours watching charts, that is what Multi is built for. The terminal does the watching; you step in only when something actually lines up. And when you do open a chart, more of the profile's history is already drawn for you: where value formed during the session, where it moved, and which levels the market has left unfinished.

What it adds first is a watchlist scanner: the same three-layer logic run across the symbols already in your Market Watch, on a timeframe you choose, with an alert for each of the two strategy hints above — the reversion reading, when a divergence lines up with a sigma-band tag or a key profile zone, and the continuation reading, when the day's accepted side of VWAP defends the line with a divergence in its direction. A dashboard shows every symbol's state at a glance, and clicking a row opens that chart.

Beyond the scanner: composite profiles over the last N sessions or a custom date range, developing POC and Value Area traces with VPOC migration, naked POC tracking, and hover tooltips on every line drawn on the chart.

In short: this free version reads one chart. Multi watches your whole list.

For Multi Version: https://www.mql5.com/en/market/product/188176

This free edition stays free and stays complete. It is not a trial, and nothing here is time-limited or reduced in function.


Built honestly

  • All readings derive from provider-local volume and OHLC — a pressure proxy, not centralized order flow. Markers are context, never buy/sell signals.
  • Fully deterministic on closed bars: reloads and timeframe switches reproduce the identical event history.
  • Auto profiles tuned for 5m / 15m / 30m; graceful manual fallbacks everywhere (nothing silently goes dark).
  • Diagnostics panel exposes the whole engine: every counter, every rejection gate, the full ET state.
  • Three master layer toggles, dark/light auto theme, alert channels (popup / sound / push), English glossary panel.


Quick start

  1. Drop it on a 5m or 15m chart with defaults (Auto profile does the tuning).
  2. Hover the blue VWAP line and its dotted bands — the tooltips introduce themselves.
  3. Turn on the Diagnostics and Glossary panels while you learn the markers, then switch them off.
This tool provides analytical context only and makes no profitability claims.

Trading involves substantial risk; test every idea independently.

Every abbreviation on the chart

Main chart (price window)

Mark Meaning How to read it
POC (gold bar + label) Point of Control — the price level with the highest traded activity of that session's profile The session's strongest "magnet" / acceptance level. Price tends to revisit it.
VAH (green label) Value Area High — upper boundary of the zone holding the configured percent (default 70%) of session activity Above VAH = price trading at a premium vs. the session's accepted value.
VAL (green label) Value Area Low — lower boundary of the same zone Below VAL = price trading at a discount vs. accepted value.
Profile bars (horizontal green/red) Per-price-level activity, split into buying vs. selling pressure by the proxy Long bars = heavy acceptance ("shelves"). Thin gaps = low-volume air pockets price crosses quickly.
Shaded band The Value Area itself The session's "fair" zone between VAH and VAL.
Dotted vertical line Session boundary (Daily / Weekly / Monthly anchor) Each profile is built per session.
Blue line Anchored VWAP — volume-weighted average price since the session anchor The session's volume-fair price. Hover it: a tooltip confirms what it is.
Dotted blue lines VWAP sigma bands — VWAP +/- (multiplier x standard deviation), default 2.0 Statistical stretch. Hover a band: the tooltip shows the exact multiplier.
C +RD / C -RD (green / red) Confirmed Regular Divergence, bullish (+) or bearish (-), confirmed by Standard chart bars Price made a lower low while the pressure index made a higher low (+RD), or a higher high with a lower pressure high (-RD). The connecting line joins the two pivot origins.
M +RD / M -RD The same event confirmed by Micro 5m mode Identical logic; the pivot was validated earlier using a quota of closed 5-minute sub-bars instead of full chart bars.
ET+ (cyan) Exhaustion Trajectory, bullish setup proxy Price kept pressing lower while downside participation faded sharply in the second half of the measured window. Watched as bullish-reaction context.
ET- (orange) Exhaustion Trajectory, bearish setup proxy Price kept pressing higher while upside participation faded. Watched as pullback context.

Every divergence and ET label carries a hover tooltip with the measured span, the price change, the pressure-index change and a plain-language interpretation.


Indicator pane (bottom window)

Element Meaning
Histogram Signed volume-pressure proxy: rolling sum (Periodic) or EMA of the per-bar pressure delta. Green above zero = net buying pressure, red below = net selling pressure.
Muted hues by design so markers stay readable.
Divergence lines + C/M labels The pane mirror of every confirmed divergence, joining the two pressure pivots.
Diagnostics panel (optional, top-right) Live engine state: timeframe/profile, pressure mode, pivot geometry, confirmation mode, structure guard, continuity epochs, pivot/event counters, rejection counters
(E=epoch, S=swing, M=min-separation, Q=micro quota), full ET status, layer toggles.
Glossary panel (optional, top-left) A one-screen reminder of every abbreviation.


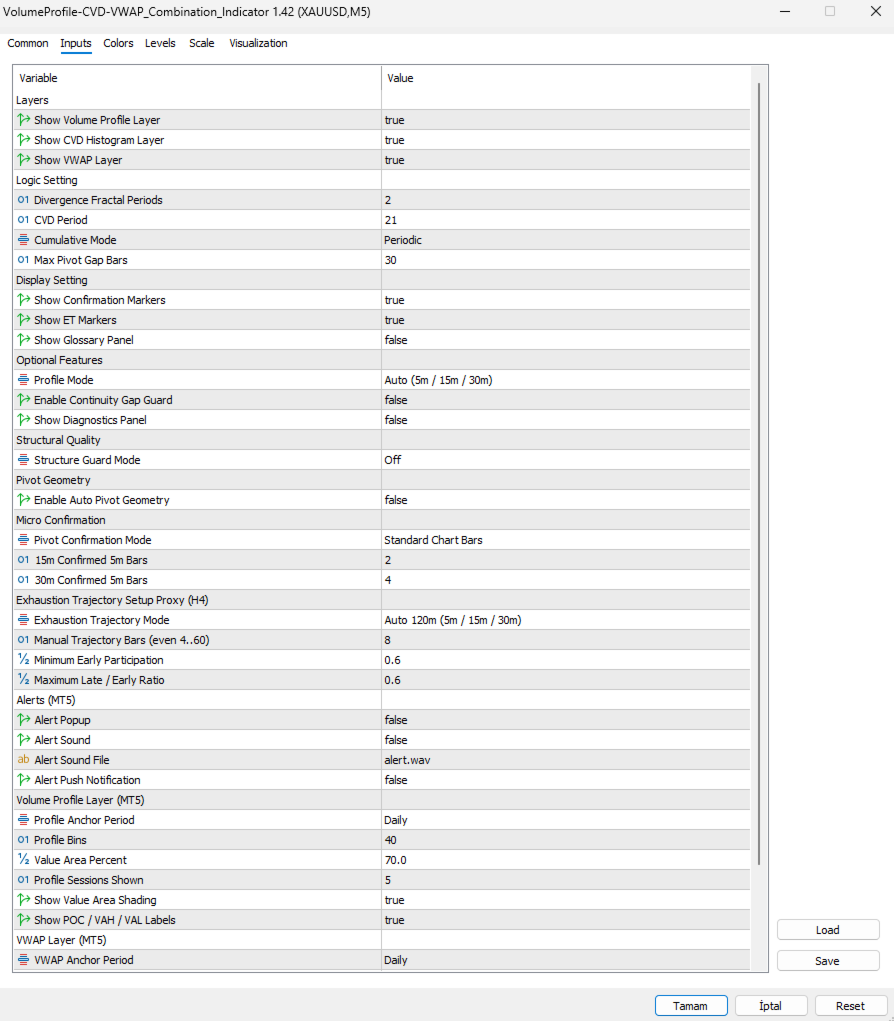
Inputs, group by group

Layers
  • Show Volume Profile / CVD Histogram / VWAP Layer — master switches. The CVD engine keeps computing even when its plot is hidden, so divergences and alerts stay alive.
Logic Setting
  • Divergence Fractal Periods (2) — manual pivot width (left/right bars in Standard mode; left width in Micro mode).
  • CVD Period (21) — window of the pressure histogram (Periodic sum or EMA).
  • Cumulative Mode (Periodic) — Periodic = moving sum of the last P deltas; EMA = exponential average, faster on new bars.
  • Max Pivot Gap Bars (30) — exclusive upper bound for the distance between the two divergence pivots.
Display Setting
  • Show Confirmation Markers (on) — C/M +/-RD labels only; lines, counters and alerts are unaffected.
  • Show ET Markers (on) — ET+/ET- labels only; ET events and alerts continue.
  • Show Glossary Panel (off) — the abbreviation cheat-sheet.
Optional Features
  • Profile Mode (Auto) — on exact 5m/15m/30m charts, P/Trend/Gap auto-set to 63/150/<90, 21/50/<30, 11/25/<15. Elsewhere the Manual values apply.
  • Enable Continuity Gap Guard (off) — rejects pivot pairs separated by a chart-time gap larger than 1.5x the nominal bar; weekend gaps count.
  • Show Diagnostics Panel (off) — the live engine table.
Structural Quality
  • Structure Guard Mode (Off) — optional extra admission rules: Swing Guard (an opposite pivot must sit between the pair), Minimum Separation (gap >= Left + right-footprint + 1), or both.
Pivot Geometry
  • Enable Auto Pivot Geometry (off) — on 5m/15m/30m uses L=4/3/2 with R=2 instead of the manual n/n.
Micro Confirmation
  • Pivot Confirmation Mode (Standard) — Standard = classic right-side chart bars. Micro 5m = the pivot on the previous closed host bar is validated by a quota of closed 5-minute sub-bars, giving an earlier known-time. Only on exact 15m/30m charts; elsewhere it falls back to Standard.
  • 15m / 30m Confirmed 5m Bars (2 / 4) — the closed sub-bar quota. Touching the pivot level exactly is tolerated; a decisive break before the quota completes cancels the candidate.
Exhaustion Trajectory Setup Proxy (H4)
  • Exhaustion Trajectory Mode (Auto 120m) — Auto uses W=24/8/4 bars on 5m/15m/30m; elsewhere the Manual window applies as chart bars.
  • Manual Trajectory Bars (8) — even 4..60; the observation window W. The engine needs 4W bars of clean history (3W calibration + W observation).
  • Minimum Early Participation (0.60) — required early-half intensity, normalized by the prior 3W mean absolute delta.
  • Maximum Late / Early Ratio (0.60) — how much of the early intensity may survive into the late half; lower = stricter fade requirement.
Alerts (MT5)
  • Popup / Sound / Sound File / Push — delivery channels for divergence and ET alerts. All default off; events fire on the live closed bar only.
Volume Profile Layer
  • Profile Anchor Period (Daily), Profile Bins (40), Value Area Percent (70), Profile Sessions Shown (5), Show Value Area Shading (on), Show POC / VAH / VAL Labels (on).
VWAP Layer
  • VWAP Anchor Period (Daily), Show VWAP Sigma Bands (on), VWAP Band Multiplier (2.0).
Appearance
  • Color Theme (Auto — follows the chart background), Max Drawn
  • Divergences (150 — older drawings are pruned; counters keep the truth).


Practical notes

  • Load on m15 or m5 with defaults for the tuned experience (Auto profile). Micro 5m mode requires M5 history; the indicator retries automatically while the terminal downloads it.
  • Open the Diagnostics panel whenever something looks quiet — the rejection counters tell you exactly which gate is filtering candidates.
  • The engine is fully deterministic on closed bars: scrolling back, reloading or switching timeframes reproduces the identical event history.

Рекомендуем также
Value Chart Candlesticks
Flavio Javier Jarabeck
4.57 (14)
The idea of a Value Chart indicator was presented in the very good book I read back in 2020 , " Dynamic Trading Indicators: Winning with Value Charts and Price Action Profile ", from the authors Mark Helweg and David Stendahl. The idea is simple and the result is pure genius: Present candlestick Price analysis in a detrended way! HOW TO READ THIS INDICATOR Look for Overbought and Oversold levels. Of course, you will need to test the settings a lot to find the "correct" one for your approach. It
FREE
Daily High Low Danilo Monteiro
Danilo Hudson Couto Monteiro
4 (2)
# Indicador Daily High - Danilo Monteiro - MT5 ## Descrição O Daily High/Low Labels é um indicador personalizado para MetaTrader 5 que exibe automaticamente as máximas e mínimas diárias no gráfico, facilitando a identificação rápida dos níveis importantes de preço. O indicador marca os preços com etiquetas e linhas horizontais, permitindo uma visualização clara dos níveis críticos do dia atual e anterior. ## Principais Características ### 1. Marcação Automática - Exibe automaticamente as máxi
FREE
Donchian Channel is an indicator created by Richard Donchian. It is formed by taking the highest high and the lowest low of the last specified period in candles. The area between high and low is the channel for the chosen period. Its configuration is simple. It is possible to have the average between the upper and lower lines, plus you have alerts when price hits one side. If you have any questions or find any bugs, please contact me. Enjoy!
FREE
Institutional Tick Engine Lite: Инструмент анализа скорости тиков и разворотов Institutional Tick Engine Lite — это технический индикатор, разработанный для анализа скорости рынка (Velocity) и логики микроструктуры с использованием сырых тиковых данных. Это базовая версия профессионального пакета, которая обрабатывает тиковые данные в реальном времени, предоставляя метрики для скальпинга и внутридневной торговли. Основные функции Монитор скорости тиков (Velocity): Гистограмма в реальном времени,
FREE
Indicador Regressão Linear – Par de Ativos - INTRADAY Indicador é um oscilador que faz o plot do Resíduo resultado da regressão linear entre os dois ativos inseridos como input do indicador, representado pela fórmula: Y = aX + b + R Onde Y é o valor do ativo dependente, X é o valor do ativo independente, a é a inclinação da reta entre os dois ativos, b é a intersecção da reta e R é o resíduo. O resíduo representa a quantidade da variabilidade que Y que o modelo ajustado não consegue explicar. E
FREE
MIDAS Super VWAP
Flavio Javier Jarabeck
4.27 (11)
Imagine VWAP, MVWAP and MIDAS in one place... Well, you found it! Now you can track the movement of Big Players in various ways, as they in general pursue the benchmarks related to this measuring, gauging if they had good execution or poor execution on their orders. Traders and analysts use the VWAP to eliminate the noise that occurs throughout the day, so they can measure what prices buyers and sellers are really trading. VWAP gives traders insight into how a stock trades for that day and deter
FREE
Follow The Line MT5
Oliver Gideon Amofa Appiah
4.6 (35)
This indicator obeys the popular maxim that: "THE TREND IS YOUR FRIEND" It paints a GREEN line for BUY and also paints a RED line for SELL. (you can change the colors). It gives alarms and alerts of all kinds. IT DOES NOT REPAINT and can be used for all currency pairs and timeframes. Yes, as easy and simple as that. Even a newbie can use it to make great and reliable trades. NB: For best results, get my other premium indicators for more powerful and reliable signals. Get them here: https://www.m
FREE
Обзор Heiken Ashi Smoothwave преобразует ваш график в сглаженные свечи Heiken Ashi прямо в основном окне графика, заменяя стандартные свечи для более чистого отображения тренда. Без отдельного окна, без загромождения. Как это работает Рассчитывает значения OHLC Heiken Ashi на основе реальных цен на каждом баре. Отображает цветные свечи Heiken Ashi прямо на основном графике. Автоматически скрывает стандартные свечи графика, оставляя видимыми только свечи Heiken Ashi. Автоматически восстанавлива
FREE
Girassol Sunflower MT5 Indicator
Saullo De Oliveira Pacheco
3.86 (7)
This is the famous Sunflower indicator for Metatrader5. This indicator marks possible tops and bottoms on price charts. The indicator identifies tops and bottoms in the asset's price history, keep in mind that the current sunflower of the last candle repaints, as it is not possible to identify a top until the market reverses and it is also not possible to identify a bottom without the market stop falling and start rising. If you are looking for a professional programmer for Metatrader5, please
FREE
VWAP and MVWAP
Flavio Javier Jarabeck
4 (9)
Volume Weighted Average Price (VWAP) is a trading benchmark commonly used by Big Players that gives the average price a Symbol has traded throughout the day. It is based on both Volume and price. Additionally we put in this indicator the MVWAP (Moving Volume Weighted Average Price). For those who do not know the usage and the importance od this indicator I recommend a great article about this subject at Investopedia ( https://www.investopedia.com/articles/trading/11/trading-with-vwap-mvwap.asp )
FREE
Stackable VWAP
Flavio Javier Jarabeck
3.5 (4)
Volume Weighted Average Price (VWAP) is a trading benchmark commonly used by Big Players that gives the average price a Symbol has traded throughout the day. It is based on both Volume and price. Additionally we put in this indicator the MVWAP (Moving Volume Weighted Average Price). For those who do not know the usage and the importance od this indicator I recommend a great article about this subject at Investopedia ( https://www.investopedia.com/articles/trading/11/trading-with-vwap-mvwap.asp
FREE
Общее описание Этот индикатор — усовершенствованная версия классического канала Дончия с добавлением практических функций для реальной торговли. Помимо стандартных трёх линий (верхняя, нижняя и средняя), система определяет пробои и отображает их на графике стрелками, показывая только линию, противоположную текущему направлению тренда для более чистого восприятия. Индикатор включает: Визуальные сигналы : цветные стрелки при пробое Автоматические уведомления : всплывающие окна, push и email Фильтр
FREE
Phoenix Delta Volume
Nigel Nii Darku Narnor Darko
5 (1)
This is the Phoenix Institutional SMC Dashboard (Emerald-Teal Edition). It is engineered to provide retail traders with the same "Volume-at-Price" clarity used by institutional desks. Below is a full breakdown of the benefits, the high-confluence logic for entries, and how to manage your trades using the current visual engine. Strategic Benefits to the User Sentiment over Price: Most indicators only look at where the price is. This dashboard tells you how much effort (Volume Delta) was required
FREE
Поддержка и Сопротивление Предыдущего Дня Платформа: MetaTrader 5 Тип: Пользовательский индикатор Отображение: Окно графика (наложение) Функции: Вычисляет уровни поддержки и сопротивления на основе экстремумов предыдущего дня. Использует скользящее окно ( SampleWindowSize ) для анализа локального диапазона цен. Определяет зону поддержки , если текущая волатильность значительно ниже предыдущих максимумов. Определяет зону сопротивления , если цена торгуется выше предыдущих минимумов. Отображает 4
FREE
Waves Sizer
Flavio Javier Jarabeck
3.86 (7)
Wyckoff fans, enjoy! Ideally to be used with the Weis Waves indicator, but it can be easily used alone, the Waves Sizer puts the range (in resulting Price movement) done by the Price on its market swings. You can control how accurate or loose will be the swings. This tool is very helpful for visually know how much the Price has traveled in your Timeframe. This way you can confront this level of effort with the resulting Volume, etc... Weis Waves indicator: https://www.mql5.com/en/market/produc
FREE
Super Trend eu
Emin Ulucanli
4.83 (6)
SUPERTREND ; Это индикатор следования за трендом, основанный на SuperTrend ATR, созданном Оливье Себаном. Его можно использовать для обнаружения изменений в направлении тренда и обнаружения стопов. Когда цена падает ниже кривой индикатора, она становится красной и указывает на нисходящий тренд. И наоборот, когда цена движется выше кривой, индикатор становится зеленым, указывая на восходящий тренд. Как и другие индикаторы, он хорошо работает с SuperTrend в сочетании с другими индикаторами, такими
FREE
Dual RSI
Paul Conrad Carlson
3.5 (2)
Indicator alerts for Dual Relative strength index rsi. Large rsi preset at 14 is below 30 small rsi preset at 4 is below 10 for buy bullish signals . Large rsi preset are 14 is above 70 small rsi preset at 4 is above 90 for sell bearish signals . Includes mobile and terminal alerts. draws lines when alerts. This indicator can help identify extremes and then the tops or bottoms of those extremes .
FREE
RaysFX Pattern Detector è uno strumento di analisi tecnica all'avanguardia progettato per i trader che basano le loro decisioni sull'azione dei prezzi (Price Action). Questo indicatore scannerizza automaticamente il grafico in tempo reale per identificare e segnalare i pattern candlestick più affidabili e noti, eliminando il lavoro manuale e aiutandoti a non perdere mai un'opportunità di trading. Che tu sia un trader discrezionale, un principiante che sta imparando a riconoscere le candele, o un
FREE
VWAP Indicator
LUC JACOBUS A VERHEECKE
4.11 (27)
Volume Weighted Average Price (VWAP) The volume weighted average price (VWAP) is a  trading   benchmark  used by traders that gives the average price a security has traded at throughout the day, based on both volume and price. It is important because it provides traders with insight into both the trend and value of a security. This indicator VWAP V2 is free and is the manual version of the extended Easy VWAP indicator (30 Euro), where the date and time properties are automatically entered. With
FREE
Renko subwindow
Alexandre Vincent Traber
Overview Renko SubWindow строит график Renko в виде цветных свечей в отдельном окне индикатора, не затрагивая основной график. Размер кирпича можно задать фиксированным в пунктах или рассчитывать динамически по ATR для адаптивных кирпичей на основе волатильности. How it works Реконструирует кирпичи Renko на основе цен закрытия текущего символа/таймфрейма. Новый кирпич формируется, когда цена превышает заданный размер кирпича от закрытия предыдущего. Кирпичи отображаются как цветные свечи: бычий
FREE
Premium Trend Entry Pro TZ Trade Logics, представляет вам улучшенную версию входа в тренд Premium Этот выпуск принесет вам гораздо более расслабленное состояние торговли с расширенными функциями для фильтрации тренда и временем входа премиального сигнала. Для нас важно не создание продукта! но продолжали обслуживание и обучение пользователей. Благодаря нашим специальным средствам связи с нами вы получите подробное руководство по использованию продукта и другие соответствующие тренинги, связа
FREE
PROMETHEUS TECHNICAN VERSION Free | By THE SONS A gift from The Sons — no strings, no trial, no expiry. Every trader deserves access to professional-grade market intelligence. That belief is why Prometheus Technical Version exists, and why it costs nothing. Consider it our handshake to the trading community. What You're Getting This is not a simplified tool dressed up as a gift. Prometheus Technican Version is a fully built, institutional-quality technical analysis indicator running a dual-model
FREE
Simple Vwap with the daily, weekly and monthly VWAP is the abbreviation for   volume-weighted average price , which is a technical analysis tool that shows the ratio of an asset's price to its total trade volume. It provides traders and investors with a measure of the average price at which a stock is traded over a given period of time. How it's used Identify entry and exit points:   Traders can use VWAP to determine when to buy or sell an asset.   Understand price trends :  Traders can use V
FREE
DS RVOL: The Relative Volume Indicator for MT5 RVOL is a straightforward Relative Volume (RVOL) indicator for MetaTrader 5. It shows you how current volume compares to a historical average, providing a quick way to gauge the strength of a price move. How it Works Relative Volume is a simple ratio: R V O L = C u rre n t V o l u m e ​/ A v er a g e H i s t or i c a l V o l u m e RVOL > 1.0 : Volume is higher than usual. This suggests there's strong interest and potential for a sustained move. RVOL
FREE
Wave Box Market Frenquency
Jean Jacques Huve Ribeiro
4.75 (4)
Totally linked to the result of a movement and the duration he had. Its height records how many ticks the asset walked during a given movement, its width shows us the duration that movement had. Its configuration must be in line with the Weis Wave Indicator configuration to observe the movement force and can indicate a possible accumulation or distribution of the movement;
FREE
Weis Wave Scouter Basic
Jean Carlos Martins Roso
5 (1)
The Weis Wave Scouter Basic is the essential version of our renowned indicator for MetaTrader 5, designed for traders who wish to explore the concepts of the Wyckoff method and VSA (Volume Spread Analysis) in an accessible and efficient way. Based on volume wave reading, this simplified indicator allows you to clearly identify market movements, focusing on the principles of effort vs result and supply and demand, as taught by Richard Wyckoff. With Weis Wave Scouter Basic, you can visualize bull
FREE
VWAP + Volume Profile Combined Indicator FREE Launch Offer OVERVIEW Professional combination of VWAP (Volume Weighted Average Price)  and Volume Profile in a single MT5 indicator. This powerful tool  combines two of the most respected institutional trading tools  into one seamless display. KEY FEATURES 1. VWAP with 6 calculation modes 2. Volume Profile with Value Area analysis 3. Point of Control identification 4. Standard deviation bands 5. Dynamic color changing 6. Separate buy/sell vol
FREE
Swiss VWAPsimple
Terence Gronowski
4.8 (5)
Swiss VWAPsimple Motivation Did not find free VWAP that works, the one that I found craseh. So I created a VWAP which calculates values only for the actual day. So computer resouces are not over stressed. What is VWAP, how is it used?  VWAP stands for Volume Weighed Average Price, it calculates the running sum of tick volume and the runnung sum of price times tickvolume. The division of these sums result in a weighed price (Sum P*V/Sum V). The calculation starts normally at midnight. The values
FREE
VolumeBasedColorsBars — Free Powerful Volume Analysis for All Traders Unlock the hidden story behind every price bar! VolumeBasedColorsBars is a professional-grade, 100% FREE indicator that colorizes your chart candles based on real, adaptive volume analysis. Instantly spot surges in market activity, identify exhaustion, and catch the moves that matter. This indicator gives you:    • Dynamic color-coded bars for instant volume context    • Adaptive thresholds based on historical, session-awar
FREE
Tabajara V5
Flavio Javier Jarabeck
4.84 (37)
Metatrader 5 version of the famous Andre Machado's Tabajara indicator. If you don't know Andre Machado's Technical Analysis work you don't need this indicator... For those who need it and for those several friend traders who asked this porting from other platforms, here it is... FEATURES 8-period Moving Average 20-period Moving Average 50-period Moving Average 200-period Moving Average Colored candles according to the inflexion of the 20-period MA SETTINGS You can change the Period of all MA's
FREE
С этим продуктом покупают
Этот продукт был обновлен для рынка 2026 года и оптимизирован для последних сборок MT5. УВЕДОМЛЕНИЕ ОБ ИЗМЕНЕНИИ ЦЕНЫ: Smart Trend Trading System сейчас доступен за $99 . Цена увеличится до $199 после следующих 30 покупок . СПЕЦИАЛЬНОЕ ПРЕДЛОЖЕНИЕ: После покупки Smart Trend Trading System отправьте мне личное сообщение, чтобы получить Smart Universal EA БЕСПЛАТНО и превратить сигналы Smart Trend в автоматические сделки. Smart Trend Trading System — это полноценная торговая система без перерисов
Trend Sniper X
Sarvarbek Abduvoxobov
4.88 (32)
Trend Sniper X — это трендовый индикатор для MetaTrader 5, работающий на нескольких таймфреймах, который помогает трейдерам точно и ясно определять направление тренда и потенциальные точки разворота. для MT4: https://www.mql5.com/en/market/product/193245 Информация о цене: Текущая цена является промо-ценой и может измениться по мере выхода предстоящих обновлений и новых функций. Бонусное предложение: Чтобы получить БЕСПЛАТНЫЙ авто-трейд советник Assistant EA для этого индикатора, пожалуйста, на
Давайте сначала будем честны. Ни один индикатор сам по себе не сделает вас прибыльным. Если кто-то говорит вам обратное — он продаёт вам мечту. Любой индикатор, который показывает идеальные стрелки покупки/продажи, можно сделать безупречным — просто увеличьте нужный участок истории и сделайте скриншот успешных сделок. Мы так делать не будем. SMC Intraday Formula — это инструмент. Он считывает структуру рынка за вас, определяет зоны с наивысшей вероятностью движения цены и точно показывает, как
Neuro Poseidon - новый индикатор от Дарьи Резуевой. Он сочетает точные торговые сигналы с адаптивными уровнями TP/SL , в результате создавая максимально выгодные сделки! TO SWITCH TO   ENG   PLEASE CHOOSE IT IN THE UPPER-RIGHT CORNER OF THE WEBSITE Напишите мне и получите  Neuro Poseidon Assistant  в подарок для автоматизации вашей торговли! Что отличает его от других индикаторов? 1. Доказанная прибыльность на всех активах и таймфреймах 2. На графике присутствуют только подтвержденные сигналы н
SuperScalp Pro
Van Minh Nguyen
4.63 (32)
SuperScalp Pro - Professional Multi-Layer Confluence Scalping System SuperScalp Pro — это продвинутый индикатор для скальпинга, который улучшает классический Supertrend с помощью нескольких интеллектуальных фильтров подтверждения. Он помогает определять торговые возможности Buy/Sell с более высокой вероятностью, значительно сокращая количество ложных сигналов. Чёткие стрелки Buy и Sell отображаются непосредственно на графике, а уровни Stop Loss и Take Profit на основе ATR автоматически рассчитыв
Welcome to ENTRY IN THE ZONE AND SMC MULTI TIMEFRAME Entry In The Zone and SMC Multi Timeframe is a real-time market analysis tool based on Smart Money Concepts (SMC), designed to analyze market structure, price direction, and key trading zones. It supports both Single-Timeframe Analysis and Multi-Timeframe Analysis, providing a clearer view of the overall market structure across multiple timeframes, with real-time BUY / SELL signals that do not repaint. It is designed to help filter trading opp
Zoryk Gold
Reda El Koutbane
5 (7)
Скидка заканчивается через 24 часа — следующая цена $ 69 ZORYK — продвинутая сигнальная система для XAUUSD в MetaTrader 5 Вам знакомо это чувство. Вы долго анализируете золото. Ждёте подходящего момента для входа. Наконец открываете сделку — и цена сразу начинает двигаться против вас. Вы закрываете позицию слишком рано, передвигаете Stop Loss или сомневаетесь всего несколько секунд. После этого рынок достигает именно той цели, которую вы ожидали изначально, но уже без вас. Проблема не всегда за
GoldenX Entry — это индикатор для MT5 с адаптивным алгоритмом Smart Entry Trend, системой оценки сигналов, детектором рыночных режимов и фильтром волатильности. Каждый сигнал включает рассчитанный уровень входа, три уровня Take-Profit (TP1, TP2, TP3) и уровень Stop-Loss. Он построен на нескольких аналитических слоях, предназначенных для адаптации к различным рыночным условиям, объединяя многоуровневую аналитическую систему со встроенным оптимизатором и системой статистического отслеживания. Инди
UNIX Scalper — Gold Scalping Indicator for MetaTrader 5 UNIX Scalper is a focused Gold scalping indicator designed primarily for XAUUSD on M1, M2, M3, M5, M10 and M15. It gives the trader a clear BUY, SELL or WAIT decision together with the complete trade plan: Entry, Stop Loss, TP1 and TP2 . The concept is simple: wait for the signal, follow the levels, move the Stop Loss to Break Even after TP1, and trade with discipline. Learn UNIX Scalper Everything you need to learn and use the product is
Reversion King Indicator
Eugen-alexandru Zibileanu
5 (7)
Новый король в городе — Индикатор + управление ордерами (TP1 + TP2 + TP3) + опциональный Telegram-сигнал-сендер ВКЛЮЧЁН (БЕСПЛАТНО) (ПОЛНОЦЕННАЯ ТОРГОВАЯ И СИГНАЛЬНАЯ СИСТЕМА) Gold Slayer EA Этот индикатор включает в себя продвинутую стратегию, торговую систему с настраиваемым управлением ордерами и систему mean reversion, которая сочетает расширения Envelope и поддерживается несколькими интеллектуальными фильтрами подтверждения, такими как RSI, для поиска высоковероятных точек разворота с сигн
UZFX {SSS} Scalping Smart Signals v5.0 MT5 — это высокопроизводительный торговый индикатор без перерисовки, разработанный для скальперов, дейтрейдеров и свинг-трейдеров, которым требуются точные сигналы в режиме реального времени на быстро меняющихся рынках. Разработанный компанией (UZFX-LABS), этот индикатор сочетает в себе анализ ценового действия, подтверждение тренда и интеллектуальную фильтрацию для генерации высоковероятных сигналов на покупку и продажу, предупреждающих сигналов и возможно
Этот продукт был обновлен для рынка 2026 года и оптимизирован для последних сборок MT5. УВЕДОМЛЕНИЕ ОБ ИЗМЕНЕНИИ ЦЕНЫ: Atomic Analyst сейчас доступен за $99 . Цена увеличится до $199 после следующих 30 покупок . СПЕЦИАЛЬНОЕ ПРЕДЛОЖЕНИЕ: После покупки Atomic Analyst отправьте мне личное сообщение, чтобы получить Smart Universal EA БЕСПЛАТНО и превратить сигналы Atomic Analyst в автоматические сделки. Atomic Analyst — это индикатор Price Action без перерисовки, без перерисовывания истории и без
M1 SNIPER   — это простая в использовании торговая система. Это стрелочный индикатор, разработанный для тайм фрейма M1. Индикатор можно использовать как отдельную систему для скальпинга на тайм фрейме M1, а также как часть вашей существующей торговой системы. Хотя эта торговая система была разработана специально для торговли на M1, ее можно использовать и с другими тайм фреймами. Первоначально я разработал этот метод для торговли XAUUSD и BTCUSD. Но я считаю этот метод полезным и для торговли на
Gold Entry Sniper – Профессиональная Мульти-Таймфрейм ATR Панель для Скальпинга и Свинг-Трейдинга на Золоте Gold Entry Sniper — это передовой индикатор для MetaTrader 5, разработанный для точных сигналов на покупку/продажу по XAUUSD и другим инструментам. Основан на логике ATR Trailing Stop и мульти-таймфрейм анализе , этот инструмент идеально подходит как для скальперов, так и для среднесрочных трейдеров, обеспечивая чёткие точки входа с высокой вероятностью . Основные возможности и преимуществ
Gann Made Easy   - это профессиональная, но при этом очень простая в применении Форекс система, основанная на лучших принципах торговли по методам господина У.Д. Ганна. Индикатор дает точные BUY/SELL сигналы, включающие в себя уровни Stop Loss и Take Profit. ПОЖАЛУЙСТА, СВЯЖИТЕСЬ СО МНОЙ ПОСЛЕ ПОКУПКИ, ЧТОБЫ ПОЛУЧИТЬ ТОРГОВЫЕ ИНСТРУКЦИИ И ОТЛИЧНЫЕ ДОПОЛНИТЕЛЬНЫЕ ИНДИКАТОРЫ БЕСПЛАТНО! Вероятно вы уже не раз слышали о торговли по методам Ганна. Как правило теория Ганна отпугивает от себя не только
ATSTRONG PRO: Индикатор Структуры Рынка и Пробоев Движок Обнаружения Пробоев | 5 Динамических Целей TP | Живая Панель Дашборда | Без Перерисовки Вводная Цена Текущая Цена: $59 — Цена увеличивается на $10 после каждых 10 продаж. ATSTRONG PRO — это передовой индикатор пробоев и институциональной структуры рынка, разработанный для MetaTrader 5. Он обнаруживает высоковероятные свинговые развороты, идентифицирует кластерные зоны накопления поддержки и сопротивления, а также сигнализирует о сломе с
Currency Strength Wizard   — очень мощный индикатор, предоставляющий вам комплексное решение для успешной торговли. Индикатор рассчитывает силу той или иной форекс-пары, используя данные всех валют на нескольких тайм фреймах. Эти данные представлены в виде простых в использовании индексов валют и линий силы валют, которые вы можете использовать, чтобы увидеть силу той или иной валюты. Все, что вам нужно, это прикрепить индикатор к графику, на котором вы хотите торговать, и индикатор покажет вам
Entry Points Pro — топовый индикатор, дающий перспективные точки входа в сделки без перерисовки. Индикатор покажет заранее стрелкой точку входа в сделку, укажет цену входа и нарисует на графике уровень входа и стопа, а так же рассчитает рабочий лот под твой депозит и риск, а панель статистики поможет выбрать самый перспективный инструмент и таймфрейм .  Тебе остаётся поставить отложенный ордер и ждать реализации сделки. Чтобы показать возможности индикатора Entry Points Pro, я провёл публичный
[User Manual]   ,   [Online Course]   ,   [PDF]  And [DEMO] Axiom Matrix — это профессиональный мультисимвольный и мультитаймфреймный рыночный сканер и панель принятия решений для MetaTrader 5. Он сканирует ваш Market Watch, анализирует несколько таймфреймов, считывает несколько движков подтверждений, сравнивает самые сильные возможности и показывает лучший BUY, SELL, WAIT или заблокированное состояние внутри одной чистой матричной панели. Я создал Axiom Matrix, потому что хотел один инструмент,
Этот продукт был обновлен для рынка 2026 года и оптимизирован для последних сборок MT5. УВЕДОМЛЕНИЕ ОБ ИЗМЕНЕНИИ ЦЕНЫ: Smart Price Action Concepts сейчас доступен за $200 . Цена увеличится до $299 после следующих 30 покупок . СПЕЦИАЛЬНОЕ ПРЕДЛОЖЕНИЕ: После покупки отправьте мне личное сообщение, чтобы получить БЕСПЛАТНЫЙ бонус + подарок . Прежде всего, стоит подчеркнуть, что этот торговый инструмент является индикатором без перерисовки, без перерисовывания истории и без запаздывания, что делает
GEM Signal Pro GEM Signal Pro — это трендовый индикатор для MetaTrader 5, созданный для трейдеров, которым нужны более понятные сигналы, более структурированные торговые сетапы и более практичное управление рисками прямо на графике. Вместо того чтобы показывать только простую стрелку, GEM Signal Pro помогает представить всю торговую идею в более наглядной и удобной форме. Когда условия подтверждены, индикатор может отображать на графике цену входа, stop loss и цели take profit, помогая трейдеру
FiboSniper Pro – Multi-Filter Fibonacci System with Auto SL/TP and Control Panel FiboSniper Pro — это технический индикатор, который объединяет динамические Fibonacci Envelopes с несколькими фильтрами подтверждения для формирования отборных сигналов Buy и Sell. Уровни Fibonacci рассчитываются на основе Moving Average и ATR, а затем фильтруются с помощью ADX, EMA, RSI, ATR, Volume, Time и структуры свечи. Индикатор отображает на графике автоматические уровни Stop Loss и Take Profit на основе ATR,
Power Candles V3 — самооптимизирующийся индикатор силы Power Candles V3 преобразует силу валюты и инструмента в готовый к использованию торговый план на каждом графике, к которому он прикреплен. Вместо того, чтобы просто раскрашивать свечи, он выполняет автоматическую оптимизацию в режиме реального времени в фоновом режиме и предоставляет вам оптимальные значения Stop Loss, Take Profit и порог сигнала для выбранного вами символа. Один клик — и все готово для реальной торговли: на графике появляю
Каждый покупатель этого индикатора получает дополнительно Бесплатно: Авторскую утилиту "Bomber Utility", которая автоматически сопровождает каждю торговую операцию, устанавливает уровни Стоп Лосс и Тейк профит и закрывает сделки согласно правилам этой стратегии, Сет-файлы для настройки этого индикатора на различных активах, Сет-файлы для настройки Bomber Utility в режимы: "Минимум Риска", "Взвешенный Риск" и "Стратегия Выжидания", Пошаговый видео-мануал, который поможет вам быстро установить, н
Официальный доступ к экосистеме BlueDigitsFx Получайте обновления инфраструктуры, рабочие ресурсы, релизы продуктов и доступ к экосистеме через официальную экосистему BlueDigitsFx. Экосистема Telegram Веб-сайт BlueDigitsFx Precision Order Flow MT5 — Полный набор инструментов анализа ордер-флоу для MetaTrader 5 Профессиональный фреймворк рыночной структуры на основе сессий, объединяющий Value Areas, Point of Control, аукционный контекст и структурированную поддержку принятия решений для серьёзн
CRT Candle Range Theory HTF MT5.   Ultimate CRT Indicator: Advanced ICT Concepts and Malaysian SnR Trading System Master the Market Maker's Footprints with the Most Advanced Candle Range Theory Indicator Unlock the true power of  Smart Money Concepts (SMC)  and trade precisely like the institutions with the  Ultimate CRT Indicator . Built exclusively for serious traders, this indicator automates the highly effective  Candle Range Theory (CRT) , a core pillar of  ICT Concepts (Inner Circle Trader
Smc Pro ToolKit
Talal N Z Aljarusha
5 (12)
SMC PRO TOOLKIT — SMART MONEY ANALYSIS & STRUCTURED TRADE PLANNING SMC Pro ToolKit is a professional Smart Money Concepts analysis workspace for MetaTrader 5. It combines market structure, multi-timeframe analysis, institutional price zones, setup evaluation, confirmation tools, volume context, alerts, and risk planning inside one organized chart environment. One workspace. Multiple layers of confirmation. One structured trading plan. OPEN COMPLETE USER GUIDE MULTI-CONDITION SETUP ENGINE At
Crystal Quantum Pro
Muhammad Jawad Shabir
5 (3)
CRYSTAL QUANTUM PRO Institutional Signal & Trade Intelligence for MetaTrader 5 Final Price: 199 USD ----> Price goes up 10 USD after every 10 sales. Limited launch slots available, act fast. Most indicators give you an arrow and leave you alone. A naked arrow is a gamble. Winning consistently requires CONFLUENCE , a clear STOP and TARGET , and honest PROOF that the system works. Crystal Quantum Pro delivers all three in one clean, no-repaint package. Crystal Quantum Pro is a complete decision sy
Scalper Vault   — это профессиональная торговая система, которая дает вам все необходимое для успешного скальпинга. Этот индикатор представляет собой полную торговую систему, которую могут использовать трейдеры форекс и бинарных опционов. Рекомендуемый тайм фрейм М5. Система дает точные стрелочные сигналы в направлении тренда. Она также предоставляет вам сигналы выхода и рассчитывает рыночные уровни Ганна. Индикатор дает все типы оповещений, включая PUSH-уведомления. Пожалуйста, напишите мне пос
FX Power: Анализируйте силу валют для более эффективной торговли Обзор FX Power — это ваш незаменимый инструмент для понимания реальной силы валют и золота в любых рыночных условиях. Определяя сильные валюты для покупки и слабые для продажи, FX Power упрощает принятие торговых решений и выявляет высоковероятные возможности. Независимо от того, хотите ли вы следовать за трендами или предсказывать развороты с использованием экстремальных значений дельты, этот инструмент идеально адаптируется под
Другие продукты этого автора
Read-only analytics for accounts running several EAs. Groups your closed trades by magic number and measures how much of their combined risk actually cancels out. Free measurement edition. The monitoring and alerting edition is Portfolio Command Desk:  https://www.mql5.com/en/market/product/188884 The problem You run five Expert Advisors. Each backtest looked fine on its own. But the account does not trade five systems, it trades one portfolio, and no report in MetaTrader tells you how those sys
FREE
Hard limits for prop firm and challenge accounts Prop firm rules are not suggestions. Breach the daily loss limit by one dollar and the account is gone, whatever the equity curve looked like an hour earlier. The problem is that the rule lives on the firm's server while your positions live in your terminal, and nothing in MetaTrader 5 connects the two. Prop Firm Circuit Breaker sits on one chart and watches the whole account. The name is literal: an exchange halts trading when a threshold is bre
FREE
Начните с убытка, а не с прибыли. Сначала решите, насколько глубокую просадку вы готовы пережить — 5-10%, 20-30% или больше — и только затем позвольте системе искать доход внутри этого предела. Именно в таком порядке работает Veteran Army FX. И поскольку никто не знает, какая пара даст следующее по-настоящему крупное движение, советник одновременно наблюдает за одиннадцатью парами на таймфрейме H4, в обе стороны, вместо того чтобы ставить весь счёт на один график. Кратко Рынки: 13 валютных пар,
Volume Trio Multi is a three-layer market-structure tool for MetaTrader 5: session Volume Profile (POC, VAH/VAL, Value Area), a CVD volume-pressure histogram with a strict Regular divergence engine, and anchored VWAP with standard-deviation bands — extended with a watchlist scanner that runs all three across the symbols in your Market Watch. This is the Pro edition of my free indicator, Volume Trio. The base engine is identical, so this page describes only what Pro adds. For the three layers the
Start with the loss, not the profit. First decide how deep a drawdown you are willing to sit through — and then let the system go after returns inside that limit. That is the order Veteran Army Gold works in. And because gold does not move the way currencies move, it works the market one price level at a time, buying and selling, instead of betting the account on a single idea. The same discipline behind Veteran Army FX, applied to a single market that behaves like nothing else. At a glance Mark
Envelope monitoring for multi-EA accounts. Each magic number is watched against its own backtest; you get a traffic light on the chart and an alert only when a state changes. Includes the full free measurement layer. What it is You run several Expert Advisors on one account. This utility reads their closed history, groups it by magic number, and watches every system against its own backtest: a traffic light on the chart, and an alert only when a state actually changes. Underneath sits a full mea
Start with the loss, not the profit. First decide how deep a drawdown you are willing to sit through — 5-10%, 20-30%, or more — and then let the system go after returns inside that limit. That is the order Veteran Army Nasdaq works in. And because no one knows when the index will make its next real move — or in which direction — it stands ready on both sides of one market, with many independent systems instead of one confident bet. At a glance Market: US Tech 100 index, long and short, on the H1
Фильтр:
Нет отзывов
Ответ на отзыв