Volume Trio

  • 指标
  • Seckin Erkut
    Seckin Erkut
    Algo Trading Systems Developer. I develop strategies and portfolios not by hypes but from solid academic literature.

    I put my money where my mouth is, be sure to check the performance of my EAs through my signals.
  • 版本: 1.44
  • 更新: 7 八月 2026

Three institutional lenses. One deterministic engine.

Most tools show you one dimension of the market. This indicator fuses the three that professionals cross-check constantly — and makes them talk to each other on a single chart:

  • WHERE — Session Volume Profile. Per-session horizontal profiles with POC, VAH/VAL and a shaded Value Area, split into buying vs. selling pressure. You see the levels the market has actually accepted — and the thin air pockets it hasn't.
  • WHEN — CVD Pressure Divergence. A signed volume-pressure histogram with a strict, multi-gate Regular divergence engine (Classic -> Continuity -> Swing -> Minimum Separation). Confirmed +RD/-RD events are drawn on price and on the pane, with rich hover tooltips, alerts and live counters. An optional Micro 5m confirmation validates pivots with closed 5-minute sub-bars for an earlier known-time. 
  • HOW FAR — Anchored VWAP with sigma bands. Daily/Weekly/Monthly VWAP with +/- standard-deviation bands (default 2.0). Hover any line and a tooltip tells you exactly what you are looking at.

Plus an independent ET (Exhaustion Trajectory) lane that flags when the participation behind a sustained push is fading — a slow "pay attention" flag, deliberately separate from the divergence engine.


Why the combination is the edge

Each layer filters the noise of the others. A divergence alone is a statistic; a divergence at the POC or a Value Area edge is pressure disagreement meeting a level the market has already proven it defends. A 2-sigma VWAP tag

alone is just stretch; stretch plus a fading-pressure print plus a profile shelf underneath is a complete, three-dimensional context. That cross-confirmation is what one-dimensional indicators cannot give you.


Two strategy hints to explore

  1. Reversion at the band. Try the m15 and m5 timeframe: when price tags the 2.0 standard-deviation VWAP band, watch for a CVD divergence print, targeting a rotation back to VWAP or the session POC. In our observation, divergences that print inside key Volume Profile zones — the POC, the VAH/VAL boundaries, or a prior session's ledge — are considerably more decisive than those appearing in low-volume gaps.
  2. Continuation at VWAP. Note which side of VWAP price has been accepted on today — where most bars have closed so far. When price stretches away on that side and then returns to VWAP, watch for a reversal print at the line: a CVD divergence back in the accepted direction, or an ET flag against the pullback. The idea is that the accepted side reasserting itself at VWAP is the day's trend defending its average. Treat the print as context for your own timing and exits, not as a mechanical trigger.

Both are research starting points, not trading systems: forward-test them yourself, on your own instruments, spreads and sessions, before risking anything. Past behaviour never guarantees future results.

Don't have time to track your whole watchlist?

Volume Trio Multi is the Pro edition of this indicator. The engine is the same. It alerts you when the stars are aligned for a pair in your watchlist.

If you want to track many pairs at the same time without spending hours watching charts, that is what Multi is built for. The terminal does the watching; you step in only when something actually lines up. And when you do open a chart, more of the profile's history is already drawn for you: where value formed during the session, where it moved, and which levels the market has left unfinished.

What it adds first is a watchlist scanner: the same three-layer logic run across the symbols already in your Market Watch, on a timeframe you choose, with an alert for each of the two strategy hints above — the reversion reading, when a divergence lines up with a sigma-band tag or a key profile zone, and the continuation reading, when the day's accepted side of VWAP defends the line with a divergence in its direction. A dashboard shows every symbol's state at a glance, and clicking a row opens that chart.

Beyond the scanner: composite profiles over the last N sessions or a custom date range, developing POC and Value Area traces with VPOC migration, naked POC tracking, and hover tooltips on every line drawn on the chart.

In short: this free version reads one chart. Multi watches your whole list.

For Multi Version: https://www.mql5.com/en/market/product/188176

This free edition stays free and stays complete. It is not a trial, and nothing here is time-limited or reduced in function.


Built honestly

  • All readings derive from provider-local volume and OHLC — a pressure proxy, not centralized order flow. Markers are context, never buy/sell signals.
  • Fully deterministic on closed bars: reloads and timeframe switches reproduce the identical event history.
  • Auto profiles tuned for 5m / 15m / 30m; graceful manual fallbacks everywhere (nothing silently goes dark).
  • Diagnostics panel exposes the whole engine: every counter, every rejection gate, the full ET state.
  • Three master layer toggles, dark/light auto theme, alert channels (popup / sound / push), English glossary panel.


Quick start

  1. Drop it on a 5m or 15m chart with defaults (Auto profile does the tuning).
  2. Hover the blue VWAP line and its dotted bands — the tooltips introduce themselves.
  3. Turn on the Diagnostics and Glossary panels while you learn the markers, then switch them off.
This tool provides analytical context only and makes no profitability claims.

Trading involves substantial risk; test every idea independently.

Every abbreviation on the chart

Main chart (price window)

Mark Meaning How to read it
POC (gold bar + label) Point of Control — the price level with the highest traded activity of that session's profile The session's strongest "magnet" / acceptance level. Price tends to revisit it.
VAH (green label) Value Area High — upper boundary of the zone holding the configured percent (default 70%) of session activity Above VAH = price trading at a premium vs. the session's accepted value.
VAL (green label) Value Area Low — lower boundary of the same zone Below VAL = price trading at a discount vs. accepted value.
Profile bars (horizontal green/red) Per-price-level activity, split into buying vs. selling pressure by the proxy Long bars = heavy acceptance ("shelves"). Thin gaps = low-volume air pockets price crosses quickly.
Shaded band The Value Area itself The session's "fair" zone between VAH and VAL.
Dotted vertical line Session boundary (Daily / Weekly / Monthly anchor) Each profile is built per session.
Blue line Anchored VWAP — volume-weighted average price since the session anchor The session's volume-fair price. Hover it: a tooltip confirms what it is.
Dotted blue lines VWAP sigma bands — VWAP +/- (multiplier x standard deviation), default 2.0 Statistical stretch. Hover a band: the tooltip shows the exact multiplier.
C +RD / C -RD (green / red) Confirmed Regular Divergence, bullish (+) or bearish (-), confirmed by Standard chart bars Price made a lower low while the pressure index made a higher low (+RD), or a higher high with a lower pressure high (-RD). The connecting line joins the two pivot origins.
M +RD / M -RD The same event confirmed by Micro 5m mode Identical logic; the pivot was validated earlier using a quota of closed 5-minute sub-bars instead of full chart bars.
ET+ (cyan) Exhaustion Trajectory, bullish setup proxy Price kept pressing lower while downside participation faded sharply in the second half of the measured window. Watched as bullish-reaction context.
ET- (orange) Exhaustion Trajectory, bearish setup proxy Price kept pressing higher while upside participation faded. Watched as pullback context.

Every divergence and ET label carries a hover tooltip with the measured span, the price change, the pressure-index change and a plain-language interpretation.


Indicator pane (bottom window)

Element Meaning
Histogram Signed volume-pressure proxy: rolling sum (Periodic) or EMA of the per-bar pressure delta. Green above zero = net buying pressure, red below = net selling pressure.
Muted hues by design so markers stay readable.
Divergence lines + C/M labels The pane mirror of every confirmed divergence, joining the two pressure pivots.
Diagnostics panel (optional, top-right) Live engine state: timeframe/profile, pressure mode, pivot geometry, confirmation mode, structure guard, continuity epochs, pivot/event counters, rejection counters
(E=epoch, S=swing, M=min-separation, Q=micro quota), full ET status, layer toggles.
Glossary panel (optional, top-left) A one-screen reminder of every abbreviation.


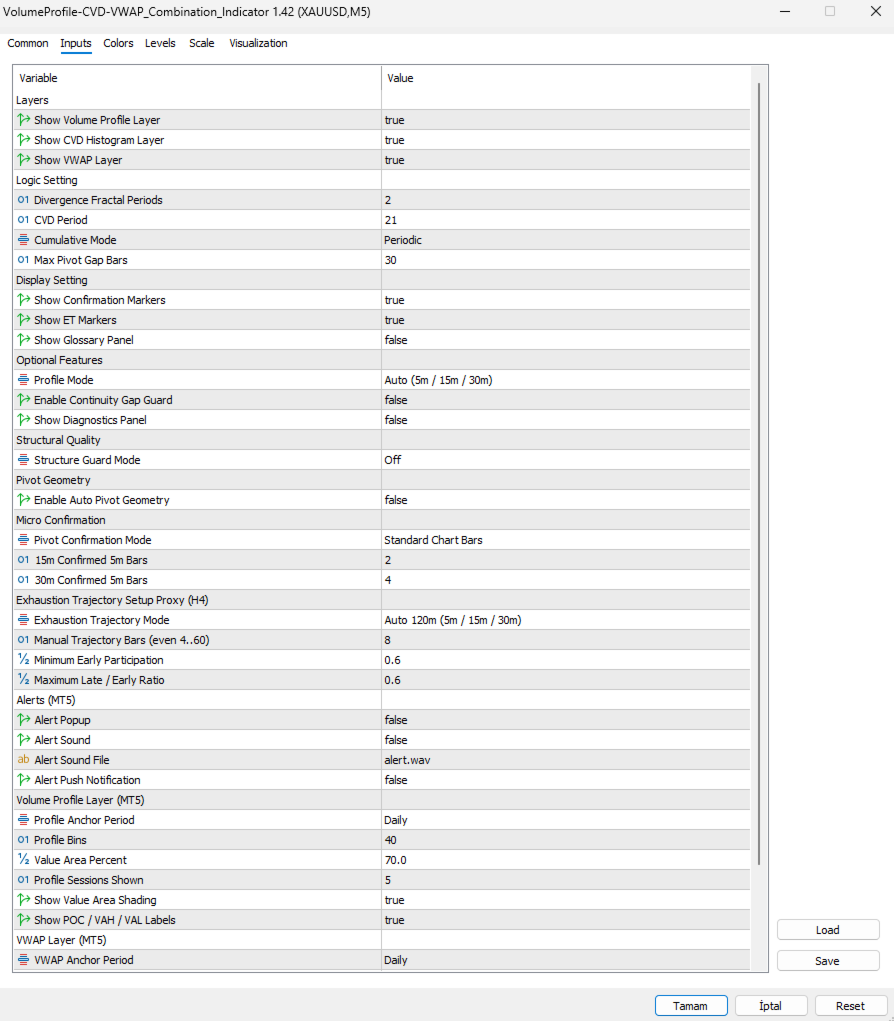
Inputs, group by group

Layers
  • Show Volume Profile / CVD Histogram / VWAP Layer — master switches. The CVD engine keeps computing even when its plot is hidden, so divergences and alerts stay alive.
Logic Setting
  • Divergence Fractal Periods (2) — manual pivot width (left/right bars in Standard mode; left width in Micro mode).
  • CVD Period (21) — window of the pressure histogram (Periodic sum or EMA).
  • Cumulative Mode (Periodic) — Periodic = moving sum of the last P deltas; EMA = exponential average, faster on new bars.
  • Max Pivot Gap Bars (30) — exclusive upper bound for the distance between the two divergence pivots.
Display Setting
  • Show Confirmation Markers (on) — C/M +/-RD labels only; lines, counters and alerts are unaffected.
  • Show ET Markers (on) — ET+/ET- labels only; ET events and alerts continue.
  • Show Glossary Panel (off) — the abbreviation cheat-sheet.
Optional Features
  • Profile Mode (Auto) — on exact 5m/15m/30m charts, P/Trend/Gap auto-set to 63/150/<90, 21/50/<30, 11/25/<15. Elsewhere the Manual values apply.
  • Enable Continuity Gap Guard (off) — rejects pivot pairs separated by a chart-time gap larger than 1.5x the nominal bar; weekend gaps count.
  • Show Diagnostics Panel (off) — the live engine table.
Structural Quality
  • Structure Guard Mode (Off) — optional extra admission rules: Swing Guard (an opposite pivot must sit between the pair), Minimum Separation (gap >= Left + right-footprint + 1), or both.
Pivot Geometry
  • Enable Auto Pivot Geometry (off) — on 5m/15m/30m uses L=4/3/2 with R=2 instead of the manual n/n.
Micro Confirmation
  • Pivot Confirmation Mode (Standard) — Standard = classic right-side chart bars. Micro 5m = the pivot on the previous closed host bar is validated by a quota of closed 5-minute sub-bars, giving an earlier known-time. Only on exact 15m/30m charts; elsewhere it falls back to Standard.
  • 15m / 30m Confirmed 5m Bars (2 / 4) — the closed sub-bar quota. Touching the pivot level exactly is tolerated; a decisive break before the quota completes cancels the candidate.
Exhaustion Trajectory Setup Proxy (H4)
  • Exhaustion Trajectory Mode (Auto 120m) — Auto uses W=24/8/4 bars on 5m/15m/30m; elsewhere the Manual window applies as chart bars.
  • Manual Trajectory Bars (8) — even 4..60; the observation window W. The engine needs 4W bars of clean history (3W calibration + W observation).
  • Minimum Early Participation (0.60) — required early-half intensity, normalized by the prior 3W mean absolute delta.
  • Maximum Late / Early Ratio (0.60) — how much of the early intensity may survive into the late half; lower = stricter fade requirement.
Alerts (MT5)
  • Popup / Sound / Sound File / Push — delivery channels for divergence and ET alerts. All default off; events fire on the live closed bar only.
Volume Profile Layer
  • Profile Anchor Period (Daily), Profile Bins (40), Value Area Percent (70), Profile Sessions Shown (5), Show Value Area Shading (on), Show POC / VAH / VAL Labels (on).
VWAP Layer
  • VWAP Anchor Period (Daily), Show VWAP Sigma Bands (on), VWAP Band Multiplier (2.0).
Appearance
  • Color Theme (Auto — follows the chart background), Max Drawn
  • Divergences (150 — older drawings are pruned; counters keep the truth).


Practical notes

  • Load on m15 or m5 with defaults for the tuned experience (Auto profile). Micro 5m mode requires M5 history; the indicator retries automatically while the terminal downloads it.
  • Open the Diagnostics panel whenever something looks quiet — the rejection counters tell you exactly which gate is filtering candidates.
  • The engine is fully deterministic on closed bars: scrolling back, reloading or switching timeframes reproduces the identical event history.

推荐产品
Value Chart Candlesticks
Flavio Javier Jarabeck
4.57 (14)
The idea of a Value Chart indicator was presented in the very good book I read back in 2020 , " Dynamic Trading Indicators: Winning with Value Charts and Price Action Profile ", from the authors Mark Helweg and David Stendahl. The idea is simple and the result is pure genius: Present candlestick Price analysis in a detrended way! HOW TO READ THIS INDICATOR Look for Overbought and Oversold levels. Of course, you will need to test the settings a lot to find the "correct" one for your approach. It
FREE
Daily High Low Danilo Monteiro
Danilo Hudson Couto Monteiro
4 (2)
# Indicador Daily High - Danilo Monteiro - MT5 ## Descrição O Daily High/Low Labels é um indicador personalizado para MetaTrader 5 que exibe automaticamente as máximas e mínimas diárias no gráfico, facilitando a identificação rápida dos níveis importantes de preço. O indicador marca os preços com etiquetas e linhas horizontais, permitindo uma visualização clara dos níveis críticos do dia atual e anterior. ## Principais Características ### 1. Marcação Automática - Exibe automaticamente as máxi
FREE
LT Donchian Channel
Thiago Duarte
4.86 (7)
Donchian Channel is an indicator created by Richard Donchian. It is formed by taking the highest high and the lowest low of the last specified period in candles. The area between high and low is the channel for the chosen period. Its configuration is simple. It is possible to have the average between the upper and lower lines, plus you have alerts when price hits one side. If you have any questions or find any bugs, please contact me. Enjoy!
FREE
Institutional Tick Engine Lite: Tick 速度与反转分析工具 Institutional Tick Engine Lite 是一款技术指标,旨在利用原始 Tick 数据分析市场速度 (Velocity) 和微观结构逻辑。作为专业市场分析套件的入门版本,它处理实时 Tick 数据,为剥头皮和日内交易提供指标,替代传统的滞后指标。 包含的功能 Tick 速度监控: 显示 "每秒 Tick 数" (TPS) 的实时直方图。有助于识别缓慢的市场漂移与强劲的动量移动之间的区别。 反转信号 (Lite): 基于微观结构耗尽识别高概率反转点 (每天限制 20 个信号)。 信息面板: 实时仪表板,显示当前的点差、Delta 和速度指标。 优化性能: 轻量级代码,不会降低终端运行速度。 技术限制 (Lite vs Pro) 与 Pro 版本相比,此版本有以下限制: 流动性热力图 (Heatmap): 合成市场深度可视化已禁用。 音频助手: "盖革计数器" 模式和音频警报已锁定。 信号限制: 反转信号上限为每天 20 个 (Pro 版本无限制)。 数据导出: 无法将 Tic
FREE
YKL Regressao Intraday
Ygor Keller Luccas
Indicador Regressão Linear – Par de Ativos - INTRADAY Indicador é um oscilador que faz o plot do Resíduo resultado da regressão linear entre os dois ativos inseridos como input do indicador, representado pela fórmula: Y = aX + b + R Onde Y é o valor do ativo dependente, X é o valor do ativo independente, a é a inclinação da reta entre os dois ativos, b é a intersecção da reta e R é o resíduo. O resíduo representa a quantidade da variabilidade que Y que o modelo ajustado não consegue explicar. E
FREE
MIDAS Super VWAP
Flavio Javier Jarabeck
4.27 (11)
Imagine VWAP, MVWAP and MIDAS in one place... Well, you found it! Now you can track the movement of Big Players in various ways, as they in general pursue the benchmarks related to this measuring, gauging if they had good execution or poor execution on their orders. Traders and analysts use the VWAP to eliminate the noise that occurs throughout the day, so they can measure what prices buyers and sellers are really trading. VWAP gives traders insight into how a stock trades for that day and deter
FREE
Follow The Line MT5
Oliver Gideon Amofa Appiah
4.6 (35)
This indicator obeys the popular maxim that: "THE TREND IS YOUR FRIEND" It paints a GREEN line for BUY and also paints a RED line for SELL. (you can change the colors). It gives alarms and alerts of all kinds. IT DOES NOT REPAINT and can be used for all currency pairs and timeframes. Yes, as easy and simple as that. Even a newbie can use it to make great and reliable trades. NB: For best results, get my other premium indicators for more powerful and reliable signals. Get them here: https://www.m
FREE
Heiken Ashi Smoothwave
Alexandre Vincent Traber
概述 Heiken Ashi Smoothwave 将您的图表直接转换为平滑的平均K线(Heiken Ashi),并在主图表窗口中替代标准K线,呈现更清晰的趋势视图。无需单独窗口,界面简洁。 工作原理 每根K线根据真实价格数据计算 Heiken Ashi 的开高低收值。 直接在主图表上绘制彩色 Heiken Ashi K线。 自动隐藏原生图表K线,仅显示 Heiken Ashi K线。 移除指标时自动恢复标准K线。 输入参数 无可配置参数,添加即可使用。 推荐设置 适用于任何交易品种、任何时间周期。可在外汇、黄金、指数及MetaTrader 5支持的任何品种上使用。 截图 应用 Heiken Ashi Smoothwave 后的图表,原生K线已自动隐藏。 免责声明 本指标为趋势分析的可视化工具,并非交易信号生成器。过往表现及视觉平滑效果不保证未来结果。使用真实账户前请务必先在模拟账户上测试。
FREE
Girassol Sunflower MT5 Indicator
Saullo De Oliveira Pacheco
3.86 (7)
This is the famous Sunflower indicator for Metatrader5. This indicator marks possible tops and bottoms on price charts. The indicator identifies tops and bottoms in the asset's price history, keep in mind that the current sunflower of the last candle repaints, as it is not possible to identify a top until the market reverses and it is also not possible to identify a bottom without the market stop falling and start rising. If you are looking for a professional programmer for Metatrader5, please
FREE
VWAP and MVWAP
Flavio Javier Jarabeck
4 (9)
Volume Weighted Average Price (VWAP) is a trading benchmark commonly used by Big Players that gives the average price a Symbol has traded throughout the day. It is based on both Volume and price. Additionally we put in this indicator the MVWAP (Moving Volume Weighted Average Price). For those who do not know the usage and the importance od this indicator I recommend a great article about this subject at Investopedia ( https://www.investopedia.com/articles/trading/11/trading-with-vwap-mvwap.asp )
FREE
Stackable VWAP
Flavio Javier Jarabeck
3.5 (4)
Volume Weighted Average Price (VWAP) is a trading benchmark commonly used by Big Players that gives the average price a Symbol has traded throughout the day. It is based on both Volume and price. Additionally we put in this indicator the MVWAP (Moving Volume Weighted Average Price). For those who do not know the usage and the importance od this indicator I recommend a great article about this subject at Investopedia ( https://www.investopedia.com/articles/trading/11/trading-with-vwap-mvwap.asp
FREE
Donchian Breakout And Rsi
Mattia Impicciatore
4.5 (2)
概述 本指标是经典 Donchian 通道 的增强版,增加了多种实用的交易功能。 除了标准的三条线(最高、最低和中线),系统能够检测 突破 ,并在图表上用箭头进行可视化标记,同时只显示 与当前趋势方向相反的那条线 ,让图表更加简洁。 功能包括: 可视化信号 :突破时在图表上绘制彩色箭头 自动通知 :弹窗、Push 推送和 Email 邮件 RSI 过滤 :根据市场相对强弱验证信号 个性化设置 :颜色、线条粗细、箭头符号、RSI 阈值等 工作原理 Donchian 通道计算: 上轨线 :最近 N 根已收盘 K 线的最高价 下轨线 :最近 N 根已收盘 K 线的最低价 中线 :最高价和最低价的平均值 看涨突破 :收盘价高于上轨线 看跌突破 :收盘价低于下轨线 指标会: 绘制三条 Donchian 通道线 仅在 方向变化后的首次突破 绘制箭头 隐藏顺应趋势方向的那条线(上涨趋势: 只显示红色下轨线;下跌趋势: 只显示绿色上轨线) 可选用 RSI 过滤突破信号,减少虚假突破 支持实时发送通知 参数说明 Donchian 通道设置 indPeriod :计算通道高低点的已收盘 K 线数量 Lin
FREE
Phoenix Delta Volume
Nigel Nii Darku Narnor Darko
5 (1)
This is the Phoenix Institutional SMC Dashboard (Emerald-Teal Edition). It is engineered to provide retail traders with the same "Volume-at-Price" clarity used by institutional desks. Below is a full breakdown of the benefits, the high-confluence logic for entries, and how to manage your trades using the current visual engine. Strategic Benefits to the User Sentiment over Price: Most indicators only look at where the price is. This dashboard tells you how much effort (Volume Delta) was required
FREE
Support and Ressistance
Raphael Lorenz Baumgartner
上一日支撑与阻力 平台: MetaTrader 5 类型: 自定义指标 显示位置: 图表窗口(叠加) 功能: 根据前一天的最高价和最低价计算 支撑与阻力区域 。 使用滑动窗口 ( SampleWindowSize ) 分析近期价格区间。 当当前价格区间显著低于前高时,标记为 潜在支撑区 。 当价格区间高于前低时,标记为 潜在阻力区 。 输出 4 个结果: LDResistanceHigh – 阻力顶部 LDResistanceLow – 阻力底部 LDSupportHigh – 支撑顶部 LDSupportLow – 支撑底部 输入参数: SampleWindowSize (默认值:10) 用于识别小范围价格区间的K线数量。 输出值: LDResistanceHigh / LDResistanceLow 显示潜在的阻力区间。 LDSupportHigh / LDSupportLow 显示潜在的支撑区间。
FREE
Waves Sizer
Flavio Javier Jarabeck
3.86 (7)
Wyckoff fans, enjoy! Ideally to be used with the Weis Waves indicator, but it can be easily used alone, the Waves Sizer puts the range (in resulting Price movement) done by the Price on its market swings. You can control how accurate or loose will be the swings. This tool is very helpful for visually know how much the Price has traveled in your Timeframe. This way you can confront this level of effort with the resulting Volume, etc... Weis Waves indicator: https://www.mql5.com/en/market/produc
FREE
Super Trend eu
Emin Ulucanli
4.83 (6)
SUPERTREND; It is a trend following indicator based on the SuperTrend ATR created by Olivier Seban. It can be used to detect changes in trend direction and locate stops. When the price falls below the indicator curve, it turns red and indicates a downtrend. Conversely, when the price moves above the curve, the indicator turns green, indicating an uptrend. Like other indicators, it works well on SuperTrend when used in conjunction with other indicators such as MACD, parabolik SAR, Bollinger Band
FREE
Dual RSI
Paul Conrad Carlson
3.5 (2)
Indicator alerts for Dual Relative strength index rsi. Large rsi preset at 14 is below 30 small rsi preset at 4 is below 10 for buy bullish signals . Large rsi preset are 14 is above 70 small rsi preset at 4 is above 90 for sell bearish signals . Includes mobile and terminal alerts. draws lines when alerts. This indicator can help identify extremes and then the tops or bottoms of those extremes .
FREE
RaysFX Pattern Detector è uno strumento di analisi tecnica all'avanguardia progettato per i trader che basano le loro decisioni sull'azione dei prezzi (Price Action). Questo indicatore scannerizza automaticamente il grafico in tempo reale per identificare e segnalare i pattern candlestick più affidabili e noti, eliminando il lavoro manuale e aiutandoti a non perdere mai un'opportunità di trading. Che tu sia un trader discrezionale, un principiante che sta imparando a riconoscere le candele, o un
FREE
VWAP Indicator
LUC JACOBUS A VERHEECKE
4.11 (27)
Volume Weighted Average Price (VWAP) The volume weighted average price (VWAP) is a  trading   benchmark  used by traders that gives the average price a security has traded at throughout the day, based on both volume and price. It is important because it provides traders with insight into both the trend and value of a security. This indicator VWAP V2 is free and is the manual version of the extended Easy VWAP indicator (30 Euro), where the date and time properties are automatically entered. With
FREE
Renko subwindow
Alexandre Vincent Traber
Overview Renko SubWindow 在独立的指标窗口中以彩色蜡烛显示Renko砖块图,不影响主图 表。砖块大小可设置为固定点数,也可根据ATR动态计算,实现基于波动性的 自适应砖块。 How it works 根据当前品种/周期的收盘价重建Renko砖块。 当价格相对上一砖块收盘价超过设定的砖块大小时,形成新砖块。 砖块以彩色蜡烛显示:上涨与下跌颜色区分明显。 仅在新K线形成或周期/历史数据变化时重新计算,保持指标轻量稳定。 Inputs Renko_BrickPoints: 固定砖块大小(点数);设为0则使用ATR Renko_ATR_Period: BrickPoints为0时使用的ATR周期 Renko_MaxBricks: 窗口中显示的最大砖块数量 Recommended setup 适用于任何品种和周期。对于外汇主要 货币对,50-150点的砖块大小是不错 的起点;对于黄金/白银或指数,建议使用ATR模式以适应波 动性。 Screenshots 默认设置下 的实盘图表示例,以及输入参数面板截图。 Disclaimer 本指标仅为可视化/分析工具,不进 行任何交
FREE
高级趋势输入专家 TZ Trade Logics向您展示高级趋势输入的增强版 此版本通过趋势过滤和高级信号输入时序的高级功能为您带来更加轻松的交易状态。 对我们而言,重要的不是创造产品!但继续对用户进行维护和培训。通过我们专用的联系方式,您将获得有关如何使用产品以及与交易有关的其他相关培训的密切指导。 该交易系统已实施了二维趋势过滤机制,以确保您的交易处于趋势方向上,我们正在继续进行实验 免责声明! Tz Trade Logics没有市场走势的所有权,因此,我们不保证所有信号都将朝预期的方向发展。因此,考虑到这一点,建议您使用适当的资金管理,止损和获利 另外,请通过单击信号中的链接与我们联系,以便能够接收此交易系统的培训时间表 欢迎。 产品特点 1.该系统开箱即用,可在每种交易工具上使用 2.准备发送推送通知,声音和桌面警报,以帮助忙碌的交易 3.您可以在云计算机/ VPS上使用系统 4.绘制所有需要的图形以方便您使用(除了箭头以外,还可以用于一些培训目的) 5.在设置中有“策略选择”部分,您可以在其中选择最适合自己的策略 策略 由于与各种
FREE
Prometheus Analyst
Humphrey Mangera
PROMETHEUS TECHNICAN VERSION Free | By THE SONS A gift from The Sons — no strings, no trial, no expiry. Every trader deserves access to professional-grade market intelligence. That belief is why Prometheus Technical Version exists, and why it costs nothing. Consider it our handshake to the trading community. What You're Getting This is not a simplified tool dressed up as a gift. Prometheus Technican Version is a fully built, institutional-quality technical analysis indicator running a dual-model
FREE
Basic Vwap
james mugendi
4 (1)
Simple Vwap with the daily, weekly and monthly VWAP is the abbreviation for   volume-weighted average price , which is a technical analysis tool that shows the ratio of an asset's price to its total trade volume. It provides traders and investors with a measure of the average price at which a stock is traded over a given period of time. How it's used Identify entry and exit points:   Traders can use VWAP to determine when to buy or sell an asset.   Understand price trends :  Traders can use V
FREE
DS RVOL: The Relative Volume Indicator for MT5 RVOL is a straightforward Relative Volume (RVOL) indicator for MetaTrader 5. It shows you how current volume compares to a historical average, providing a quick way to gauge the strength of a price move. How it Works Relative Volume is a simple ratio: R V O L = C u rre n t V o l u m e ​/ A v er a g e H i s t or i c a l V o l u m e RVOL > 1.0 : Volume is higher than usual. This suggests there's strong interest and potential for a sustained move. RVOL
FREE
Wave Box Market Frenquency
Jean Jacques Huve Ribeiro
4.75 (4)
Totally linked to the result of a movement and the duration he had. Its height records how many ticks the asset walked during a given movement, its width shows us the duration that movement had. Its configuration must be in line with the Weis Wave Indicator configuration to observe the movement force and can indicate a possible accumulation or distribution of the movement;
FREE
Weis Wave Scouter Basic
Jean Carlos Martins Roso
5 (1)
Weis Wave Scouter Basic 是我们著名的 MetaTrader 5 指标的基础版本,专为希望以简便高效方式探索 Wyckoff 方法和 VSA(成交量价差分析)概念的交易者设计。基于对成交量波动的读取,这款简化版指标可以清晰地识别市场走势,聚焦于努力与结果、供求关系等关键原则,正如 Richard Wyckoff 所教授的那样。 使用 Weis Wave Scouter Basic,您可以通过直观的直方图查看上涨和下跌的波动,提供经典主题色彩(Classic),方便趋势和反转的解释。指标支持基本参数调整,如 Brick Size 和 Volume Scale Factor,并提供选择使用 tick 量或真实成交量的功能,使其适用于外汇、股票和加密货币等多种市场。非常适合初学者或寻找直接工具的交易者,Weis Wave Scouter Basic 是将 Wyckoff 和 VSA 技术应用于交易的理想起点。 立即使用 Weis Wave Scouter Basic 掌握成交量分析,提升您的市场表现。
FREE
VWAP + Volume Profile Combined Indicator FREE Launch Offer OVERVIEW Professional combination of VWAP (Volume Weighted Average Price)  and Volume Profile in a single MT5 indicator. This powerful tool  combines two of the most respected institutional trading tools  into one seamless display. KEY FEATURES 1. VWAP with 6 calculation modes 2. Volume Profile with Value Area analysis 3. Point of Control identification 4. Standard deviation bands 5. Dynamic color changing 6. Separate buy/sell vol
FREE
Swiss VWAPsimple
Terence Gronowski
4.8 (5)
Swiss VWAPsimple Motivation Did not find free VWAP that works, the one that I found craseh. So I created a VWAP which calculates values only for the actual day. So computer resouces are not over stressed. What is VWAP, how is it used?  VWAP stands for Volume Weighed Average Price, it calculates the running sum of tick volume and the runnung sum of price times tickvolume. The division of these sums result in a weighed price (Sum P*V/Sum V). The calculation starts normally at midnight. The values
FREE
VolumeBasedColorsBars
Henrique Magalhaes Lopes
VolumeBasedColorsBars — Free Powerful Volume Analysis for All Traders Unlock the hidden story behind every price bar! VolumeBasedColorsBars is a professional-grade, 100% FREE indicator that colorizes your chart candles based on real, adaptive volume analysis. Instantly spot surges in market activity, identify exhaustion, and catch the moves that matter. This indicator gives you:    • Dynamic color-coded bars for instant volume context    • Adaptive thresholds based on historical, session-awar
FREE
Tabajara V5
Flavio Javier Jarabeck
4.84 (37)
Metatrader 5 version of the famous Andre Machado's Tabajara indicator. If you don't know Andre Machado's Technical Analysis work you don't need this indicator... For those who need it and for those several friend traders who asked this porting from other platforms, here it is... FEATURES 8-period Moving Average 20-period Moving Average 50-period Moving Average 200-period Moving Average Colored candles according to the inflexion of the 20-period MA SETTINGS You can change the Period of all MA's
FREE
该产品的买家也购买
本产品已针对 2026 年市场进行更新,并针对最新 MT5 版本进行了优化。 价格更新通知: Smart Trend Trading System 目前价格为 $99 。 接下来的 30 次购买 后,价格将上涨至 $199 。 特别优惠: 购买 Smart Trend Trading System 后,请发送私信给我,即可免费领取 Smart Universal EA ,并将您的 Smart Trend 信号转换为自动交易。 Smart Trend Trading System 是一套完整的交易系统,具备不重绘、不回绘、不延迟的特点,专为希望获得更清晰信号、更准确趋势方向以及更有组织交易方式的交易者打造。 Learn Smart Trend Trading System Everything you need to learn, install, and use the product is available here: Online Course:   https://www.mql5.com/en/blogs/post/757466 Visual User Manual — B
Trend Sniper X
Sarvarbek Abduvoxobov
4.88 (32)
Trend Sniper X 是一款适用于 MetaTrader 5 的多周期趋势跟踪指标,可帮助交易者清晰精准地识别趋势方向和潜在的反转点。 适用于 MT4: https://www.mql5.com/en/market/product/193245 价格信息: 当前价格为促销价,随着后续更新和新功能的推出,价格可能会有所变动。 赠品优惠: 购买后联系作者,即可免费获取该指标的 Auto-Trade Assistant EA(自动交易助手 EA)。 Code2Profit 频道 通过多时间框架分析掌控市场! 如何使用 Trend Sniper X 最大化您的胜率:核心规则与交易时段技巧 技术规格 平台 MetaTrader 5 指标类型 多时间周期趋势指标 运行时间周期 任何图表时间周期,可独立选择更高的时间周期 (M1–MN1) 主要交易品种 外汇、黄金 (XAUUSD) 及其他差价合约 (CFD) 推荐账户 任何账户类型 可视化 彩色趋势蜡烛 (买入/卖出/微弱/变化) + 买入/卖出箭头 附加模块 交易时段方框 (悉尼、东京、伦敦、纽约) 主要功能 多时间周期趋势分析: 直接在
SMC Intraday Formula
Kareem Abbas
5 (23)
让我们先坦诚一点。 没有任何一个指标可以单独让你实现盈利。如果有人告诉你可以,那他是在向你兜售一个梦想。任何显示完美买卖箭头的指标都可以被做得看起来毫无瑕疵——只需要放大历史中的某一段并截取成功交易的截图。我们不会这样做。 SMC Intraday Formula 是一个工具。 它为你读取市场结构,标记出概率最高的价格区域,并用简单直白的语言准确告诉你当前智能资金的行为轨迹。你仍然需要做决定。你仍然需要执行交易。但现在,你是带着精确性执行,而不是靠希望。 我们已经在黄金(XAUUSD)以及主要外汇货币对的日内剥头皮交易中使用该指标将近三年。这是我们在 M1、M5、M15 和 M30 上的日常主力工具。它之所以有效,是因为它不试图预测未来——它展示的是当前正在形成的高概率交易机会,并解释 为什么 。 它与其他所有指标有什么不同? 大多数交易指标只做一件事。移动平均线交叉。振荡指标触及某个水平。出现一个箭头。你进场交易。你亏损。你责怪指标。重复。 SMC Intraday Formula 将多个机构级概念整合为一个统一的市场解读: - 斐波那契共振引擎 不只是普通的斐波那契水平——该指标
Neuro Poseidon MT5
Daria Rezueva
4.79 (53)
Neuro Poseidon is a new indicator by Daria Rezueva. It combines precise trading signals with adaptive TP/SL levels - creating best possible trades as a result! Message me and get  Neuro Poseidon Assistant  as a gift to automize your trading process! What makes it stand out? 1. Proven profitability on all assets and timeframes 2. Only confirmed BUY and SELL signals present on the chart 3. Adaptive TP & SL levels generated by the software for each trade 4. Easy to understand - suitable for al
SuperScalp Pro
Van Minh Nguyen
4.63 (32)
SuperScalp Pro - Professional Multi-Layer Confluence Scalping System SuperScalp Pro 是一款高级剥头皮交易指标,在经典 Supertrend 的基础上加入了多个智能确认过滤器。它可以帮助您识别概率更高的 Buy/Sell 交易机会,同时显著减少虚假信号。 清晰的 Buy 和 Sell 箭头会直接显示在图表上,基于 ATR 的 Stop Loss 和 Take Profit 水平会实时自动计算。 购买后,请联系我获取设置指导和推荐配置。 使用 SuperScalp Pro Auto Trader 轻松实现信号自动化: [Auto Trader] 下载推荐设置文件: [Set File] 完整文档请参阅产品博客: [User Guide] 加入官方频道获取最新更新: [Official Channel] SuperScalp Pro 如何工作? 只有当多个确认层同时一致时,指标才会生成交易信号(趋势 + 动能 + 成交量 + 波动率)。 您可以手动交易,也可以连接 SuperScalp Pro Auto Tr
Welcome to ENTRY IN THE ZONE AND SMC MULTI TIMEFRAME Entry In The Zone and SMC Multi Timeframe is a real-time market analysis tool based on Smart Money Concepts (SMC), designed to analyze market structure, price direction, and key trading zones. It supports both Single-Timeframe Analysis and Multi-Timeframe Analysis, providing a clearer view of the overall market structure across multiple timeframes, with real-time BUY / SELL signals that do not repaint. It is designed to help filter trading opp
Zoryk Gold
Reda El Koutbane
5 (7)
折扣将在 24 小时后结束——下一价格为 69 美元 ZORYK — MetaTrader 5 专用高级 XAUUSD 黄金信号系统 你一定熟悉这种感觉。 你花了很多时间分析黄金,等待合适的入场机会。终于开仓后,价格却立刻朝相反方向移动。你过早平仓、移动止损,或者只犹豫了几秒钟。随后,市场却在没有你的情况下到达了你原本预期的目标。 问题并不总是方向判断错误。 真正的问题是缺乏确定性。 你不知道准确的入场位置在哪里。 你不知道什么时候交易逻辑已经失效。 你不知道应该先锁定较近的利润,还是继续等待更大的行情。 你也不知道当前信号是否足够强,还是自己只是在强行寻找交易机会。 黄金市场变化非常快。一个没有明确计划的好想法,可能在几秒钟内变成错误的交易决定。 ZORYK 正是为了解决这个问题而开发。 什么是 ZORYK ZORYK 是一套完整的 XAUUSD 黄金信号与交易计划系统,专门为 MetaTrader 5  和 M5 时间周期 开发。 它不是一个只显示 BUY 或 SELL 箭头,然后让你独自决定其余所有内容的简单指标。 每个确认后的信号都可以在图表上显示完整的可视化交易计划,包
GoldenX Entry MT5
Kareem Abbas
5 (16)
GoldenX Entry 是一款用于 MT5 的指标,包含自适应 Smart Entry Trend 算法、信号评分系统、市场状态识别器以及波动率过滤器。每个信号都包含计算得出的入场位、三个止盈位(TP1、TP2、TP3)以及止损位。它基于多个分析层构建,旨在适应不同市场条件,将多层分析系统与内置优化器及统计跟踪系统相结合。该指标基于风险收益比(RR)指标和历史交易行为提供量化分析。 开始使用非常简单——在所选时间周期上运行优化器,然后在图表上开始使用该指标。 核心功能 GoldenX Entry 将信号引擎与内置交易管理及历史统计跟踪整合在同一图表中: - 内置优化器: 优化器可在图表上单击运行。它通过两阶段搜索流程测试200种参数组合——先进行探索,再进行优化——并在完成后自动应用选定配置。结果会按时间周期缓存,因此当返回已优化的周期时,会立即恢复相同设置。 - 黄金品种自动周期识别: 将指标加载到任何 XAUUSD 图表(M1 到月线)。系统会自动识别当前周期并加载对应预设。共包含9个时间周期配置文件,专为黄金在标准周期上优化设计。切换周期时,参数会自动调整。 - 资金参考面
Unix Scalper
Issam Kassas
UNIX Scalper — Gold Scalping Indicator for MetaTrader 5 UNIX Scalper is a focused Gold scalping indicator designed primarily for XAUUSD on M1, M2, M3, M5, M10 and M15. It gives the trader a clear BUY, SELL or WAIT decision together with the complete trade plan: Entry, Stop Loss, TP1 and TP2 . The concept is simple: wait for the signal, follow the levels, move the Stop Loss to Break Even after TP1, and trade with discipline. Learn UNIX Scalper Everything you need to learn and use the product is
Reversion King Indicator
Eugen-alexandru Zibileanu
5 (7)
全新王者降临 - 指标 + 订单管理提示(TP1 + TP2 + TP3)+ 可选 Telegram 信号发送器 INCLUDED(免费) (完整交易与信号系统) 我们最强的黄金 EA: Gold Slayer 该指标包含先进的交易策略、可自定义订单管理系统,以及结合 Envelope 扩展的均值回归系统,并通过 RSI 等多重智能确认过滤器进行验证,以捕捉高概率反转入场机会,提供 BUY 与 SELL 信号。 你不仅能够学习如何交易,还能学会如何高效管理多个仓位,并利用之前盈利的持仓来覆盖亏损交易。 专为 M5 周期打造并优化,在 BTCUSD 和 XAUUSD 上表现尤为出色,因为这些市场的流动性能够让信号更加干净、可靠。 该指标会自动生成清晰的多头(Long)与空头(Short)信号,同时基于 ATR 自动计算入场位、止损位和止盈位,让风险管理从一开始就融入系统之中。 多 TP 系统设有三个渐进式目标位,你可以在 TP1 锁定部分利润、在 TP2 继续持仓,并在更大的行情中将仓位持有至 TP3,而这正是平均风险回报比真正开始大放异彩的地方。 默认参数开箱即用,已经针对稳定表现进行
UZFX {SSS} 超短线智能信号 v5.0 MT5 是一款无重绘的高性能交易指标,专为在快速波动的市场中需要精准、实时信号的超短线交易者、日内交易者和波段交易者设计。该指标由 (UZFX-LABS) 开发,融合了价格行为分析、趋势确认和智能过滤技术,可在所有货币对和时间周期内生成高概率的买卖信号、预警信号以及趋势延续机会。 别再对交易犹豫不决了,开始遵循这一专为追求清晰、精准和纪律性市场执行的交易者设计的结构化信号系统吧。 相信我,这是 MQL5 上最优秀的指标之一,所以千万不要错过!!“为睿智交易者打造的智能信号” 最新 5.0 版本现已发布,价格可能会在未事先通知的情况下上涨至 499.99 美元,所以请尽快入手,以免错失良机!! 最终购买前!如果您想获取免费试用版,请通过 WhatsApp 号码 +923030751987 联系我!! 如果您遇到任何问题“或”有任何不明白的地方,请在私聊中向我咨询!!! 主要功能更新 • 自动买入和卖出信号检测 • 先进的反转识别逻辑 • 潜在市场反转前的预警信号 • 趋势延续确认信号 • 内置风险管理功能,包含入场点、止损点、TP1、
Atomic Analyst MT5
Issam Kassas
4.45 (55)
本产品已针对 2026 年市场进行更新,并针对最新 MT5 版本进行了优化。 价格更新通知: Atomic Analyst 目前价格为 $99 。 接下来的 30 次购买 后,价格将上涨至 $199 。 特别优惠: 购买 Atomic Analyst 后,请发送私信给我,即可免费领取 Smart Universal EA ,并将您的 Atomic Analyst 信号转换为自动交易。 Atomic Analyst 是一款不重绘、不回绘、不延迟的 Price Action 交易指标,专为手动交易、清晰信号和 EA 自动化而设计。 User manual: settings, inputs and strategy.   &   User Manual PDF . 它分析价格行为、强度、动能、多周期方向和高级过滤器,帮助交易者减少噪音,避免弱势交易机会,并做出更有结构的交易决策。 该指标将复杂的市场计算转换为简单的视觉信号、彩色K线、趋势读数、止损水平和多个止盈区域,使交易者能够快速理解并应用于真实市场环境。 主要交易用途: 剥头皮和日内交易: 专为快速决策、清晰箭头、提醒、K线颜色和
M1 Sniper MT5
Oleg Rodin
5 (7)
M1 SNIPER   是一款易于使用的交易指标系统。它是一个专为 M1 时间框架设计的箭头指标。该指标可以作为独立的系统在 M1 时间框架下进行剥头皮交易,也可以作为您现有交易系统的一部分使用。虽然该交易系统专为 M1 时间框架交易而设计,但它也可以用于其他时间框架。我最初设计此方法是为了交易 XAUUSD 和 BTCUSD。但我发现这种方法在其他市场交易中也同样有用。 指标信号既可以顺势交易,也可以逆势交易。我教授一种特殊的交易技巧,帮助您利用指标信号进行双向交易。该方法基于使用特殊的动态支撑位和阻力位区域。 购买后,您可以立即下载 M1 SNIPER 箭头指标。此外,我还为所有 M1 SNIPER 工具用户免费提供下方屏幕截图所示的 Apollo Dynamic SR 指标!这两个指标的组合可以帮助您更轻松、更准确地利用 M1 时间框架进行交易。 购买后请联系我,免费获取交易提示和奖励指标! 祝您交易成功!
Gold Entry Sniper
Tahir Mehmood
5 (19)
Gold Entry Sniper – 专业多周期ATR黄金交易仪表盘,适合黄金剥头皮与波段交易 Gold Entry Sniper 是一款先进的 MetaTrader 5 指标,旨在为 XAUUSD 及其他品种提供精准的 买/卖信号 。基于 ATR 移动止损逻辑 和 多周期分析仪表盘 ,适合剥头皮交易者与波段交易者,帮助识别 高概率黄金入场点 。 主要功能与优势 多周期信号分析 – 同时显示 M1、M5、M15 趋势方向。 基于ATR的动态止损 – 根据波动性自动调整。 专业图表仪表盘 – 展示信号状态、ATR水平、线性回归中线和交易方向。 清晰买卖标记 – 自动箭头与文字标签提示。 离场提示与交易管理 – 自动检测离场信号锁定利润。 全面自定义 – 调整仪表盘位置、颜色、字体及参数。 专为黄金优化 – 适用于 M1至M15 黄金剥头皮 ,也适合外汇、指数与加密货币。 为什么选择 Gold Entry Sniper? 为追求 快速、精准、可视化交易决策 的交易者打造,ATR 与多周期确认结合,帮助你抓住 最佳黄金入场点
Gann Made Easy MT5
Oleg Rodin
5 (10)
Gann Made Easy   是一个专业且易于使用的外汇交易系统,它基于使用先生理论的最佳交易原则。 W.D.江恩。该指标提供准确的买入和卖出信号,包括止损和获利水平。您甚至可以使用推送通知在旅途中进行交易。 购买后请联系我,即可免费获得交易指导和超棒的额外指标! 您可能已经多次听说过江恩交易方法。通常 Gann 的理论不仅对于新手交易者而且对于那些已经有一定交易经验的人来说都是非常复杂的东西。这是因为江恩的交易方法在理论上并不那么容易应用。我花了几年时间来完善这些知识,并将最好的原则应用到我的外汇指标中。 该指标非常易于应用。您所需要的只是将其附加到您的图表并遵循简单的交易建议。该指标不断进行市场分析工作并寻找交易机会。当它检测到一个好的入口点时,它会为您提供一个箭头信号。该指标还显示止损和获利水平。 换句话说,当您像先生一样进行交易时,该指标会为您提供最佳江恩建议。江恩亲自告诉你此时此刻该做什么。但最好的部分是您不需要了解任何有关江恩交易原则的知识,因为该指标会为您完成整个市场分析工作。
ATstrong
Zaha Feiz
ATSTRONG PRO: 市场结构与突破指标 突破检测引擎 | 5个动态TP目标 | 实时仪表板面板 | 不重绘 首发价格 当前价格: $59 — 每售出10份价格增加$10。 ATSTRONG PRO 是一款专为 MetaTrader 5 设计的高级突破和机构市场结构指标。 它能够检测高概率波段枢轴,识别集群的支撑和阻力堆积区,并实时发送结构破坏(BOS)和特征改变(CHoCH)信号。 该指标会自动在您的图表上绘制动态止损和5个不同的止盈水平(TP1到TP5), 并配有风险回报预测框、星级信号质量评级以及图表上的实时绩效分析仪表板。 交易提示: 这是一款用于手动交易和市场分析的指标。它在K线收盘时显示清晰的视觉信号、水平和警报,并且 完全不重绘 。它不执行自动交易。 核心亮点与特性 智能突破引擎: 同时检测集群水平区域突破和单波段枢轴突破(BOS / CHoCH)。 突破强度评分: 评估动能、成交量/K线实体大小和枢轴质量,以过滤虚假突破和诱多/诱空。 5阶段止盈水平: 预测可自定义的R倍数目标(TP1: 0.5R, TP2: 1.0R, TP3: 1.5R, TP4:
货币强度向导是一个非常强大的指标,为您提供成功交易的一体化解决方案。该指标使用多个时间范围内所有货币的数据来计算这个或那个外汇对的力量。此数据以易于使用的货币指数和货币电力线的形式表示,您可以使用它们来查看这种或那种货币的力量。 您所需要的只是将指标附加到您要交易的图表上,该指标将向您显示您交易的货币的真实强度。该指标还向您显示买卖量压力的极值,您可以在顺势交易时利用这些压力。该指标还显示了基于斐波那契的可能目标。该指标可用于各种交易时间范围。该指标支持各种货币对的交易。   该指标为您提供所有类型的警报,包括推送通知。 购买后请联系我。我将与您分享我的交易技巧,并免费为您提供丰厚的红利指标! 祝您交易愉快,获利丰厚!
Entry Points Pro for MT5
Yury Orlov
4.51 (150)
传奇回归:Entry Points Pro 10。 这款传奇指标曾 3 年稳居 MQL5 Market 前三,如今全面重启。 数百条热情好评(两个版本合计 589 条),每天有数千名交易者用它交易,演示版下载 31,000+   MT4+MT5  次。 五年来我读过你们的每一条评价——在第 10 版里,我没有给出许诺,而是把答案直接做进了产品。指标作者自 1999 年入市, 珍视诚信、自己的声誉和自己的客户 。 Entry Points Pro 给出的入场信号严格不重绘。 而且这一次不再只是作者的一面之词,而是可验证的事实:确认信号只在 K 线收盘后标出,自动化测试记录到 零重绘 (在 EURUSD、XAUUSD 和 BTCUSD 上共 2,486,568 次不变量检查——0 次违规)。测试方法完全公开——您可以在策略测试器中自行复现。 购买后请务必第一时间给我发私信。 我会发给您 扩展版说明书《交易者圣经》 ——使用本指标交易的完整指南——并告诉您如何免费获得 赠品:市场扫描器 ,它能同时分析多个品种和多个时间周期,并在一个界面上显示 Entry Points Pro 此刻在哪里表现
Axiom Matrix
Issam Kassas
5 (6)
[User Manual]   ,   [Online Course]   ,   [PDF]  And [DEMO] Axiom Matrix 是一款适用于 MetaTrader 5 的专业多品种、多时间周期市场扫描器和决策仪表板。 它会扫描您的 Market Watch,分析多个时间周期,读取多个证据引擎,比较最强的交易机会,并在一个清晰的矩阵仪表板中显示最佳 BUY、SELL、WAIT 或被阻止的状态。 我开发 Axiom Matrix,是因为我想要一个可以替我完成繁重市场扫描工作的工具。 我不想只单独检查 RSI。 然后单独检查 MACD。 然后检查移动平均线。 然后检查成交量。 然后检查波动率。 然后检查支撑和阻力。 然后还要手动在不同品种和时间周期之间切换,只为了建立一个交易思路。 我想要一个仪表板,可以扫描市场、比较证据、排序最佳机会,并告诉我现在最强的交易设置在哪里。 这就是 Axiom Matrix 背后的核心理念。 AXIOM MATRIX 的功能 Axiom Matrix 会在多个时间周期上扫描多个交易品种,并根据多个技术证据组建立结构化决策。 Axiom Mat
本产品已针对 2026 年市场进行更新,并针对最新 MT5 版本进行了优化。 价格更新通知: Smart Price Action Concepts 目前价格为 $200 。 接下来的 30 次购买 后,价格将上涨至 $299 。 特别优惠: 购买后,请发送私信给我,即可领取 免费赠品 + 礼物 。 首先需要强调的是,这款交易工具是不重绘、不回绘、不延迟的指标,因此非常适合专业交易使用。 [Online course] ,   [User Manual]  ,  [How to Install]  ,   [PDF] Smart Price Action Concepts 指标是一款非常强大的工具,适合新手和有经验的交易者使用。它将 20 多个实用指标整合到一个系统中,结合了 Inner Circle Trader Analysis 和 Smart Money Concepts Trading Strategies 等高级交易理念。该指标专注于 Smart Money Concepts,帮助交易者理解大型机构如何交易,并辅助预测其市场行为。 它特别擅长流动性分析,使交易者更容易理解机
Gem SIGNAL
Shengzu Zhong
5 (1)
GEM Signal Pro GEM Signal Pro 是一款適用於 MetaTrader 5 的趨勢跟隨指標,專為希望在圖表上獲得更清晰訊號、更有結構的交易設定,以及更實用風險管理的交易者而設計。 它不僅僅顯示一個簡單的箭頭,GEM Signal Pro 還能以更清晰、更易讀的方式呈現完整的交易思路。當條件確認完成後,指標可在圖表上顯示進場價、止損價與止盈目標,幫助交易者更有效率地評估交易設定。 運作方式 該指標首先根據其內部邏輯識別有效的初始訊號。 當確認條件滿足後,GEM Signal Pro 會在圖表上顯示完整的交易設定。這讓交易者可以更清楚地看到交易結構,並減少手動分析與計算的工作量。 圖表上的交易價位 對於已確認的訊號,GEM Signal Pro 可顯示: 進場價 止損價 止盈 1 止盈 2 止盈 3 風險報酬比 這讓交易設定更容易理解,也有助於讓圖表分析更有條理。 內建風險管理 風險管理是此指標設計的重要部分。 止損位基於近期市場結構,結合附近的擺動高低點與可選的 ATR 緩衝距離。這能讓交易價位更貼近當前市場條件,而不只是依賴固定距離。 圖表資訊面板 GEM Si
FiboSniper Pro
Van Minh Nguyen
5 (2)
FiboSniper Pro – Multi-Filter Fibonacci System with Auto SL/TP and Control Panel FiboSniper Pro 是一款技术指标,将动态 Fibonacci Envelopes 与多个确认过滤器相结合,以生成经过筛选的 Buy 和 Sell 信号。Fibonacci 水平基于 Moving Average 和 ATR 计算,然后通过 ADX、EMA、RSI、ATR、Volume、Time 和 Candle 结构进行过滤。该指标直接在图表上显示基于 ATR 自动计算的 Stop Loss 和 Take Profit 水平,并提供交互式控制面板,以便快速调整参数。 购买后,请联系我以获取推荐的设置文件和详细使用说明。 使用 Auto Trader X 自动执行 FiboSniper Pro 信号: [Auto Trader X] 用户指南和设置文件: [Click here] 加入官方频道获取最新更新: [Click here] 专为偏好结构化入场和清晰风险管理的交易者设计,适用于 Gold (XAUUSD)、B
Power Candles MT5
Daniel Stein
4.73 (11)
Power Candles V3 - 自我优化的强度指标 Power Candles V3 把货币与品种的强度直接转化为图表上可执行的交易方案。指标不再仅根据强度给K线着色,而是在后台持续运行实时自动优化,为您正面对的品种给出最佳 Stop Loss、Take Profit 与信号阈值。一键采用,Entry、Stop Loss、Take Profit 线就以精确价格绘制在图表上,提醒消息中直接包含方向。 本工具是 Stein Investments 生态系统的一部分 - 18+ 款工具,加上 Max,您的一对一 AI 交易导师。  随时在线,深入了解每一款指标,在您需要梳理思路的那一刻就在那里。  立即认识他: https://stein.investments 每根收盘K线运行 3,000+ 次交易模拟。9 种强度状态。2 种策略并行测试。一键采用最优配置。 为什么需要这个 大多数强度指标只给您一个数值,然后留下三个问题:相信哪个阈值、用哪个 Stop Loss、走哪个交易方向。Power Candles V3 在每根收盘K线上自动回答这些问题。结果就是一个完整的交易方案 -
Divergence Bomber
Ihor Otkydach
4.89 (94)
购买该指标的每位用户将额外免费获得以下内容: 原创工具“Bomber Utility”,该工具会自动跟踪每一笔交易,设置止损和止盈点,并根据策略规则自动平仓; 适用于不同交易品种的指标设置文件(Set 文件); 三种不同风险模式下的 Bomber Utility 设置文件:“最低风险”、“平衡风险” 和 “观望策略”; 一套详细的 视频操作手册,帮助您快速完成安装、配置并开始使用本交易系统。 注意: 要获取以上所有赠品,请通过 MQL5 的私人消息系统联系卖家。 我为您介绍原创的自定义指标 “Divergence Bomber”(背离轰炸机),它是一套基于 MACD 背离交易策略 的“全功能”交易系统。 该技术指标的主要任务是识别 价格与 MACD 指标之间的背离,并发出交易信号(包括推送通知),指示未来价格可能的运动方向。平均而言,这些信号的准确率超过 98%。有关该指标如何工作的详细说明,请观看本页面上的视频演示。 该系统使用 止损订单 和 动态回撤平仓机制 来管理交易。 Divergence Bomber 指标的主要特点: 支持交易的品种: AUDCAD、AUDCHF、AUDS
BlueDigitsFx 生态系统官方访问 通过官方 BlueDigitsFx 生态系统获取基础设施更新、工作流程资源、产品发布及生态系统访问权限。 Telegram 生态系统 官方网站 BlueDigitsFx Precision Order Flow MT5 — MetaTrader 5 完整订单流分析套件 专业的基于交易时段的市场结构框架,将价值区域、控制点、拍卖背景与结构化决策支持相结合,专为认真的 MT5 交易者设计。 识别价值所在的位置 自动监控 VAH、POC 和 VAL 理解 London 和 New York 交易时段结构 通过结构化市场背景减少决策疲劳 专为 MetaTrader 5 交易者设计 开发者寄语 我开发 Precision Order Flow 是因为我希望能在 MetaTrader 5 内部以更清晰的方式读取交易时段结构。 在开发了多款被全球交易者广泛使用的 BlueDigitsFx 工具之后,我希望创建一个专注于 MT5 内部基于时段结构化决策的框架。在压力下手动绘制价位、切换平台并尝试解读价值区域容易导致决策不一致。Precision Orde
CRT Candle Range Theory HTF MT5.   Ultimate CRT Indicator: Advanced ICT Concepts and Malaysian SnR Trading System Master the Market Maker's Footprints with the Most Advanced Candle Range Theory Indicator Unlock the true power of  Smart Money Concepts (SMC)  and trade precisely like the institutions with the  Ultimate CRT Indicator . Built exclusively for serious traders, this indicator automates the highly effective  Candle Range Theory (CRT) , a core pillar of  ICT Concepts (Inner Circle Trader
Smc Pro ToolKit
Talal N Z Aljarusha
5 (12)
SMC PRO TOOLKIT — 智能资金分析与结构化交易规划 SMC Pro ToolKit 是一款面向 MetaTrader 5 的专业智能资金概念(Smart Money Concepts / SMC)分析工作空间。 它将市场结构、多周期分析、机构级价格区域、交易机会评估、确认工具、成交量背景、提醒系统和风险规划整合在一个结构清晰的图表环境中。 一个工作空间,多层确认,一套结构化交易计划。 打开完整用户指南 多条件交易机会引擎 SMC Pro ToolKit 的核心是一套 多条件交易机会引擎 。 该引擎不会依赖单一指标或单一市场事件,而是通过多个层面的市场信息,对潜在交易机会进行综合评估。 系统会分析市场结构和背景条件,将各项结果整合为 交易机会质量评分 ,并且只有在所需确认框架完整成立后,才会展示相应的交易思路。 市场背景 → 多周期一致性 → 智能资金区域 → 确认信号 → 质量评分 → 交易计划 当交易机会满足条件时,SMC Pro ToolKit 可以直接在图表上生成完整的交易计划,包括: 买入 / 卖出方向 入场价 止损价 止盈价 风险回报比 交易机会质量
Crystal Quantum Pro
Muhammad Jawad Shabir
5 (3)
CRYSTAL QUANTUM PRO Institutional Signal & Trade Intelligence for MetaTrader 5 Final Price: 199 USD ----> Price goes up 10 USD after every 10 sales. Limited launch slots available, act fast. Most indicators give you an arrow and leave you alone. A naked arrow is a gamble. Winning consistently requires CONFLUENCE , a clear STOP and TARGET , and honest PROOF that the system works. Crystal Quantum Pro delivers all three in one clean, no-repaint package. Crystal Quantum Pro is a complete decision sy
Scalper Vault   是一个专业的剥头皮系统,为您提供成功剥头皮所需的一切。该指标是一个完整的交易系统,可供外汇和二元期权交易者使用。推荐的时间范围是 M5。 该系统为您提供趋势方向的准确箭头信号。它还为您提供顶部和底部信号以及江恩市场水平。无论您拥有何种交易经验,该系统都易于使用。您只需要遵循简单的规则并每天重复该过程。 建议将此系统用于主要货币对。感谢您的关注! 请注意,该指标在策略测试器中可能无法正常工作。因此,我建议仅在模拟或真实账户的真实交易条件下使用该系统。 指示器提供所有类型的警报,包括推送通知。 购买指标后请与我联系。我将免费与您分享我的个人交易建议和出色的奖励指标! 祝您交易愉快,盈利!
FX Power MT5 NG
Daniel Stein
5 (33)
FX Power:分析货币强度,助您做出更明智的交易决策 概述 FX Power 是一款专业工具,帮助您全面了解主要货币和黄金在任何市场条件下的真实强度。通过识别强势货币用于买入,弱势货币用于卖出, FX Power 简化了交易决策,并帮助您发现高概率的交易机会。不论您是想跟随趋势还是通过极端的 Delta 值预测反转,这款工具都能完美适应您的交易风格。别再盲目交易——用 FX Power 让您的交易更加智慧。 1. 为什么 FX Power 对交易者极具价值 实时货币和黄金强度分析 • FX Power 实时计算并显示主要货币和黄金的相对强度,助您全面了解市场动态。 • 监控领先或落后资产,轻松识别值得交易的货币对。 全面的多时间框架视图 • 跟踪短期、中期和长期时间框架的货币和黄金强度,以便将您的交易策略与市场趋势保持一致。 • 无论是快进快出的短线交易还是更长期的投资策略, FX Power 都能为您提供所需的信息。 Delta 动态分析用于趋势和反转 • 极端 Delta 值常常预示反转机会,而平缓的 Delta 变化则确认趋势延续。 • 使用 Delta 分析,轻
作者的更多信息
Read-only analytics for accounts running several EAs. Groups your closed trades by magic number and measures how much of their combined risk actually cancels out. Free measurement edition. The monitoring and alerting edition is Portfolio Command Desk:  https://www.mql5.com/en/market/product/188884 The problem You run five Expert Advisors. Each backtest looked fine on its own. But the account does not trade five systems, it trades one portfolio, and no report in MetaTrader tells you how those sys
FREE
Hard limits for prop firm and challenge accounts Prop firm rules are not suggestions. Breach the daily loss limit by one dollar and the account is gone, whatever the equity curve looked like an hour earlier. The problem is that the rule lives on the firm's server while your positions live in your terminal, and nothing in MetaTrader 5 connects the two. Prop Firm Circuit Breaker sits on one chart and watches the whole account. The name is literal: an exchange halts trading when a threshold is bre
FREE
Start with the loss, not the profit. First decide how deep a drawdown you are willing to sit through — 5-10%, 20-30%, or more — and then let the system go after returns inside that limit. That is the order Veteran Army FX works in. And because no one knows which pair will produce the next real move, it keeps watch over eleven of them at once on the H4 timeframe, both directions, instead of betting the account on a single chart. At a glance Markets: 13 FX pairs, long and short, on the H4 timefram
Volume Trio Multi is a three-layer market-structure tool for MetaTrader 5: session Volume Profile (POC, VAH/VAL, Value Area), a CVD volume-pressure histogram with a strict Regular divergence engine, and anchored VWAP with standard-deviation bands — extended with a watchlist scanner that runs all three across the symbols in your Market Watch. This is the Pro edition of my free indicator, Volume Trio. The base engine is identical, so this page describes only what Pro adds. For the three layers the
Start with the loss, not the profit. First decide how deep a drawdown you are willing to sit through — and then let the system go after returns inside that limit. That is the order Veteran Army Gold works in. And because gold does not move the way currencies move, it works the market one price level at a time, buying and selling, instead of betting the account on a single idea. The same discipline behind Veteran Army FX, applied to a single market that behaves like nothing else. At a glance Mark
Envelope monitoring for multi-EA accounts. Each magic number is watched against its own backtest; you get a traffic light on the chart and an alert only when a state changes. Includes the full free measurement layer. What it is You run several Expert Advisors on one account. This utility reads their closed history, groups it by magic number, and watches every system against its own backtest: a traffic light on the chart, and an alert only when a state actually changes. Underneath sits a full mea
Start with the loss, not the profit. First decide how deep a drawdown you are willing to sit through — 5-10%, 20-30%, or more — and then let the system go after returns inside that limit. That is the order Veteran Army Nasdaq works in. And because no one knows when the index will make its next real move — or in which direction — it stands ready on both sides of one market, with many independent systems instead of one confident bet. At a glance Market: US Tech 100 index, long and short, on the H1
筛选:
无评论
回复评论