Simple Moving Averages

Simple Moving Averages Indicator for MetaTrader 5

Overview

The Simple Moving Averages (SMA) indicator for MetaTrader 5 is a versatile analytical tool designed to help traders visualize price trends and potential support/resistance levels. It calculates and displays up to ten (10) customizable Simple Moving Averages directly on your chart, providing a comprehensive view of various trend durations.

Key Features

  • Multiple SMAs: Plot up to 10 independent Simple Moving Averages simultaneously.
  • Customizable Periods: Adjust the calculation period (length) for each SMA to suit your analytical needs.
  • Flexible Price Sources: Choose the price type (e.g., Close, Open, High, Low, Median, Typical, Weighted) for each SMA's calculation.
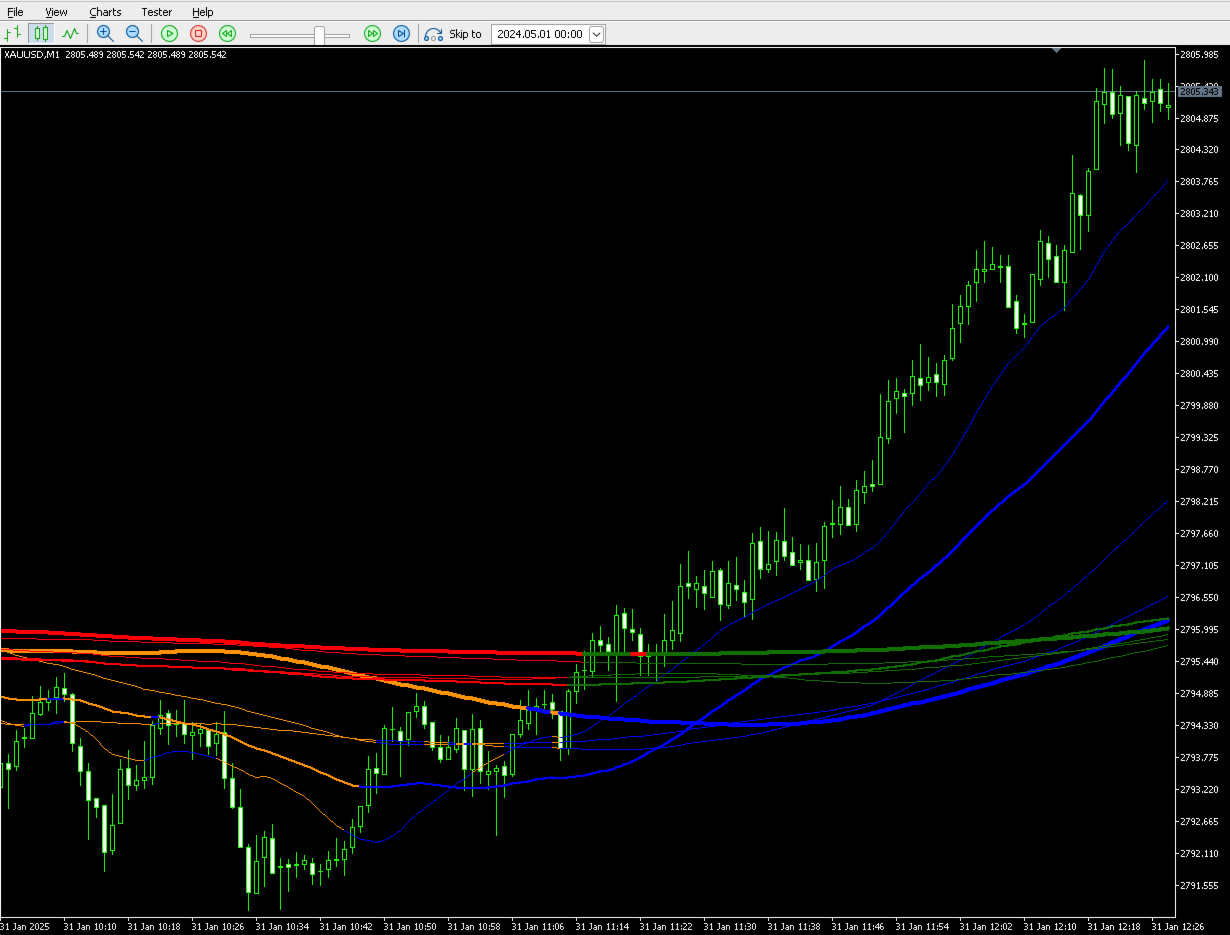
  • Dynamic Color Coding: Each SMA line changes color based on whether the current price is above or below its value, offering immediate visual cues on trend direction relative to the average.
    • For SMAs 1-5: Blue when price is above or equal to SMA, Orange when price is below SMA.
    • For SMAs 6-10: Green when price is above or equal to SMA, Red when price is below SMA.
  • Individual Visibility Toggle: Easily enable or disable each of the 10 SMAs from appearing on your chart via input parameters, allowing for a clean and focused analysis.

How to Install

  1. Download: Obtain the SimpleMovingAverages.mq5 file.
  2. Open MetaEditor: In your MetaTrader 5 terminal, go to Tools -> MetaQuotes Language Editor (or press F4 ).
  3. Navigate to Indicators Folder: In MetaEditor, in the Navigator panel, expand Indicators .
  4. Place the File: Drag and drop the SimpleMovingAverages.mq5 file into the Indicators folder (e.g., MQL5/Indicators ).
  5. Compile: Double-click the file in MetaEditor or open it and press F7 to compile. Ensure there are no compilation errors.
  6. Restart MT5 (Optional but Recommended): Close and reopen your MetaTrader 5 terminal.

How to Use

  1. Attach to Chart: In your MetaTrader 5 terminal, open the Navigator window ( Ctrl+N ). Expand Indicators , find "Simple Moving Averages", and drag it onto the desired chart.
  2. Input Parameters: A settings window will appear. Here you can customize the indicator:

    • SMA #1 to SMA #10 (Groups):
      • InpLenX : Set the period (number of bars) for the SMA calculation (e.g., 20, 50, 200).
      • InpSrcX : Select the price type for the SMA calculation.
        • PRICE_CLOSE (0): Default, uses closing price.
        • PRICE_OPEN (1): Uses opening price.
        • PRICE_HIGH (2): Uses high price.
        • PRICE_LOW (3): Uses low price.
        • PRICE_MEDIAN (4): Uses (High+Low)/2.
        • PRICE_TYPICAL (5): Uses (High+Low+Close)/3.
        • PRICE_WEIGHTED (6): Uses (High+Low+Close+Close)/4.
    • Visibility (Group):
      • InpShowSMAX : Toggle true to display the SMA, false to hide it.
  3. Interpretation: The indicator plots the Simple Moving Averages directly on your price chart.

    • When the price is above or equal to an SMA, the line will be colored (Blue for SMAs 1-5, Green for SMAs 6-10). This can suggest an uptrend relative to that specific average.
    • When the price is below an SMA, the line will be colored differently (Orange for SMAs 1-5, Red for SMAs 6-10). This can suggest a downtrend relative to that specific average.
    • Multiple SMAs can be used to identify stronger trends (e.g., all short, medium, and long-term SMAs aligning in one direction) or potential trend changes (e.g., shorter-term SMAs crossing longer-term SMAs).

Important Disclaimer and Risk Warning

Trading in financial markets carries a high level of risk, and it may not be suitable for all investors. The Simple Moving Averages indicator is a tool for technical analysis and does not guarantee any specific trading outcomes or profits. Past performance of any trading system or indicator is not necessarily indicative of future results. You should not invest money that you cannot afford to lose. Always consider your investment objectives and risk tolerance before trading.

Produtos recomendados
Bollinger Bands B
Flavio Javier Jarabeck
4.25 (4)
John Bollinger created this indicator in 2010 as a way to read the original indicator (Bollinger Bands) in a more "technical" way, shown as an oscillator. The typical range of the Bollinger Bands %B is 0 - 0.5 - 1.0, where "0" represents the lower band, the "0.5" the middle band, and "1" the upper band. The line on the indicator represents the Closing prices. As simple as that. SETTINGS Bollinger Bands period of analysis Standard Deviation multiplier Shift Price type to be analyzed If you like
FREE
VFI Quantum
Nikita Berdnikov
5 (1)
Introducing VFI (Volume Flow Indicator) – a trading indicator that analyzes the relationship between volume and price movement to identify key trading opportunities. The indicator displays the strength and direction of volume flow, providing clear signals about potential entry and exit points. Signals are formed based on zero line crossovers, crossovers between the VFI line and its exponential moving average (EMA), and when the indicator exits overbought and oversold zones. Attention! This stra
FREE
The indicator highlights the points that a professional trader sees in ordinary indicators. VisualVol visually displays different volatility indicators on a single scale and a common align. Highlights the excess of volume indicators in color. At the same time, Tick and Real Volume, Actual range, ATR, candle size and return (open-close difference) can be displayed. Thanks to VisualVol, you will see the market periods and the right time for different trading operations. This version is intended f
FREE
Friend of the trend : Seu Rastreador de Tendências Domine o mercado com o Friend of the trend , o indicador que simplifica a análise de tendências e te ajuda a identificar os melhores momentos para comprar, vender ou esperar. Com um design intuitivo e visualmente impactante, o Trend Analisa os movimentos de preço e entregar sinais através de um histograma colorido: Barras Verdes : Sinalizam uma tendência de alta, indicando oportunidades de compra. Barras Vermelhas : Alertam para uma tendência de
FREE
Follow The Line MT5
Oliver Gideon Amofa Appiah
4.6 (35)
This indicator obeys the popular maxim that: "THE TREND IS YOUR FRIEND" It paints a GREEN line for BUY and also paints a RED line for SELL. (you can change the colors). It gives alarms and alerts of all kinds. IT DOES NOT REPAINT and can be used for all currency pairs and timeframes. Yes, as easy and simple as that. Even a newbie can use it to make great and reliable trades. NB: For best results, get my other premium indicators for more powerful and reliable signals. Get them here: https://www.m
FREE
Value Chart Candlesticks
Flavio Javier Jarabeck
4.57 (14)
The idea of a Value Chart indicator was presented in the very good book I read back in 2020 , " Dynamic Trading Indicators: Winning with Value Charts and Price Action Profile ", from the authors Mark Helweg and David Stendahl. The idea is simple and the result is pure genius: Present candlestick Price analysis in a detrended way! HOW TO READ THIS INDICATOR Look for Overbought and Oversold levels. Of course, you will need to test the settings a lot to find the "correct" one for your approach. It
FREE
Donchian Breakout And Rsi
Mattia Impicciatore
4.5 (2)
Descrição geral Este indicador é uma versão aprimorada do Canal Donchian clássico, enriquecida com funções práticas para o trading real. Além das três linhas padrão (máxima, mínima e linha do meio), o sistema detecta breakouts e os mostra visualmente com setas no gráfico, exibindo apenas a linha oposta à direção da tendência atual para uma leitura mais limpa. O indicador inclui: Sinais visuais : setas coloridas nos breakouts Notificações automáticas : alerta pop-up, push e e-mail Filtro RSI : pa
FREE
Free automatic Fibonacci is an indicator that automatically plots a Fibonacci retracement based on the number of bars you select on the BarsToScan setting in the indicator. The Fibonacci is automatically updated in real time as new highest and lowest values appears amongst the selected bars. You can select which level values to be displayed in the indicator settings. You can also select the color of the levels thus enabling the trader to be able to attach the indicator several times with differe
FREE
High Low Open Close
Alexandre Borela
4.98 (44)
Se você gosta deste projeto, deixe uma revisão de 5 estrelas. Este indicador desenha os preços abertos, altos, baixos e finais para o especificado período e pode ser ajustado para um fuso horário específico. Estes são níveis importantes olhados por muitos institucional e profissional comerciantes e pode ser útil para você saber os lugares onde eles podem ser mais activa. Os períodos disponíveis são: Dia anterior. Semana anterior. Mês anterior. Quarto anterior. Ano anterior. Ou: Dia atual. Seman
FREE
Aggression Volume
Flavio Javier Jarabeck
4.29 (17)
O Indicador de Volume de Agressão é o tipo de indicador que raramente é encontrado na comunidade MQL5 porque não é baseado nos dados de Volume padrão fornecidos pela plataforma Metatrader 5. Ele requer a análise de todos os Ticks de tráfego solicitados na plataforma... Dito isso, o indicador de Volume de Agressão solicita todos os Dados de Tick do seu Broker e os processa para construir uma versão muito especial de um Indicador de Volume, onde as agressões de Compradores e Vendedores são plotada
FREE
Are you tired of drawing trendlines every time you're analyzing charts? Or perhaps you would like more consistency in your technical analysis. Then this is for you. This indicator will draw trend lines automatically when dropped on a chart. How it works Works similar to standard deviation channel found on mt4 and mt5. It has 2 parameters: 1. Starting Bar 2. Number of bars for calculation The   starting bar   is the bar which drawing of the trend lines will begin, while the   number of bars for c
FREE
MIDAS Super VWAP
Flavio Javier Jarabeck
4.27 (11)
Imagine VWAP, MVWAP and MIDAS in one place... Well, you found it! Now you can track the movement of Big Players in various ways, as they in general pursue the benchmarks related to this measuring, gauging if they had good execution or poor execution on their orders. Traders and analysts use the VWAP to eliminate the noise that occurs throughout the day, so they can measure what prices buyers and sellers are really trading. VWAP gives traders insight into how a stock trades for that day and deter
FREE
PROMETHEUS TECHNICAN VERSION Free | By THE SONS A gift from The Sons — no strings, no trial, no expiry. Every trader deserves access to professional-grade market intelligence. That belief is why Prometheus Technical Version exists, and why it costs nothing. Consider it our handshake to the trading community. What You're Getting This is not a simplified tool dressed up as a gift. Prometheus Technican Version is a fully built, institutional-quality technical analysis indicator running a dual-model
FREE
Donchian Pro
Paulo Henrique Faquineli Garcia
4.75 (4)
O Canal Donchian Os canais são uma das ferramentas de análise técnica mais populares porque transmitem intuitivamente aos analistas as restrições que tendem a ocorrer na maioria das mudanças de preço. Os usuários do canal sabem que informações valiosas podem ser obtidas a qualquer momento, independentemente de o preço estar no centro de uma faixa ou próximo a uma das fronteiras. Uma das técnicas mais famosas para explorar esses conceitos são as bandas de Bollinger. No entanto, John Bollinger não
FREE
Basic Vwap
james mugendi
4 (1)
Simple Vwap with the daily, weekly and monthly VWAP is the abbreviation for   volume-weighted average price , which is a technical analysis tool that shows the ratio of an asset's price to its total trade volume. It provides traders and investors with a measure of the average price at which a stock is traded over a given period of time. How it's used Identify entry and exit points:   Traders can use VWAP to determine when to buy or sell an asset.   Understand price trends :  Traders can use V
FREE
(Special New Year promotion - free price!) The indicator displays the actual 'Scale in points per bar' (identical to the manual setting in the Terminal, see screenshot) in the upper right corner of the chart. The displayed value changes INSTANTLY whenever the chart scale is changed! (This is very convenient when planning screenshots). In Settings: Change language (Russian/English), font size of the displayed text, text label offset coefficient from the graph corner, equally in X and Y directi
FREE
Spike Catch Pro
Amani Fungo
4.14 (7)
Spike Catch Pro 22:03 release updates Advanced engine for searching trade entries in all Boom and Crash pairs (300,500 and 1000) Programmed strategies improvements Mx_Spikes (to combine Mxd,Mxc and Mxe), Tx_Spikes,   RegularSpikes,   Litho_System,   Dx_System,   Md_System,   MaCross,   Omx_Entry(OP),  Atx1_Spikes(OP),   Oxc_Retracement (AT),M_PullBack(AT) we have added an arrow on strategy identification, this will help also in the visual manual backtesting of the included strategies and see ho
FREE
EasyTrading Panel Basic by Vexo EasyTrading Panel Basic is a free manual trade execution panel for MetaTrader 5. It provides a streamlined workflow for placing market orders with automatic risk-based lot sizing, stop loss, and take profit calculation. The panel works on any symbol and any timeframe. How It Works The panel displays on-chart with your account balance, current lot size, risk percentage, reward-to-risk ratio, and calculated stop loss. All values update in real time as you adjust par
FREE
PZ Penta O MT5
PZ TRADING SLU
3.5 (4)
The Penta-O is a 6-point retracement harmonacci pattern which usually precedes big market movements. Penta-O patterns can expand and repaint quite a bit. To make things easier this indicator implements a twist: it waits for a donchian breakout in the right direction before signaling the trade. The end result is an otherwise repainting indicator with a very reliable trading signal. The donchian breakout period is entered as an input. [ Installation Guide | Update Guide | Troubleshooting | FAQ | A
FREE
ATR Plus
Ivan Pochta
5 (1)
ATR Plus is an enhanced version of the classic ATR that shows not just volatility itself, but the directional energy of the market . The indicator converts ATR into a normalized oscillator (0–100), allowing you to clearly see: who dominates the market — buyers or sellers when a trend begins when a trend loses strength when the market shifts into a range where volatility reaches exhaustion zones ATR Plus is perfect for momentum, trend-following, breakout and volatility-based systems. How ATR Plus
FREE
Reversal Composite Candles
MetaQuotes Ltd.
3.69 (16)
A ideia do sistema é a identificação de padrões de reversão utilizando o cálculo de candles compostos. Os padrões de reversão são semelhantes aos padrões "Martelo" e o " Homem Enforcado " da análise candlestick Japonesa, porém ele usa candles compostos em vez de uma única barra e não precisa do pequeno corpo numa composição para confirmar a reversão. Os parâmetros de entrada: Range - número máximo de barras, utilizada no cálculo de composição dos candles compostos . Minimum - tamanho mínimo dos
FREE
LT Donchian Channel
Thiago Duarte
4.86 (7)
Donchian Channel (ou canal de Donchian) é um indicador criado por  Richard Donchian. Ele é  formado tomando a máxima mais alta e a mais baixa mais baixa do último período especificado em velas. A área entre alta e baixa é o canal para o período escolhido. Sua configuração é simples. É possível ter a média entre a linha superior e inferior além de alertas quando o preço atinge um dos lados. Se tiver alguma dúvida ou encontrar alguma falha, me contate. Faça bom uso!
FREE
Ideal para scalpers, day traders and swing trades.   Com base no histórico de preços, o indicador traça automaticamente linhas horizontais que evidenciam zonas estratégicas. Além disso, ele destaca em tempo real a região atual onde o candle está sendo negociado , fornecendo uma visão clara das áreas críticas de decisão. Tenet Support & Resistance Pro   é um indicador avançado para MetaTrader 5, projetado para ajudar traders a identificar com precisão as   principais regiões de suporte e resis
FREE
SMMA Bands Indicator
Elie Baptiste Granger
The SMMA Bands indicator is an advanced volatility-based trading tool that creates 6 dynamic support and resistance levels around an envelope formed by two Smoothed Moving Averages (SMMA).  This indicator combines the reliability of SMMA trend identification with the precision of standard deviation-based volatility bands, making it suitable for both trend-following and mean-reversion strategies. Every band has its own buffer for use in EA. feel free to make suggestions and add reviews , i will
FREE
This is a regression tree indicator for MT4/MT5. This indicator classificate nodes on the time period so that the deviation becomes smaller, and displays regression line and channel for each node. It's free! Attached CartDemo.ex4 and CartDemo.ex5 is a Demo version and has the following limitations: Can't use HighSpeed method (default method is RandomForest) Maximum number of bars is 260 (increase from 200) There is no expiration date and can be started many times, but it stops after an hour.
FREE
Tabajara V5
Flavio Javier Jarabeck
4.83 (36)
Metatrader 5 version of the famous Andre Machado's Tabajara indicator. If you don't know Andre Machado's Technical Analysis work you don't need this indicator... For those who need it and for those several friend traders who asked this porting from other platforms, here it is... FEATURES 8-period Moving Average 20-period Moving Average 50-period Moving Average 200-period Moving Average Colored candles according to the inflexion of the 20-period MA SETTINGS You can change the Period of all MA's
FREE
RSI abcd
Francisco Gomes Da Silva
4.33 (3)
RSI ABCD Pattern Finder: Estratégia Técnica 1. Como o Indicador Funciona Combina o RSI clássico com detecção automática de padrões harmônicos ABCD . Componentes Principais RSI Padrão (período ajustável) Marcações de Topos e Fundos (setas) Padrões ABCD (linhas verdes/vermelhas) Filtros de Overbought (70) e Oversold (30) 2. Configuração no MT5 period = 14 ; // Período do RSI size = 4 ; // Tamanho máximo do padrão OverBought = 70 ; // Nível de sobrecompra OverSold = 30 ; // Nível de sobrevenda Filt
FREE
This EA finds Fair Value Liquidity (FVL) on the chart, tracks when they get mitigated , and then looks for an inversion signal (price “fails” through the zone). When that inversion happens, it places a trade in the opposite direction of the original Liquidity gap (an Inverse FVG approach). It also lets you control when it trades using market sessions , and it can auto-close positions at New York open (all positions or profitable-only). Key advantages Clear, rule-based entries (no guessing): trad
FREE
Volume-to-Price Movement Oscillator (VP Oscillator) for MT5 The VP Oscillator highlights the balance (or imbalance) between trading volume and price movement, helping traders spot hidden accumulation, distribution, or weakening trends. How It Works: Calculates each bar’s price range (High–Low) and tick volume. Normalizes both values over a set period (default: 14). Plots the absolute difference between them ×100 — showing how closely price action aligns with trading activity. Interpretation: Hig
FREE
Coral Indi
Dinh Duong Luong
Coral trend is   a trend-following indicator that is widely popular among FOREX traders . It is usually used as a confluence with other indicators. It uses combinations of moving averages with complex smoothing formulas! It has two configurable parameters: Coefficient   - smoothing ratio (*) Applied price Calculation: Coral = (-0.064) * B6 + 0.672 * B5 - 2.352 * B4 + 2.744 * B3
FREE
Os compradores deste produto também adquirem
SuperScalp Pro
Van Minh Nguyen
4.63 (24)
SuperScalp Pro – Sistema avançado de scalping com múltiplos filtros SuperScalp Pro é um indicador avançado de scalping que combina o clássico Supertrend com múltiplos filtros inteligentes de confirmação para ajudar a identificar oportunidades de trading. Funciona de forma eficiente em vários timeframes de M1 até H4, com desempenho otimizado para XAUUSD, BTCUSD e principais pares Forex. O indicador fornece sinais claros de Buy e Sell, juntamente com níveis calculados automaticamente de entrada, S
Divergence Bomber
Ihor Otkydach
4.9 (89)
Cada comprador deste indicador recebe adicionalmente, e de forma gratuita: A ferramenta exclusiva "Bomber Utility", que acompanha automaticamente cada operação, define os níveis de Stop Loss e Take Profit e fecha operações de acordo com as regras da estratégia; Arquivos de configuração (set files) para ajustar o indicador em diferentes ativos; Set files para configurar o Bomber Utility nos modos: "Risco Mínimo", "Risco Balanceado" e "Estratégia de Espera"; Um vídeo tutorial passo a passo que aju
Gold Entry Sniper
Tahir Mehmood
5 (9)
Gold Entry Sniper – Painel ATR Multi-Tempo Profissional para Scalping e Swing Trading em Ouro Gold Entry Sniper é um indicador avançado para MetaTrader 5 projetado para fornecer sinais de compra/venda precisos para XAUUSD e outros ativos, com base na lógica de Trailing Stop ATR e análise multi-tempo . Ideal tanto para scalpers quanto para swing traders. Principais Recursos e Vantagens Análise Multi-Tempo – Veja a tendência de M1, M5 e M15 em um único painel. Trailing Stop Baseado em ATR – Níveis
Entry In The Zone and SMC Multi Timeframe is a real-time 2-in-1 market analysis tool that combines market structure analysis and a No Repaint BUY / SELL signal system into a single indicator, built on Smart Money Concepts (SMC) — a widely adopted framework used by professional traders to understand market structure. This indicator helps you see the market more clearly, make decisions based on structure rather than guesswork, and focus on high-probability zones where price is more likely to react
SignalTech MT5 is an unique fully rule based trading system for EURUSD, USDCHF, USDJPY, AUDUSD, NZDUSD, EURJPY, AUDJPY, NZDJPY, CADJPY.  All the winning trades with chart setups are published on the comments page. 2026-05 3173 Pips (Until 05-18 NY Closed) 2026-04 2243 Pips 2026-03 2165 Pips 2026-02 2937 Pips 2026-01 2624 Pips 2025-12 1174 Pips It can generate signals with Buy/Sell Arrows and Pop-Up/Sound Alerts. Each signal has clear Entry and Stop Loss levels, which should be automatically flag
Vamos ser honestos primeiro. Nenhum indicador sozinho vai te tornar lucrativo. Se alguém te disser o contrário, está te vendendo um sonho. Qualquer indicador que mostre setas perfeitas de compra/venda pode ser feito para parecer impecável — basta dar zoom na parte certa da história e tirar um print das operações vencedoras. Nós não fazemos isso.  SMC Intraday Formula é uma ferramenta. Ela lê a estrutura do mercado para você, identifica as zonas de maior probabilidade de preço e mostra exatament
Power Candles MT5
Daniel Stein
5 (8)
Power Candles V3 - Indicador de força com auto-otimização O Power Candles V3 transforma a força da moeda e do instrumento num plano de negociação prático em todos os gráficos aos quais está associado. Em vez de se limitar a colorir as velas, executa uma otimização automática em tempo real em segundo plano e apresenta-lhe os melhores valores de Stop Loss, Take Profit e limiar de sinal para o símbolo em questão. Basta um clique para o adotar na negociação em tempo real — as linhas de entrada, Stop
ARIPoint
Temirlan Kdyrkhan
1 (1)
ARIPoint is a powerful trading companion designed to generate high-probability entry signals with dynamic TP/SL/DP levels based on volatility. Built-in performance tracking shows win/loss stats, PP1/PP2 hits, and success rates all updated live. Key Features: Buy/Sell signals with adaptive volatility bands Real-time TP/SL/DP levels based on ATR Built-in MA Filter with optional ATR/StdDev volatility Performance stats panel (Success, Profit/Loss, PP1/PP2) Alerts via popup, sound, push, or email Cu
Gann Made Easy   é um sistema de negociação Forex profissional e fácil de usar, baseado nos melhores princípios de negociação usando a teoria do sr. W. D. Gann. O indicador fornece sinais precisos de COMPRA e VENDA, incluindo níveis de Stop Loss e Take Profit. Você pode negociar mesmo em movimento usando notificações PUSH. Entre em contato comigo após a compra para receber instruções de negociação e ótimos indicadores extras gratuitamente! Provavelmente você já ouviu muitas vezes sobre os método
Se você comprar este indicador, receberá meu Gerenciador de Operações Profissional + EA  GRATUITAMENTE. Primeiramente, vale ressaltar que este Sistema de Trading é um Indicador Não Repintado, Não Redesenho e Não Atrasado, o que o torna ideal tanto para o trading manual quanto para o automatizado. Curso online, manual e download de predefinições. O "Sistema de Trading Inteligente MT5" é uma solução completa de trading projetada para traders novos e experientes. Ele combina mais de 10 indicadores
Apresentando       Quantum Breakout PRO   , o inovador Indicador MQL5 que está transformando a maneira como você negocia Breakout Zones! Desenvolvido por uma equipe de traders experientes com experiência comercial de mais de 13 anos,       Quantum Breakout PRO       foi projetado para impulsionar sua jornada comercial a novos patamares com sua estratégia de zona de fuga inovadora e dinâmica. O Quantum Breakout Indicator lhe dará setas de sinal em zonas de breakout com 5 zonas-alvo de lucro e su
Azimuth Pro
Ottaviano De Cicco
5 (7)
Azimuth Pro V2: Estrutura Fractal Sintética e Entradas Confirmadas para MT5 Visão geral Azimuth Pro é um indicador de estrutura swing multinível da Merkava Labs . Quatro camadas de swing aninhadas, VWAP ancorado em swings, detecção de padrões ABC, filtragem estrutural de três timeframes e entradas confirmadas em barra fechada — um gráfico, um fluxo de trabalho dos micro-swings aos macro-ciclos. Este não é um produto de sinais cegos. É um fluxo de trabalho baseado em estrutura para traders que v
Trend Screener Pro MT5
STE S.S.COMPANY
4.85 (104)
Desbloqueie o poder da negociação de tendências com o indicador Trend Screener: sua solução definitiva de negociação de tendências, alimentada por lógica difusa e sistema de múltiplas moedas! Eleve sua negociação de tendências com o Trend Screener, o revolucionário indicador de tendências alimentado por lógica difusa. É um poderoso indicador de acompanhamento de tendências que combina mais de 13 ferramentas e recursos premium e 3 estratégias de negociação, tornando-o uma escolha versátil para to
FX Trend MT5 NG
Daniel Stein
5 (4)
FX Trend NG: A Nova Geração de Inteligência de Tendência Multi-Mercado Visão Geral FX Trend NG é uma ferramenta profissional de análise de tendências e monitoramento de mercado em múltiplos períodos de tempo. Permite compreender a estrutura completa do mercado em segundos. Em vez de alternar entre vários gráficos, você visualiza instantaneamente quais ativos estão em tendência, onde o momentum está enfraquecendo e onde existe alinhamento forte entre diferentes timeframes. Oferta de Lançamento
Meridian Pro
Ottaviano De Cicco
5 (2)
Meridian Pro 2.00: Matriz profissional de tendência multi-timeframe para MT5 Meridian Pro 2.00 é uma matriz de tendência adaptativa profissional para MetaTrader 5. Combina o motor original de tendência Meridian, um ribbon limpo no gráfico, setas de sinal em barra fechada, um dashboard de 8 timeframes, Fuel momentum, consenso ponderado, processamento HTF sintético e linhas de contexto de timeframe superior diretamente no gráfico. O objetivo é simples: ler tendência atual, estrutura multi-timefram
Antes de tudo, vale ressaltar que esta Ferramenta de Negociação é um Indicador Não Repintante, Não Redesenhante e Não Atrasado, o que a torna ideal para negociação profissional. Curso online, manual do utilizador e demonstração. O Indicador de Conceitos de Ação de Preço Inteligente é uma ferramenta muito poderosa tanto para traders novos quanto experientes. Ele combina mais de 20 indicadores úteis em um único, combinando ideias avançadas de negociação como Análise do Trader do Círculo Interno
GoldenX Entry MT5
Kareem Abbas
5 (5)
Gold Smart Entry é um indicador para MT5 com um algoritmo adaptativo Smart Entry Trend, um sistema de pontuação de sinais, um detector de regime de mercado e um filtro de volatilidade. Cada sinal inclui um nível de entrada calculado, três níveis de Take-Profit (TP1, TP2, TP3) e um nível de Stop-Loss. O indicador é construído sobre múltiplas camadas analíticas projetadas para se adaptar a diferentes condições de mercado, combinando um sistema analítico multicamadas com um otimizador integrado e u
Market Structure Order Block Dashboard MT5 é um indicador MT5 projetado para traders que querem ler a estrutura de mercado e as principais zonas de reação do preço diretamente no gráfico. Combina BOS, ChoCH, Order Blocks, Fair Value Gaps (FVG), Liquidez, Kill Zones, Volume Profile e um painel compacto para análise rápida. Este indicador é voltado para traders que usam estrutura de mercado, conceitos ICT e Smart Money como quadro de decisão. Pode ajudar a identificar continuações de tendência, po
FX Power MT5 NG
Daniel Stein
5 (31)
FX Power: Analise a Força das Moedas para Decisões de Negociação Mais Inteligentes Visão Geral FX Power é a sua ferramenta essencial para compreender a força real das principais moedas e do ouro em quaisquer condições de mercado. Identificando moedas fortes para comprar e fracas para vender, FX Power simplifica as decisões de negociação e revela oportunidades de alta probabilidade. Quer você prefira seguir tendências ou antecipar reversões usando valores extremos de Delta, esta ferramenta adap
Gem SIGNAL
Shengzu Zhong
5 (1)
GEM Signal Pro GEM Signal Pro é um indicador seguidor de tendência para MetaTrader 5, desenvolvido para traders que desejam sinais mais claros, setups mais estruturados e uma gestão de risco mais prática diretamente no gráfico. Em vez de mostrar apenas uma seta simples, o GEM Signal Pro ajuda a apresentar a ideia completa da operação de forma mais clara e fácil de entender. Quando as condições são confirmadas, o indicador pode mostrar o preço de entrada, o stop loss e os alvos de take profit no
Este é um indicador para MT5 que fornece sinais precisos para entrar em uma negociação sem redesenhar. Ele pode ser aplicado a qualquer ativo financeiro: forex, criptomoedas, metais, ações, índices. Ele fornecerá estimativas bastante precisas e informará quando é melhor abrir e fechar um negócio. Assista o vídeo (6:22) com um exemplo de processamento de apenas um sinal que compensou o indicador! A maioria dos traders melhora seus resultados de negociação durante a primeira semana de negociação c
Btmm state engine pro
Garry James Goodchild
5 (4)
BTMM State Engine Pro is a MetaTrader 5 indicator for traders who use the Beat The Market Maker approach: Asian session context, kill zone timing, level progression, peak formation detection, and a multi-pair scanner from a single chart. It combines cycle state logic with a built-in scanner dashboard so you do not need the same tool on many charts at once. What it does Draws the Asian session range; session times can follow broker server offset or be set in inputs. Tracks level progression (L
Atomic Analyst MT5
Issam Kassas
3.94 (31)
Primeiramente, vale ressaltar que este Indicador de Negociação não repinta, não redesenha e não apresenta atrasos, tornando-o ideal tanto para negociação manual quanto automatizada. Manual do utilizador: configurações, entradas e estratégia. O Analista Atômico é um Indicador de Ação de Preço PA que utiliza a força e o momentum do preço para encontrar uma vantagem melhor no mercado. Equipado com filtros avançados que ajudam a remover ruídos e sinais falsos, e aumentam o potencial de negociação.
Este painel mostra os últimos   padrões harmónicos   disponíveis para os símbolos seleccionados, pelo que poupará tempo e será mais eficiente /   versão MT4 . Indicador gratuito:   Basic Harmonic Pattern Colunas do indicador Symbol :   aparecem os símbolos seleccionados Trend :   de alta ou de baixa Pattern :   tipo de padrão (gartley, borboleta, morcego, caranguejo, tubarão, cifra ou ABCD) Entry :   preço de entrada SL:   preço de paragem de perda TP1:   preço do 1º take profit TP2:   preço
Quantum TrendPulse
Bogdan Ion Puscasu
5 (25)
Apresentando   Quantum TrendPulse   , a ferramenta de negociação definitiva que combina o poder do   SuperTrend   ,   RSI   e   Stochastic   em um indicador abrangente para maximizar seu potencial de negociação. Projetado para traders que buscam precisão e eficiência, este indicador ajuda você a identificar tendências de mercado, mudanças de momentum e pontos de entrada e saída ideais com confiança. Principais características: Integração SuperTrend:   siga facilmente a tendência predominante do
Trend Forecaster
Alexey Minkov
5 (7)
Trend Forecaster – Since 2023. The Trend Forecaster indicator utilizes a unique proprietary algorithm to determine entry points for a breakout trading strategy. The indicator identifies price clusters, analyzes price movement near levels, and provides a signal when the price breaks through a level. The Trend Forecaster indicator is suitable for all financial assets, including currencies (Forex), metals, stocks, indices, and cryptocurrencies. You can also adjust the indicator to work on any time
OrderFlux | Orderflow de Footprint para MetaTrader 5 Versão 2.0 – Visualização Bid/Ask em tempo real para Traders Ativos O OrderFlux é um indicador de footprint e orderflow para MT5. Ele não mostra apenas para onde o preço se moveu, mas o que acontece dentro do movimento: volume de Bid/Ask por nível de preço, delta, imbalance e distribuição de volume. Muitos gráficos mostram apenas o resultado final de uma vela. O OrderFlux mostra o caminho para chegar lá. É exatamente isso que ajuda quando você
RelicusRoad Pro MT5
Relicus LLC
4.96 (24)
RelicusRoad Pro: Sistema Operacional Quantitativo de Mercado 70% DE DESCONTO ACESSO VITALÍCIO (TEMPO LIMITADO) - JUNTE-SE A 2.000+ TRADERS Por que a maioria dos traders falha mesmo com indicadores "perfeitos"? Porque eles operam Conceitos Únicos no vácuo. Um sinal sem contexto é uma aposta. Você precisa de CONFLUÊNCIA . RelicusRoad Pro não é um simples indicador de seta. É um Ecossistema Quantitativo de Mercado completo. Ele mapeia a "Estrada do Valor Justo", distinguindo ruído de rupturas estru
Grabber System MT5
Ihor Otkydach
4.83 (23)
Apresento a você um excelente indicador técnico: Grabber, que funciona como uma estratégia de trading “tudo incluído”, pronta para usar. Em um único código estão integradas ferramentas poderosas de análise técnica de mercado, sinais de entrada (setas), funções de alertas e notificações push. Cada comprador deste indicador também recebe gratuitamente: Utilitário Grabber: ferramenta para gerenciamento automático de ordens abertas Vídeo tutorial passo a passo: como instalar, configurar e operar com
LINHAS DE TENDÊNCIA PRO   -   Ajuda a entender onde o mercado está realmente mudando de direção. O indicador mostra inversões de tendência reais e pontos onde os principais participantes retornam ao mercado. Você vê     Linhas BOS   Análise de tendências e níveis-chave em prazos maiores — sem configurações complexas ou ruídos desnecessários. Os sinais não são repintados e permanecem no gráfico após o fechamento da barra. VERSÃO MT4   -   Revela seu potencial máximo quando combinado com o   indic
Mais do autor
Trend Lines v2 MT5
Quang Huy Quach
5 (1)
Trend Lines v2 MT5 is an intelligent auto trendline indicator that instantly detects key dynamic support and resistance zones. Built on pivot high/low structure, it delivers a clear and accurate view of market trends across all timeframes. Features Fully automatic trendline drawing based on precise pivot points. Filters out noise – only clean and reliable trendlines are shown. Control the number of lines to keep your chart neat and easy to read. Flexible customization: colors, line thickness, ra
FREE
Indicator Guide: Key Price Levels & Structure Shifts 1. Description The indicator is a technical analysis tool for the MetaTrader 5 platform. It is designed to automatically identify specific price movements and to highlight corresponding price zones based on preceding price action. This provides a visualization of key price areas according to the indicator's internal logic. 2. Visual Elements & Their Identification The indicator identifies and draws several types of visual elements on the chart
FREE
Breakout Finder MT5
Quang Huy Quach
5 (1)
The "Breakout Finder" is a technical indicator designed to automatically identify potential price breakouts and breakdowns on a chart. The highlight of this indicator is its robust signal filtering system, which helps traders avoid false signals (fakeouts) and focus on higher-probability trading opportunities. Key Features Automatic Pivot Point Detection: The indicator automatically identifies significant pivot highs and lows on the chart to establish potential support and resistance levels. Bre
FREE
The "Support Resistance Dynamic" indicator is a powerful technical analysis tool for the MetaTrader 5 platform, designed to automatically identify and plot dynamic Support and Resistance zones on price charts. This indicator helps traders easily recognize important price levels, potential reversal points, or breakout areas, thereby enabling more informed trading decisions. 2. Key Features Dynamic S/R Identification : Automatically identifies support and resistance zones based on an advanced Pivo
FREE
The MultiFrameRSIIndicator is a powerful MetaTrader 5 (MT5) indicator that leverages the Relative Strength Index (RSI) to analyze trends across multiple timeframes. This indicator synchronizes RSI-based trend signals from up to nine timeframes (M1, M5, M15, M30, H1, H4, D1, W1, MN1) and presents them with clear visual feedback, including a colored RSI line, signal arrows, and a customizable dashboard. Ideal for traders seeking momentum-based trend confirmation. Features Multi-Timeframe Analysis
FREE
The Linear Regression Channel is a powerful technical analysis tool that helps visually identify the prevailing trend and potential price zones. Essentially, the indicator performs two main functions: It draws a trendline through the center of price action over a specified period. This line is calculated using the linear regression method, which results in the best possible "line of best fit" for the price data. From this center line, the indicator plots two parallel lines above and below, creat
FREE
SuperTrend Signals
Quang Huy Quach
5 (1)
The Supertrend indicator is a trend-following technical analysis tool designed to help traders identify the direction of market trends and potential entry/exit points. It operates based on price data and Average True Range (ATR) to create a dynamic signal line that changes color depending on the current trend. Green color: Indicates an uptrend. Red color: Indicates a downtrend. Supertrend is a useful indicator for both short-term and long-term trading, helping to filter out market noise and focu
FREE
The Pivot Point Supertrend indicator is a technical analysis tool designed for the MetaTrader 5 (MT5) platform. It combines two popular analytical methods: Pivot Points: Uses significant historical price highs and lows to identify potential support and resistance zones. These points are objective and stable. Supertrend: A well-known trend-following indicator that helps identify the current market trend and provides dynamic stop-loss levels. Indicator's Goal: By using the stability of Pivot Point
FREE
1. Overview The Scalping PullBack Signal indicator is a powerful technical analysis tool designed to help traders identify scalping opportunities based on potential pullback and reversal signals. This tool is particularly useful on lower timeframes (below 15 minutes) but can also be applied on higher timeframes for longer-term trades. This indicator integrates several key analytical components, providing a comprehensive view of trends and potential entry/exit points, helping you make quick and e
FREE
1. Introduction Smart Volume S/R Pro is a powerful technical analysis tool designed for the MetaTrader 5 platform. Unlike traditional Support & Resistance (S/R) indicators that rely on price peaks and troughs, this indicator automatically identifies critical S/R zones based on a core factor: Trading Volume . Core Principle: Price levels that witnessed exceptionally high trading volume in the past will often become significant psychological zones, where the price is likely to react strongly (eith
FREE
TMA Overlay
Quang Huy Quach
TMA Overlay Indicator for MT5 - User Guide 1. Introduction TMA Overlay is a versatile technical analysis indicator for the MetaTrader 5 platform. The indicator's goal is to provide traders with a comprehensive overview of the trend, potential entry signals, and key trading sessions, all integrated into a single chart. This is not a trading system, but a comprehensive analysis tool designed to help you make more informed decisions. 2. Core Indicator Components The indicator consists of multiple c
FREE
The MultiFrameTrendAnalyzer is a versatile MetaTrader 5 (MT5) indicator designed to provide multi-timeframe trend analysis using Moving Average (MA) crossovers. This indicator synchronizes trend signals across multiple timeframes (M1, M5, M15, M30, H1, H4, D1, W1, MN1) and displays them with intuitive visual cues, including a colored trend line, signal arrows, and a customizable dashboard. Features Multi-Timeframe Analysis : Evaluates trends across up to nine timeframes, allowing traders to conf
FREE
The "Volume Range Profile with Fair Value" (VRPFV) indicator is a powerful volume analysis tool designed to help traders better understand market structure and identify key price areas where significant institutional activity occurs. Instead of just looking at volume on individual candlesticks, VRPFV analyzes the distribution of volume by price level within a specific time range, providing deep insights into the "footprint" of smart money. VRPFV consists of the following core components: Upper &
FREE
MTF Candles Drawing
Quang Huy Quach
5 (1)
The MTF (Multi-Timeframe) Candles indicator is a powerful tool that allows you to display candles from a higher timeframe (e.g., H1, H4, D1) directly on a lower timeframe chart (e.g., M5, M15, M30). The Problem It Solves: Instead of constantly switching back and forth between charts to analyze the main trend and detailed price action, this indicator merges both perspectives into one. You can instantly see the "big picture" while staying focused on trading signals on your current timeframe. Core
FREE
RSI Ultimate MTF
Quang Huy Quach
5 (1)
1. Introduction The CM_Ultimate_RSI_MTF is a powerful and versatile custom indicator for MetaTrader 5, designed to enhance your Relative Strength Index (RSI) analysis. It provides multi-timeframe (MTF) capabilities, visual signals, and customizable alerts, making it an invaluable tool for traders seeking to identify overbought/oversold conditions, trend strength, and potential entry/exit points across various timeframes. 2. Key Features Multi-Timeframe (MTF) Analysis: Allows you to view RSI from
FREE
The Multi-Frame MACD Indicator is a robust MetaTrader 5 (MT5) indicator that utilizes the Moving Average Convergence Divergence (MACD) to analyze trends across multiple timeframes. This indicator synchronizes MACD-based trend signals from up to nine timeframes (M1, M5, M15, M30, H1, H4, D1, W1, MN1) and presents them with clear visual cues, including a colored MACD line, signal arrows, and a customizable dashboard. Perfect for traders seeking momentum and trend reversal insights. Features Multi-
FREE
The WaveTrend Oscillator indicator is an enhanced version of the classic WaveTrend Oscillator, a momentum indicator. It is designed to identify overbought/oversold conditions and provide potential trend reversal signals. The core difference in this version is the application of a data "normalization" algorithm. This ensures the indicator's oscillation lines remain balanced around the zero line, causing the indicator window to always stay naturally centered. This is especially useful when trading
FREE
Welcome to Ultimate MA MTF , a multi-functional Moving Average (MA) indicator converted from the original TradingView version by ChrisMoody and upgraded with many powerful features. This is not just a typical MA line. It is a comprehensive technical analysis tool designed to provide traders with deep insights into trends, volatility, and potential trading signals, all within a single indicator. Key Features 8 Moving Average Types: Full support for the most popular MA types (SMA, EMA, WMA, HullMA
FREE
Ultimate EMA
Quang Huy Quach
Multi-Period EMA is a convenient indicator that displays multiple Exponential Moving Averages (EMAs) on a single chart. It is designed to help traders easily identify market trends and key crossover points without the need to add multiple individual EMA indicators. Key Features: Multiple EMAs in one: Simplifies chart analysis by combining several EMA lines into one indicator. Fully customizable: Easily change the period (default 20, 50, 100, 200), color, and thickness of each EMA line. Clean in
FREE
Fibonacci Bollinger Bands (FBB) Indicator - User Manual 1. Introduction Fibonacci Bollinger Bands (FBB) is a technical analysis indicator that combines three tools: Bollinger Bands , Fibonacci Ratios , and the Volume-Weighted Moving Average (VWMA) . The purpose of this indicator is to provide a multi-dimensional view of the market by helping to identify: Dynamic support and resistance zones. The general market trend. Volatility levels and potential accumulation phases (squeezes). Price breakouts
FREE
Volume Flow Indicator (VFI) - User Manual 1. General Introduction The Volume Flow Indicator (VFI) is an advanced technical oscillator designed to measure the strength and sustainability of a price trend by incorporating both price and volume data. Developed based on the concepts of On-Balance Volume (OBV) but with significant improvements, the VFI provides deeper insight into money flow and the conviction behind price movements. This indicator is not an automated trading system but a powerful an
FREE
The Vix_Fix indicator, or "Vix Fix," is a tool designed to identify potential market bottoms. It operates on the principle of measuring extreme fear or pessimism among the crowd, which are moments when the market often has a high probability of reversing to the upside. Main Purpose: To help traders find high-probability BUY (Long) entry points by identifying when the market is "oversold." How it Works In simple terms, the Vix Fix measures the distance between the current bar's Low and the Highes
FREE
MultiFrame Pivot MT5
Quang Huy Quach
5 (1)
MultiFrame Pivot: A Multi-Timeframe Analysis Tool MultiFrame Pivot is an analysis indicator designed to provide an overview of the market based on Pivot Points across multiple timeframes. The indicator synthesizes information from different timeframes to give you a more comprehensive view of important price levels. KEY FEATURES: Multi-Timeframe Analysis: MultiFrame Pivot allows you to simultaneously monitor the price's status relative to Pivot Points (PP), Support 1 (S1), and Resistance 1 (R1)
FREE
1. Introduction The Market Squeeze Momentum Indicator (SQZMOM_LB) is a powerful technical analysis tool designed to help traders identify periods of low market volatility (the "squeeze" phase) and predict the direction and strength of price momentum after the squeeze ends. This indicator combines the principles of Bollinger Bands and Keltner Channels to detect changes in market volatility, along with a momentum oscillator to measure buying/selling pressure. 2. Key Components of the Indicator The
FREE
1. Overview The ATR Dynamic Stop (CE) is a powerful technical indicator designed to help traders identify and follow market trends. Its core function is to provide a dynamic trailing stop-loss based on price volatility, as measured by the Average True Range (ATR) indicator. The main objectives of the ATR Dynamic Stop are: Profit Optimization: It helps you ride a strong trend by setting a reasonable stop-loss, preventing premature exits due to minor market noise and fluctuations. Risk Management:
FREE
MultiFrame Volume Trend (MFVI) is a powerful VWAP-based indicator that displays volume trends across multiple timeframes in a clean, easy-to-read dashboard directly on your chart. Instantly capture the overall market direction in just seconds. Features Multi-timeframe VWAP analysis from M1 to MN1. Dashboard panel shows the trend state of each timeframe at a glance. Plots VWAP line and buy/sell arrows directly on the chart. Fully customizable: colors, line width, panel position, arrow symbols. Bu
FREE
MultiFrame MA
Quang Huy Quach
5 (1)
MultiFrame MA: A Multi-Timeframe Trend Indicator MultiFrame MA is a trend analysis indicator designed to provide a comprehensive market overview across various timeframes. Instead of relying on a single timeframe, this tool synthesizes information from multiple charts, giving users a holistic and reliable perspective. KEY FEATURES: Multi-Timeframe Analysis: The indicator analyzes data from various timeframes, from M1 up to Monthly, to help users identify trend confluence at different levels. MA
FREE
The Smart Trend Tracker (OTT) is a technical analysis tool designed to help traders identify the direction and strength of a market trend. This indicator functions as an optimized moving average that adapts to market volatility, thereby providing dynamic support and resistance levels. The primary goal of the OTT is to smooth out price action and offer visual cues about potential changes in the trend. Core Components of the Indicator When you add the indicator to your chart, you will see two main
FREE
This indicator is a trading strategy designed to find high-probability entry points by combining two very popular indicators: Bollinger Bands (BB) and the Relative Strength Index (RSI) . The core idea is "dual confirmation" : a trade signal is only considered valid when both indicators agree. This helps filter out many of the false signals that occur when using just a single indicator, thereby increasing the reliability of each entry. Bollinger Bands are used to identify relative price value zon
FREE
The EMA Navigator Pro is an advanced version of the popular EMA indicator, designed to provide superior flexibility and multi-timeframe analysis capabilities. This indicator not only displays EMA lines but also offers a powerful alert system to ensure you never miss a crucial signal. Key Features: Multi-Timeframe Support: You can assign a separate timeframe to each individual EMA line, allowing you to analyze long-term (e.g., D1) and short-term (e.g., H1) trends on the same chart. Automatic Cro
FREE
Filtro:
Sem comentários
Responder ao comentário