Conheça o Mercado MQL5 no YouTube, assista aos vídeos tutoriais
Como comprar um robô de negociação ou indicador?
Execute seu EA na
hospedagem virtual
hospedagem virtual
Teste indicadores/robôs de negociação antes de comprá-los
Quer ganhar dinheiro no Mercado?
Como apresentar um produto para o consumidor final?
Novos Expert Advisors e Indicadores para MetaTrader 5 - 199
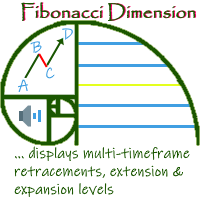
'Fibonacci Dimension' indicator allows display of preset or user-defined multi-timeframe Fibonacci levels. It automatically takes the previous high and low for two user-defined timeframes and calculates their Fibonacci retracement levels. It also considers the retraced level to draw the expansions on every change of price. A complete visual dimension in multiple timeframes allows deriving profitable strategies for execution. Enhanced functionality to view and customize the default Fibonacci Rang
FREE
With this script you can open or close multiple charts with just one click. Please follow the instructions below; Set your desired symbols in the market watch window. Open one chart. Attach the script to the chart In the input values just select the time frame of your chart. Set open chart value to true. Click ok. To close the charts follow step 3 and 7. In input values set open chart value to false and close chart value to true

Trend indicator, a revolutionary unique solution for trend trading and filtering with all important trend features built into one tool! This is a 100% non-repainting multi-timeframe and multi-currency indicator that can be used on all currency pairs. HandleTrend is an effective trend following indicator that gives trend signals in the form of arrows on the chart.

https://www.youtube.com/watch?v=0T8Mge39Xsk&t=9s
Youtube Sell only EA here.
These EAs trade macd divergence only if there is a parabolic sar change at the same time.
Buy bullish macd divergence & parabolic sar crosses below price Macd settings Threshhold is how far above / below zero divergence must occur. Timeframe used Parabolic sar settings
Only one trade in that direction can be opened at once. Trades on open bar Alerts , mt5 and mobile Stop loss and target points Stop loss is set to a
FREE

https://www.youtube.com/watch?v=0T8Mge39Xsk&t=9s
Youtube
These EAs trade macd divergence only if there is a parabolic sar change at the same time. Sell bearish macd divergence & parabolic sar crosses above price Macd settings Threshhold is how far above / below zero divergence must occur. Timeframe used Parabolic sar settings
Only one trade in that direction can be opened at once. Trades on open bar Alerts , mt5 and mobile Stop loss and target points Stop loss is set to a % percentage of the
FREE
Use this software to browse through all objects within the chart and look at them comfortably. Also, you can look at the list of global variables and search and delete them . The same you can do with charts and indicators. You can search in objects names and object descriptions to find the object you are interested in. This is definitely an improvement to what is available in Mt5. You type what you are interested in , then press Search button. You can move to next and previous search results. N
FREE

V Band is a technical analysis tool that helps smooth out price action by filtering out the “noise” from random price fluctuations. It is calculated by taking the average of a market’s price over a set period of time.
It can be applied to stocks equity indices, commodities and Forex . V Bands is used to identify trends or support and resistance levels.
They can also be used to generate buy and sell signals.
Choose a trading style and start trading!
The Universal Reversal EA is based on a reversal/pullback strategy of the current trend. Due to the wide range of applications, the EA can operate as a stand-alone EA, or due to the low risk settings, serve as a supplement to an existing trading setup. The solid backtests of more than 10 years show the durability of the EA under various market situations and global economic crises. The setting file can be found here (Comments #1) . Further explanations are below the settings.
Universal Rever

Fundamentação teórica A VWAP é uma média móvel ajustada pelo volume, ou seja, o peso de cada preço corresponde ao volume de ações negociadas no período, dando mais importância ao período em que se tenha mais negociações. A Orion Vwap Bands permite que o usuário use plote 8 bandas que podem ser utilizadas como suportes e resistências para o preço. Cada banda é calculada a partir da Vwap Tradicional:
Ex.: Se escolhermos o valor 0.25 para a plotagem da Banda 1, pega-se o preço da Vwap e acrescent

Boom and Crash Buy and Sell Trend. Non-repaint. Can be used on all timeframes 1 minute for scalpers. 5 minute to monthly timeframe for swing trading. works on all boom and crash pairs Crash300, Crash500, Crash1000. Boom300, Boom500, Boom1000. Green histogram colour means the trend is up(bullish) Buy signal. Dark orange histogram colour means the trend is down(bearish) Sell signal.

OPTMIZE EA BEFORE BACKTEST AND USE. United States Stock Market Index US500 trades the 5 minute charts. The EA uses RSI and Stochastics for entries and ATR for exits. The building period was From 2021-03-19 to 2022-08-18. Continually optimize the EA to find best settings and don't forget to account for spreads and slippage in optimization . The EA does not use martingale and has a sl and tp on each trade with a fixed lot input. Try it out in the back test, optimize for settings.
Risk Dis
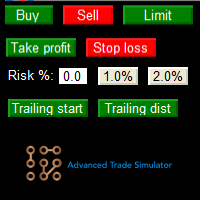
Advanced Trade Simulator for MT5
It is an indicator you can attach to any chart and then buy and sell the given symbol virtually. No actual trading takes place. You can attach it to multiple charts. Then you can buy multiple symbols.
A more detailed description here: https://www.mql5.com/en/blogs/post/750336 Features:
- buy and sell immediately on the given time frame - market , limit and stop orders - generalized OCO, more than 2 orders can cancel each other. - OSO, one sends another.. - bu
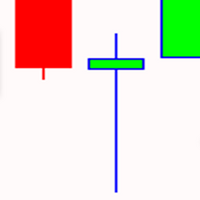
OPTMIZE EA BEFORE BACKTEST AND USE. Gold Pin Bar trade XAU/USD on 1HR charts using moving averages and pin bars. Pin bars are used to pick higher probable trades that can occur. The price is pushed up or down forming the pin bar signaling who has control over the price. Optimize for the best settings for stop loss and take profits and don't forget to account for spreads and slippage in optimization. . All order have money management and the EA doesn't use dangerous trading strategies. Rest as
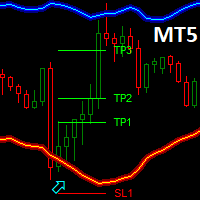
Dark Bands is an Indicator for intraday trading. This Indicator is based on Counter Trend strategy but use also Volatility. We can enter in good price with this Indicator, in order to follow the inversions on the current instrument.
Key benefits
Easily visible take profit/stop loss lines Reliable bands lines with futuristic colors, and Intuitive directional arrows Useful statistics , which indicate the win rate of the signals Plus Package available, leave a feedback to receive it for fr
FREE

This Expert advisor trades any Asset class, Try it on any market, When you download PM so you can be added to my channel for all support related issues. There are three trading strategies available * The Wyckoff trading strategy, Channel trading and trend trading. Input Parameters Lots - the volume of position to open; Stop Loss BUY (in points) - the stop loss of BUY positions; Stop Loss SELL (in points) - the stop loss of SELL positions; Take Profit BUY (in points) - the take profit o
FREE

Um consultor de negociação construído especificamente para negociação de ouro! Uma estratégia de indicador funciona nos canais de preço, o que permite evitar saltos acentuados nas mudanças de preço.
Isso permite que você evite grandes perdas ao negociar. Não usa grade e martingale. Este Expert Advisor foi desenvolvido principalmente para economizar capital durante a leitura deste instrumento com altos lucros.
A EA usa stop loss e take profit!
Ao adquirir este consultor, você primeiro adqui
Telegram Utility EA link para qualquer bot privado/público e pode ajudá-lo a: Feche todos os pedidos instantaneamente por comando. O comando é codificado com sua senha personalizada e só você sabe. O bot do Telegram informará quando todos os pedidos forem fechados e até mesmo pausará todos os outros EAs em execução no seu terminal MT5. Pause/Retome quaisquer outros EAs em execução no Terminal com apenas um clique! Exportar relatório de comércio por formulário de pips ou formulário de dinheiro.

DESCRIÇÃO O indicador EasyFollowerTrader Bot1 DayTrade opera apenas a favor da tendência majoritária. Assim, o indicador, em primeiro momento, observar a tendência do gráfico diário para operar a favor deste. Em seguida, o indicador observar a tendência do gráfico atual. Quando estes dois gráficos estiverem se movimentando na mesma direção, teremos a maior probabilidade de ganhos. Chamaremos esta região como região de alta probabilidade de ganho. Na região de alta probabilidade de ganho, o indic

Um utilitário simples para copiar volumes de negociação de uma conta MT5 ou MT4 para outra conta MT5. Você pode copiar posições entre contas de compensação e cobertura em qualquer combinação. Por padrão, as posições abertas por todos os símbolos correspondentes com os mesmos volumes serão copiadas. Se os nomes dos símbolos são diferentes ou o volume de posições copiadas deve ser diferente ou nem todas as posições devem ser copiadas, então o comportamento desejado pode ser especificado nas config
FREE
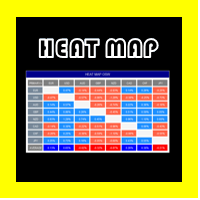
OSW DO MAPA PRINCIPAL
Este indicador é ideal para conhecer o estado atual de todas as combinações de moedas e conhecer sua variação.
A variação é calculada pelo movimento percentual do preço desde o preço atual até 24 horas atrás, ou o que estiver configurado no menu.
Para saber a variação de uma moeda, basta olhar para a moeda principal, exemplo:
no EUR você tem que olhar verticalmente para comparar com outras moedas e no final de tudo, você encontra a média de todos esses valores de varia

SINAIS DE ESTÁGIO ENGUIFANDO ESS
Este indicador detecta velas do tipo envelope às quais é aplicado um filtro, este filtro é composto por 3 estratégias em conjunto, com as quais é possível identificar a maior eficácia possível dentro dos parâmetros mensuráveis.
Os sinais são indicados por setas para cima e para baixo para cada uma das direções, e você também pode ativar ou desativar alertas, e-mails e mensagens push para o celular.
Vale ressaltar que nenhum indicador é 100% eficaz, por isso d

Eleve suas decisões de trading com o Angle of Moving Average MT5 , um indicador inovador que quantifica a inclinação das médias móveis para oferecer insights claros sobre a direção e o momento do mercado. Baseado no princípio de medir a inclinação angular das médias móveis ao longo de um número específico de barras, esta ferramenta tornou-se um pilar na análise técnica desde sua conceituação nas comunidades de trading por volta de 2010. Amplamente discutido em fóruns como Forex Factory e elogi

** All Symbols x All Time frames scan just by pressing scanner button ** *** Contact me to send you instruction and add you in "Divergence group" for sharing or seeing experiences with other users. Introduction MACD divergence is a main technique used to determine trend reversing when it’s time to sell or buy because prices are likely to drop or pick in the charts. The MACD Divergence indicator can help you locate the top and bottom of the market. This indicator finds Regular divergence for pul

The trading expert works out the regular movements of the AUDCAD currency pair in the channel.
The Expert Advisor is completely ready for work. Additional configuration is not required. Trading signals : https://www.mql5.com/en/signals/author/trendhunter The MetaTrader5 terminal must be installed on a remote server for smooth operation. The EA works based on the indicator: https://www.mql5.com/en/market/product/62951 Install the Expert Advisor on the AUDCAD chart, timeframe 1H. Options:
Cha

The Active Trend indicator helps to analyze the market on the selected time interval. It defines the mainstream. Used in trading. You can use so basic to determine the trend. The indicator works well on both short and longer trend sections. In flat it is recommended to use filters of your choice. It can accompany the position with a stop, it is recommended to set the stop at a fixed distance from the point formed by the indicator. The simplest way to use the indicator is to open a trade in the

An arrow technical indicator without redrawing Signal Breakthrough in the Forex market is able to give tips with the least errors.
Every rise and fall is reflected in your emotional state: hope is replaced by fear, and when it passes, hope appears again. The market uses your fear to prevent you from taking advantage of a strong position. At such moments you are most vulnerable. Currency pairs never rise or fall in a straight line. Their ups and downs are interspersed with rollbacks and reversa

Close All and Change Take Profit and Stop Loss All Orders. Main Features
Ability to Close All Orders the Symbol you put this EA. Ability to Change Take Profit to All Order. Ability to Change Stop Loss to All Order. Show Order count. Show Average price with info and Horizontal Line. Show lot open.
Show Price diff from average to price now Show broken price with info and Horizontal Line. Easy to use . How to use
Close All (Symbol) PC : you can click on CloseAl
Bi Stable Trading - a stable bot for the whole history with one setting! Works on the basis of the Trading Direction indicator. Since the Trading Direction indicator generates stable signals for trading without redrawing exactly at the opening prices, the EA works as stably and reliably as possible. Everything that you read in the description of the indicator is also suitable for an expert. The expert goes through the whole story! The EA is designed for stable long-term trading, although it can
Multi Stable Trading is a unique trading system based on a stable indicator without Trading Direction repaints. The uniqueness lies in the high stability of the system and work with a large portfolio of tools. A portfolio can be formed as you like, new instruments can be added, additionally, you can use the basic indicator optimization utility for the desired instrument for free. The bot goes through the entire history in multi-currency mode. Naturally, all instruments have their own settings.

Trend driver bars is the manual trading system, which defines current trend continue or it's pull-back/reverse. "Driver" bars - are price action patterns that has powerfull affect on market, defining it's near future direction. Generally, driver bars represents trend "skeleton" and often anticipates new market impulse. System plots arrows when market shows 3 pattenrs in a row(most powerfull combo-pattern), and makes fast scalping of incomming movement. Loss positions closes by common profit. Lot

The indicator calculates the correlation coefficient of 2 instruments, shifts the chart of the 2nd instrument relative to the 1st and displays the charts of both instruments on the current chart. The maximum positive and negative deltas and the current delta as a percentage of the maximum are calculated. It is possible for signals to set a delta for entry and exit with displaying the direction of entry into trade for each instrument. The space between the charts is also filled with different col

The indicator calculates intraday levels based on the average daily price range, builds support and resistance levels that may be reversal.
Parameters Period ATR - period of the ATR indicator Shift time - time offset for the opening of the day Color opening of day - color of the opening line of the day Color 1AR, -1AS - line color 1AR, -1AS Color AR 1/2, AS -1/2 - line color AR 1/2, AS Color AR 1/4, AS -1/4 - line color AR 1/4, AS -1/4 Color AR 3/4, AS -3/4 - line color AR 3/4, AS -3/4 Color
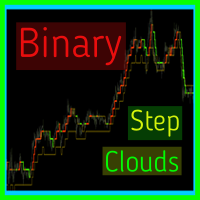
Binary step clouds - is the complete trading system with enter and exit points. System is based on double smoothed exponential step moving and volume weighted simple step moving.Generally each movings define trend direction and places when trend is in active phase. Signals plots when both movings approache to active trend phase and market speed is high. Main Indicator's Features Signals are not repaint,non-late or disappear(exept cases when system recalculates all history datas,refreshing main

** All Symbols x All Time frames scan just by pressing scanner button ** *** Contact me to send you instruction and add you in "Harmonic Scanner group" for sharing or seeing experiences with other users. Introduction Harmonic Patterns are best used to predict turning point. Harmonic Patterns give you high win rate and high opportunities for trade in during one day. This indicator detects the best and successful patterns based on Harmonic Trading concepts . The Harmonic Patterns Scanner Sc
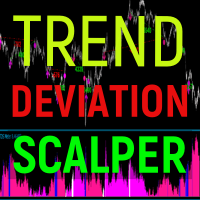
Trend deviation scalper - is the manual system to scalp choppy market places. Indicator defines bull/bear trend and it's force. Inside exact trend system also defines "weak" places, when trend is ready to reverse. So as a rule, system plots a sell arrow when bull trend becomes weak and possibly reverses to bear trend. For buy arrow is opposite : arrow is plotted on bear weak trend. Such arrangement allows you to get a favorable price and stand up market noise. Loss arrows are closing by common p
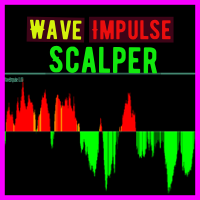
Wave Impulse OmegaScalper - is the manual system for scalping. In many cases Indicator "eats" almost all possible trend wave. System defines up price wave and down price wave. Inside the exact wave - system defines true trend movement and choppy market. Indicator plots signals while market is trending, powerfull and has quiet good volatility. This is complete system with enter and exit points. Main Indicator's Features Signals are not repaint,non-late or disappear(exept cases when system recalcu

Reverse side scalper is the manual trading system, that works on choppy(anti-trend) market. As a rule markets are on 80% choppy and only 20% is trend phase. System is based on custom step Moving and RSI and reverse pattern. System defines up movement, down movement, trend / choppy phases. Indicator plots Buy signal arrow when current direction is down and phase is trend, Sell signal arrow is plotted when currently is up movement and phase is trend. As a rule it allows to "catch" local maximum/mi

The fractal indicator shows the latest support and resistance levels. If the price breaks through the level and is fixed, the indicator draws a rhombus of yellow or crimson color signaling a possible continuation of the movement towards the breakdown.
Indicator Settings:
- BarCount: sets the minimum number of bars required to build a fractal.
It is better to use the indicator in conjunction with other indicators.
FREE

Welcome to Investment Castle products This product is exclusively available in the MQL5 market and is not available and will not be available anywehere else. The Combined indicator is a multi-time frame indicator and it is built using 3 indicators: Bands indicator which draws the support and resistance key levels using up to 5 different time frames Patterns indicator which draws the chart patterns using up to 6 different time frames Spots indicator which shows the common candlestick patterns Yo
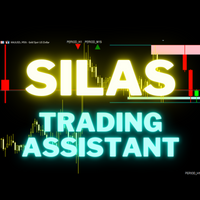
Silas is a trading assistant for multi-timeframes traders. It show on the screen, in a very clear way, all the informations needed to suits to your trading. It show : - Supply and demand zone from 2 timeframes of your choice - Setups based of market structure from 2 timeframes of your choice - Daily current high and low points - The last 2 closed candles and the current candle from an higher time frame on the right of the graph. - Actual daily candle on the left Everything is customisable !

В основу алгоритма этого осциллятора положен анализ веера сигнальных линий технического индикатора RSI . Алгоритм вычисления сигнальных линий выглядит следующим образом. В качестве исходных данных имеем входные параметры индикатора: StartLength - минимальное стартовое значение первой сигнальной линии; Step - шаг изменения периода; StepsTotal - количество изменений периода. Любое значение периода из множества сигнальных линий вычисляется по формуле арифметической прогрессии: SignalPeriod(Number)

How it works? This EA trades with Stochastic Signal line Cross over low and high levels. Only allows one open trade at a time on the currency you have attached this EA. if Reverse Logic is FALSE will open BUY if Stocha Signal Line Cross below Low Level will open SELL if Stocha Signal Line Cross Above High Level if Reverse Logic is TRUE will open SELL if Stocha Signal Line Cross below Low Level will open BUY if Stocha Signal Line Cross Above High Level Key difference with my other EA " Maste

Индикатор iVeles_Perfect_Oscilator является опережающим и одним из самых лучших осциляторов на сегодняшний день, использует специализированный расчет текущих цен графика. Очень качественно и своевременно показывает смену направления, очень точный подход к уровням перекупленности и перепроданности, что позволяет своевременно принять решение по сделке. Работает качественно на любом ТФ и с любым инструментом. Параметры: Period - период расчетов Average - усреднение МА Method - применяемый мето

PK Crash 1000 EA is an EA designed specifically to trade Crash 1000 Index on the M2 Timeframe.
The minimum deposit is 100 USD per 0.2 Lot Size for a 1:500 leverage account. PK Crash 1000 EA shows stable trading results. PK Crash 1000 EA only trades one direction. It only sells thus profiting from the drops that occur in the Crash 1000 Index. This unique feature allows the EA to maximize your profits and minimize the drawdown. The trailing stop feature tracks 50% of the profit gained thus reduci

В основу алгоритма этого трендового индикатора положен анализ веера сигнальных линий универсального мувинга I . Алгоритм вычисления сигнальных линий выглядит следующим образом. В качестве исходных данных имеем входные параметры индикатора: StartLength - минимальное стартовое значение первой сигнальной линии; Step - шаг изменения периода; StepsTotal - количество изменений периода. Любое значение периода из множества сигнальных линий вычисляется по формуле арифметической прогрессии: SignalPeriod(

Top indicator for MT5 providing accurate signals to enter Trades.
This Indicator will provide pretty accurate trading signals and tell you when it's best to open a trade by giving alerts to buy or sell. Mainly was created to target Volatility Index on Deriv broker however, the Spot Detector Arrow Indicator can be applied to any financial assets(Forex, Crypto, Indices, Volatilities) on MT5 Brokers.
HOW TO BUY Wait for signal Alert to Buy will be sent to your MT5 Terminal Blue arrow facing

Inventory Retracement Trade it is designed based on one of the most popular tradingview indicator. This is mostly combined with other popurlar trend indicator to confirm the strength of the movement. Definition Inventory Retracement Trade is quickly becoming one of the most popular ways to identify where short-term counter trend institutional inventory has subsided and when it’s time to re-enter into a trade’s original trend direction.

PK Crash 1000 PRO is an EA designed specifically to trade Crash 1000 Index on the M1 Timeframe. It doesn't trade frequently but it offers a high return of profits with lesser risk. The minimum deposit is 100 USD per 0.2 Lot Size for a 1:500 leverage account. PK Crash 1000 PRO shows stable trading results. PK Crash 1000 PRO only trades one direction. It only sells thus profiting from the drops that occur in the Crash 1000 Index. This unique feature allows the EA to maximize your profits and mini

PK Crash 500 EA is an EA designed specifically to trade Crash 500 Index on the M1 Timeframe.
The minimum deposit is 100 USD per 0.2 Lot Size for a 1:500 leverage account. PK Crash 500 EA shows stable trading results. PK Crash 500 EA only trades one direction. It only sells thus profiting from the drops that occur in the Crash 500 Index. This unique feature allows the EA to maximize your profits and minimize the drawdown. This EA only uses the stop loss feature. It automatically closes trades o

PK Crash 500 PRO is an EA designed specifically to trade Crash 500 Index on the M5 Timeframe.
The minimum deposit is 100 USD per 0.2 Lot Size for a 1:500 leverage account. PK Crash 500 PRO shows stable trading results. PK Crash 500 PRO only trades one direction. It only sells thus profiting from the drops that occur in the Crash 500 Index. This unique feature allows the EA to maximize your profits and minimize the drawdown. The trailing stop feature tracks 50% of the profit gained thus reducin

PK Crash 300 EA is an EA designed specifically to trade Crash 300 Index on the M2 Timeframe. PK Crash 300 EA shows stable trading results. PK Crash 300 EA only trades one direction. It only sells thus profiting from the drops that occur in the Crash 300 Index. This unique feature allows the EA to maximize your profits and minimize the drawdown. The trailing stop feature tracks 50% of the profit gained thus reducing on the drawdown. PK Crash 300 EA is very simple to use. All you have to do is to

PK Boom 1000 EA is an EA designed specifically to trade Boom 1000 Index on the M1 Timeframe.
The minimum deposit is 100 USD per 0.2 Lot Size for a 1:500 leverage account. PK Boom 1000 EA shows stable trading results. PK Boom 1000 EA only trades one direction. It only buys thus profiting from the spikes that occur in the Boom 1000 Index. This unique feature allows the EA to maximize your profits and minimize the drawdown. This EA targets the spike trends that's why it has a huge take profit tar

PK Boom 500 EA is an EA designed specifically to trade Boom 500 Index on the M1 Timeframe.
The minimum deposit is 100 USD per 0.2 Lot Size for a 1:500 leverage account. PK Boom 500 EA shows stable trading results. PK Boom 500 EA only trades one direction. It only buys thus profiting from the spikes that occur in the Boom 500 Index. This unique feature allows the EA to maximize your profits and minimize the drawdown. This EA doesn't use trailing stop since it automatically detects a change in t

This EA and setting are designed for you who want to pass FTMO Challenge or MFF challenge.
best designed for major pair like eurusd,usdjpy,audusd or usdcad. time frame m15-h1.
On the backtest I test with 10.000 balance with lot 0.04 and result as seen on attached screenshot. On The FTMO demo I test with 50.000 balance with starting 0.5 lot on USDCAD TFM15 and risk 4%. All you need is calculate the risk and reward and lotsize.
we not guarantee to be the same result on the future because of m
The robot will open one BUY and one SELL tread for each pair in a specific time (hour:minute) of the day using the parameters details for Take Profit, Stop Loss and time slot: For BUY if openBUY is true at HRBUY:MMBUY using stopLossBUY and takeProfitBUY For SELL if openSELL is true at HRSELL:MMSELL using stopLossSELL and takeProfitSELL It does not use : Martingale. Grid. Hedge. It works with 5-digit and 4-digit broker.
Is strongly recommended to use forex market with spread 0 and lo

Waterstrider Cash Register
A High Risk trade with Martingale grid
The trend is based on the h1 chart, and scalping in m1-m15 chart.
Pair EURJPY, USDJPY, AUDUSD
8 position will open if against the position, and when the 8 position reach, a hedge position will open to increase the equity balance with small tp and re entry every 10% DD. after that the ea will calculate the open position and the hedge position and will close all in profits. No guarante for profit, you can try this with your ow

PK Boom 300 EA is an EA designed specifically to trade Boom 300 Index on the M2 Timeframe.
The recommended deposit is 100 USD per 1 Lot Size for a 1:500 leverage account. PK Boom 300 EA shows stable trading results. PK Boom 300 EA only trades one direction. It only buys thus profiting from the spikes that occur in the Boom 300 Index. This unique feature allows the EA to maximize your profits and minimize the drawdown. This EA uses a trailing stop of 50% profit gained to minimize account drawd

FX STEWARDS Trading Signals Alert - Financials v4.00 (Heritage Edition) (Fundamental + Technical Edition) Built for precision. Powered by data. Driven by market context. FX STEWARDS Trading Signals Alert - Financials is an elite hybrid indicator that combines the power of technical signals, structural wave logic, and real-time fundamental news filtering to deliver highly selective, risk-scored BUY/SELL signals on your chart. Whether you're a discretionary trader or a quant-driven analyst, t

Wink IND is an indicator that tell you: -when MACD is saying buy or sell -when RSI is saying buy or sell -work on multi timeframes MT4 Version
by Wink IND: you don't need to have Knowledge about MACD or RSI don't need to check and compare MACD and RSI respectly don't need to check all of timeframes and compare the resaults don't lose time, save more time for your decisions in trading
Wink IND: multi timeframe indicator multi currency indicator show the positions by graphic shapes, arrows and
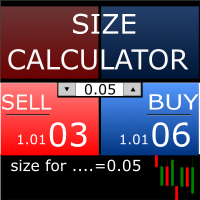
Size Calculator allow you to calculate the size you need for your position giving two parametres: the number of pips risked and the money risked, for example if you want to risk 20 USD on 200 pips, then you will need to input 200 in the case reserved for pips and 20 in the case reserved for risk, the size will appear in left top carner of the chart in your metatrader 4 platform, Size Calculator support the following symbols : EURUSD GBPUSD AUDUSD NZDUSD GOLD WTI EURJPY GBPJPY USDJPY AUDJP

The indicator very accurately determines the levels of the possible end of the trend and profit fixing. The method of determining levels is based on the ideas of W.D.Gann, using an algorithm developed by his follower Kirill Borovsky. Extremely high reliability of reaching levels (according to K. Borovsky - 80-90%) Indispensable for any trading strategy – every trader needs to determine the exit point from the market! Precisely determines targets on any timeframes and any instruments (forex, met

SUPPLY DEMAND EA PRO está oferecendo uma nova maneira de negociar qualquer Instrumento Financeiro que você desejar. É baseado no indicador MTF Supply Demand com muito mais recursos que vão elevar sua experiência de negociação e disparar seus lucros. Você tem a possibilidade de colocar ordens de limite e de mercado com um clique. O EA ajustará o tamanho do lote de qualquer negociação automaticamente e gerenciará o StopLoss pela metade ou no ponto de equilíbrio. Minha intenção não era criar um EA

Archi-construído sobre indicadores, no futuro, seu número aumentará. Você pode usar " Trailing Stop "com" Trailing Position "e"Step Trailing". Existe a possibilidade de aumentar o volume da transação subsequente, com uma corrente perdedora, tanto multiplicando quanto adicionando. Depois de alcançar a superioridade das transações positivas sobre as perdas, o volume retorna ao original. Archi BasicSettings:
Magic number é o número único de todas as transações abertas. Atenção!!! o conselheiro t

UR Front-EndBack-End
UR FrontEndBackEnd é minha fórmula favorita para encontrar os níveis mais precisos de suporte e resistência. Eu também os dividi em diferentes categorias (linhas tracejadas, linhas sólidas e áreas) para marcar o quão fortes eles são. Tudo é armazenado em buffers para que sejam fáceis de acessar e implementar em outras ferramentas.
Acréscimo: A ferramenta pode necessitar de ser ajustada ao ativo sobre o qual é aplicada - os ativos diferem em termos de nr de dígitos no pr

OTIMIZE EA ANTES DE TESTAR E USAR.
Bitcoin M5 é para negociação BTC/USD em gráficos de 5 minutos. SL e TP devem começar com 50.000. OTIMIZAR ANTES DE USAR
A estratégia de negociação usa indicadores Bollinger Bands e Envelopes para negociar. Negociar para capturar alguns pontos de ruptura onde o preço ultrapassa as bandas e depois sair quando o preço cruza os envelopes. Cada negociação utiliza um valor de lote fixo e possui SL e TP. O EA não usa martingale ou hedge na lógica.

O Weis Wave Chart Forex para MT 5 é um um indicador de Preço e Volume.
A leitura de Preço e Volume foi amplamente divulgada através de Richard Demille Wyckoff com base nas três leis criadas por ele: Oferta e Demanda, Causa e Efeito e Esforço x Resultado.
Em 1900 R.Wyckoff já utilizava o gráfico de Ondas em suas análises.
Muitos anos depois, por volta de 1990 , David Weis Automatizou o gráfico de ondas de R. Wyckoff e hoje nós trazemos a evolução do gráfico de ondas de David Weis.
Ele mostra

O Weis Wave Chart para MT5 é um um indicador de Preço e Volume.
A leitura de Preço e Volume foi amplamente divulgada através de Richard Demille Wyckoff com base nas três leis criadas por ele: Oferta e Demanda, Causa e Efeito e Esforço x Resultado.
Em 1900 R.Wyckoff já utilizava o gráfico de Ondas em suas análises.
Muitos anos depois, por volta de 1990 , David Weis Automatizou o gráfico de ondas de R. Wyckoff e hoje nós trazemos a evolução do gráfico de ondas de David Weis.
Ele mostra a q

SupportResistancePeaks Indicator indicator - is the combination of dynamic support/resitance and price action pattern. As a rule support/resistance indicators uses already calculated, history levels. The most disadvantage of this method - new(incomming) levels always are not the same as were on history, in other words accuracy is not so high as expected. My indicator is looking for dynamic/live levels that are forming right now after trend lost it's power and choppy market starts. As a rule exac

YOU CAN NOW DOWNLOAD FREE VERSIONS OF OUR PAID INDICATORS . IT'S OUR WAY OF GIVING BACK TO THE COMMUNITY ! >>> GO HERE TO DOWNLOAD
More About Advanced Currency Meter Every good forex system has the following basic components: Ability to recognize the trend direction. Ability to identify the strength of the trend and answer the basic question Is the market trending or is it in a range? Ability to identify safe entry points that will give a perfect risk to reward (RR) ratio on every position.
FREE

Awesome Oscillator by Bill Williams with the ability to fine-tune and replace the averaging algorithms of the indicator, which significantly expands the possibilities of using this oscillator in algorithmic trading and brings it closer in its properties to such an indicator as the MACD. To reduce price noise, the final indicator is processed with an additional Smooth averaging. The indicator has the ability to give alerts, send mail messages and push signals when the direction of movement of th
O Mercado MetaTrader é o melhor lugar para vender robôs de negociação e indicadores técnicos.
Você apenas precisa desenvolver um aplicativo para a plataforma MetaTrader com um design atraente e uma boa descrição. Nós vamos explicar como publicar o seu produto no Mercado e oferecer a milhões de usuários MetaTrader.
Você está perdendo oportunidades de negociação:
- Aplicativos de negociação gratuitos
- 8 000+ sinais para cópia
- Notícias econômicas para análise dos mercados financeiros
Registro
Login
Se você não tem uma conta, por favor registre-se
Para login e uso do site MQL5.com, você deve ativar o uso de cookies.
Ative esta opção no seu navegador, caso contrário você não poderá fazer login.