Conheça o Mercado MQL5 no YouTube, assista aos vídeos tutoriais
Como comprar um robô de negociação ou indicador?
Execute seu EA na
hospedagem virtual
hospedagem virtual
Teste indicadores/robôs de negociação antes de comprá-los
Quer ganhar dinheiro no Mercado?
Como apresentar um produto para o consumidor final?
Novos Expert Advisors e Indicadores para MetaTrader 5 - 147

O indicador de MTF Qristalium Arrows é semi-acabados, sistema de negociação. Funciona em todos os pares de moedas.
No indicador envolvidos em três regras: 1)o comércio é apenas uma tendência, 2)"da compra, quando tudo o que vender e vender, quando todo mundo está comprando", 3) o Preço sempre vai contra a multidão.
O indicador de MTF Qristalium Arrows filtra os dados da regra de vários таймфреймам com a ajuda de indicadores internos. Com a coincidência de tendência em determinados cortes

Best Scalper Oscillator is an indicator for MetaTrader 5 based on mathematical calculations on the price chart. This is one of the most common and useful indicators for finding the trend reversal points. Best Scalper Oscillator is equipped with multiple types of notification (push notifications, emails, alerts), which allows opening trades in time.
Distinctive features Generates minimum false signals. Excellent for identifying trend reversals. Perfect for scalping. Suitable for working on t

Indicador projetado para levar aos investidores a vantagem de identificar fortes padrões de candles em tempo real, através da coloração dos candles que representam estes padrões, tornando possível atuar na compra ou venda. A cor para cada padrão identificado pelo indicador por ser parametrizada, de acordo com seu gosto.
Os Padrões de Candle identificados por este indicador são: Inside Bar Preço de Fechamento de Reversão de Alta ou Closing Price Reverse Top (PFRA)
Preço de Fechamento de Revers
CAP Stochastic EA MT5 trades using the Stochastic Indicator. It offers many customizable Stochastic trading scenarios and flexible position management settings, plus many useful features like customizable trading sessions, a martingale and inverse martingale mode. [ Installation Guide | Update Guide | Submit Your Problem | All Products ]
Functions Easy to use and customizable Stochastic setting. Customizable indicator settings Built-in money management Grid trading when trade in Loss C
FREE

Apollo 3 route 66 It is an advanced trading system. This is a fully automatic Expert Advisor, which allows you to presize the trade according to the preferences of the trader. Apollo 3 route 66 have more customization options for your trade. Different options for different styles of trade. Apollo 3 route 66 is a break system of trade with different algorithm of trade mode. This EA using signals to place orders. Is a revolution in the customization of the trading. The algorithms develo
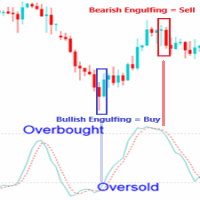
EXPERT ADVISOR DESCRIPTION
- Expert Advisor Engulfing in OBOS (Overbought Oversold) is an expert advisor consisting of a combined candle engulfing pattern and Stochastic Oscillator indicators. A Buy position occurs when engulfing are formed when the signal stochastic indicator is in the oversold area, A sell position occurs when engulfing are formed when the signal stochastic indicator is in the overbought area. - You can combine engulfing that form in certain timeframes with a signal stochas

This bot is based on the analysis of adaptive moving averages. The expert is characterized by stable signals, which can be used as accurate short-term signals. This is a semi-scalping system that analyzes the market using reliable indicators. Scalper is a system or not, depends on the parameters TakeProfit and StopLoss . Using this adviser, you need to understand that this bot requires optimization. The bot works both on netting accounts and on hedging accounts. But the settings must be optimiz

O Índice de Força Relativa (RSI), desenvolvido por J. Welles Wilder, é um oscilador de momento que mede a velocidade e a mudança dos movimentos de preços. O RSI oscila entre zero e 100. Adicionamos ao conceituado indicator RSI vários tipos de alertas e um filtro de intervalo entre os sinais para ser incorporado em rôbos. *Funciona em todos os timeframes e instrumentos.
Funcionalidades do produto
E-mail alert Alerta Sonoro Push Notificação (Alerta pode ser enviado ao seu celular) Sinais no c
This bot can classify ticks into classes from 0 to 64, after which after analyzing the tick micro-signals it determines which way to open a position. You can work with an expert only on real ticks how to optimize and test!
When working, an expert uses position accounting in any mode, both netting (there can be only one position for one symbol) and with independent position accounting or hedging (there can be many positions for one symbol).
Configurable bot parameters TypeFilling - Type of e

This is a multicurrency and multitimeframe indicator that calculates the angle between two points. Points for measuring the angle can be taken from the ZigZag (the last two points), or from the Moving Average (between two given bars), or it can be the closing prices of bars.
Angle measurement is possible in degrees or in radians. You can select the scale for the calculation. For a better understanding of the indicator, you can study the free Angle High Low indicator. In the parameters you can

Trailing Uses Standard Deviation.
A daptive_Trailing_uses_StdDev_Indicator is an indicator of directional movement that allows you to identify a trend at the time of its inception and set the levels of a protective stop.
Unlike trailing with a constant distance, the indicator uses the distance to the price proportional to the current standard deviation of StdDev. The distance is equal to the product of the standard deviation and the constant coefficient set by the user.
Thus, the traili

Navigators is a great tool for detecting peaks and valleys on a chart. This indicator uses a modified peak and trough detection algorithm. This algorithm includes the Fractals indicator and the ZigZag indicator.
This tool should be used to analyze peaks and valleys, as well as to detect patterns, or for other purposes. You can use this powerful tool for your own purposes at your own risk.

Using this indicator, you can anticipate the future price behavior of a certain number of bars. The indicator draws a line showing simulated future price values. You can use this information both for entering / exiting the market. So for the installation / correction of stops accompanying the position.
The indicator has several parameters. HistoricBars - The number of historical bars to analyze. FutureBars - The number of bars to predict the price. Prediction - prediction depth coefficient.
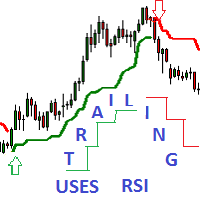
Adaptive Trailing uses RSI Indicator - an indicator of directional movement that allows you to determine the trend at the time of its inception and set the levels of a protective stop.
Trailing can be carried out both from below, when the stop level is below the current price and is pulled up behind the price if it increases, and above, when stop levels are above the current price.
There are two modes for calculating the stop level. Simple trailing is done with a constant distance of Npoint

KT CCI Divergence shows the regular and hidden divergence created between the price and CCI oscillator. Divergence is one of the vital signals that depicts the upcoming price reversal in the market. Manually spotting the divergence between price and CCI can be a hectic and ambiguous task.
Limitations of KT CCI Divergence
Using the CCI divergence as a standalone entry signal can be risky. Every divergence can't be interpreted as a strong reversal signal. For better results, try to combine it

Появилось желание торговать движение, пробой на самой высокой волатильности, или запустить советника-усреднителя торговать боковик в тихой низковолатильной гавани тогда этот продукт для Вас! Индикатор анализирует 28 валютных пар (основные и кроссы) и в зависимости от выбранных настроек покажет самые высоковолатильные (max) или наоборот (min). Как измерить волатильность? Существует 2 способа. Первый это измерить рендж заданного количества последних баров (bar). Второй замерить
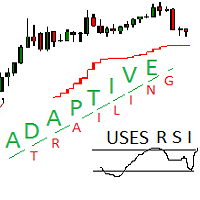
Adaptive trailing uses rsi
Adaptive trailing uses rsi - это скрипт, который реализует трейлинг, а именно: вычисляет уровень защитного стопа, отображает уровни на графике, исполняет заданные пользователем торговые операции при достижении ценой стоп уровня. Режимы работы. Трейлинг может осуществляться как снизу, когда уровень стопа ниже текущей цены и подтягивается за ценой, если она возрастает, так и сверху, когда уровни стопа выше текущей цены. Предусмотрено два режима расчета стоп уровня

The Trend Line PRO indicator is an independent trading strategy. It shows the trend change, the entry point to the transaction, as well as automatically calculates three levels of Take Profit and Stop Loss protection
Trend Line PRO is perfect for all Meta Trader symbols: currencies, metals, cryptocurrencies, stocks and indices Advantages of Trend Line PRO Never redraws its signals The possibility of using it as an independent strategy It has three automatic levels Take Profit and Stop Loss lev

Ao tomar decisões comerciais, é útil confiar não apenas em dados históricos, mas também na situação atual do mercado. Para tornar mais conveniente monitorar as tendências atuais do movimento do mercado, você pode usar o indicador AIS Current Price Filter . Esse indicador leva em consideração apenas as variações de preço mais significativas em uma direção ou outra. Graças a isso, é possível prever tendências de curto prazo em um futuro próximo - não importa como a situação atual do mercado se d
Gridingale é um novo Expert Advisor complexo que combina grelha e martingale. Irá criar uma grelha de ordem de acordo com as definições, mas também adicionar um martingale sobre ela. Por isso, terá lucros em pequenos e grandes movimentos. Um sistema de cobertura de perdas é integrado para permitir a recuperação de encomendas que estão demasiado distantes do preço actual. É possível filtrar a abertura de um novo ciclo com um indicador. Pode funcionar em ambos os lados ao mesmo tempo, mas é inter

Conselheiro MTF Qristalium Average criado em conjunto com o programador Alexander Гаврилиным. Este sistema é totalmente automatizado. Não é um martingale. Aqui funciona média.
Funciona em todos os pares de moedas.
Na ae envolvidos em três regras: 1)o comércio é apenas uma tendência, 2)"da compra, quando tudo o que vender e vender, quando todo mundo está comprando", 3) o Preço sempre vai contra a multidão.
MTF Qristalium Average filtra os dados da regra de vários таймфреймам com a ajuda

Distribuições sustentáveis podem ser usadas para suavizar séries financeiras. Como uma história bastante profunda pode ser usada para calcular os parâmetros de distribuição, essa suavização, em alguns casos, pode ser ainda mais eficaz em comparação com outros métodos.
A figura mostra um exemplo da distribuição dos preços de abertura do par de moedas EUR-USD no período H1 por dez anos (Figura 1). Parece fascinante, não é?
A principal idéia subjacente a esse indicador é determinar os pa

A IDEIA PRINCIPAL. Primeiro de tudo, este é o segundo de uma família de EA, com base na mesma estratégia aplicada a diferentes indicadores. Isso significa que a mesma estratégia e a mesma administração de dinheiro são aplicadas a diferentes indicadores com filtragem principal de spread. O objetivo final é projetar um EA com maior taxa de sucesso possível, com menores perdas em geral. Essa peculiaridade aumentará a confiança no uso do EA, para satisfação a longo prazo.
A ESTRATÉGIA 1. ESTRATÉG
MeetAlgo RSI Trade EA MT5 trades using the RSI Indicator. It offers many customizable RSI trading scenarios and flexible position management settings, plus many useful features like customizable trading sessions, a martingale and inverse martingale mode. [ Installation Guide | Update Guide | Submit Your Problem | All Products ]
Functions Easy to use and customizable RSI setting. Customizable indicator settings Built-in money management Grid trading when trade in Loss Customizable break-
FREE

This indicator will show a vertical representation of the volume distribution within a selected user range.
This is a free version of the full product. It is limited to use on a week old data or older. Find the full product at https://www.mql5.com/en/market/product/42234 .
Main features: This Indicator will create an image that will allow viewing the tick volume per price level in a graphical form. The indicator will work on any range size in any time-frame, limited only by your computer m
FREE

CAP Moving Average EA MT5 trades using the Moving Averages Indicator. It offers many customizable Moving Averages trading scenarios and flexible position management settings, plus many useful features like customizable trading sessions, a martingale and inverse martingale mode. [ Installation Guide | Update Guide | Submit Your Problem | FAQ | All Products ]
Functions Easy to use and customizable Moving Average setting. Customizable indicator settings Built-in money management Grid
FREE

O Expert Advisor Raikow FX EA opera usando a estratégia Vegas Tunel, que consiste em níveis de fibonacci acima e abaixo da média móvel de 169 períodos. Pode operar em tendência e contra tendência.
Possui controle de margem, limite de ordens abertas, controle de swap positivo e indicadores de filtro como RSI e ADX.
Ele também possui take profit fixo e dinâmico nos níveis de fibonacci e trailling stop.
Para mais informações, visite nosso grupo Telegram https://t.me/RaikowFXEA .

Indicator SR levels true in small time frames is very useful for scalping while in bigger ones it is good for day or position trading.
SR levels true can draw 4 support/resistance levels based on defined maximum rebouds from price level. Indicator scans defined number of bars in time axis and defined number of pips in price axis (both sides - up and down) and calculates how much times price was rejected from scanned price levels. At the price levels where maximum rebounds are counted, support
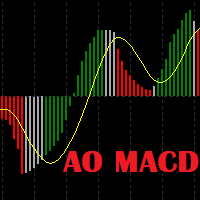
Awesome Oscillator Moving Average Convergence/Divergence Indicator. Not late as AO and not noisy as MACD. The basic version of the indicator is presented. The "PRO" version is under development with such features as sending signals to e-mail and plotting divergence and convergence lines on the chart.
Input parameters: Fast: short EMA Slow: long EMA Signal: signal line Colors: Red: MACD < Signal Green: MACD > Signal Gray: MACD above Signal, but lower than the previous MACD MACD below Signal, bu

Простой индикатор, показывающий цены Bid и Ask. Есть настройки отображения информации и возможность перетаскивать панель. Индикатор используется для наглядного отображения цен покупки и продажи актива.
Входные параметры : Support - Ссылка, на помощь проекту heigth - Высота формы width - Ширина формы size - Размер текста bidcol - Цвет текста bid askcol - Цвет текста
FREE

Basket trading /Basket SL TP Automatic SL TP Calculation
This utility will calculate SL and TP based on 2 input parameters
PerUnitTP -This means what is per .01 TP like 1 $ per .01 Lot. SLToTP_Ratio-This what is ration SL to TP if this parameter is 3 that means if TP is 1 $ then SL will be 2$ (per .01 Lot)
so if total portfolio summing to .05 lot that that means TP will be automatically become 5 $ and SL become 10 $.
This is very good utility when you want set SL TP for many open t
Expert Advisor de la conocida estrategia LongShot. La estrategia combina los movimientos del precios con el canal de Donchian y usa dos medias móviles para la toma de posiciones así como la magnitud en los cambios en los precios usando un oscilador. El EA está diseñado para hacer tanto swing como scalping. Antes de usarlo es necesario tener en cuenta que los parámetros que vienen por defecto corresponden a una optimización determinada, para una operativa tendencial en gráficos de 1h, pero puede

Shadow Height mt5 Indicador de sombra.
Exibe o tamanho das sombras do castiçal, em pontos, como um histograma. Funciona em dois modos, selecionáveis pelo usuário. Descrição das configurações do indicador Modo - modos de operação do indicador, dois modos: primeira altura - modo de exibição para as sombras do castiçal superior e inferior; a segunda diferença é o modo de exibição da diferença nas sombras do castiçal, a diferença entre as sombras superior e inferior do castiçal.
FREE

A IDEIA PRINCIPAL. Primeiro de tudo, este é o segundo de uma família de EA, com base na mesma estratégia aplicada a diferentes indicadores. Isso significa que a mesma estratégia e a mesma administração de dinheiro são aplicadas a diferentes indicadores com filtragem principal de spread. O objetivo final é projetar um EA com maior taxa de sucesso possível, com menores perdas em geral. Essa peculiaridade aumentará a confiança no uso do EA, para satisfação a longo prazo.
A ESTRATÉGIA 1. ESTRATÉG

Mt5 To InterativeBrokers Copier allows you to copy deals from MT5 account to Interactive Brokers. With this, you can run your EA strategy on a MT5 Demo/Real Account, then copy all the deals to Interactive Brokers account real time. Features:
1. Copy or Invert-Copy deals Realtime from MT5 to IB Account.
2. Synchronizing positions of both accounts periodicaly, in case any missing copying.
3. You can choose only Buy position or Sell position. Symbols Setup:
General Format: {MT Symbol} -> {

This indicator will show a vertical representation of the volume distribution within a selected user range. For a free demo version go to https://www.mql5.com/en/market/product/42482 . Main features: This Indicator will create an image that will allow viewing the tick volume per price level in a graphical form. The indicator will work on any range size in any time-frame, limited only by your computer memory and performance. Recommended time-frames are: M1 to H1.
Inputs:
Price Calculated -

Moon 3 is a Trend indicator. I s a powerful indicator of TREND for any par and any timeframe. It doesn't requires any additional indicators for the trading setup.The indicator gives clear signals about opening and closing trades.This Indicator is a unique, high quality and affordable trading tool.
Perfect For New Traders And Expert Traders Low risk entries. Never repaints signal. Never backpaints signal. Never recalculates signal. For MT5 Only Great For Scalping Great For Swing Trading Arro
Esta é a nossa ferramenta mais simples! Com ela você oculta as linhas de preço Bid e Ask do gráfico e tem somente um pequeno retângulo informando qual é o preço atual. Essa ferramenta é útil para aqueles que querem o gráfico mais limpo possível. Também é possível exibir apenas o preço Ask, ao invés do Bid (mais comum). Para ajudá-lo ainda mais na limpeza do gráfico confira nossa outra ferramenta: https://www.mql5.com/pt/market/product/41835 Qualquer dúvida ou sugestão, por favor, nos contate. F
FREE
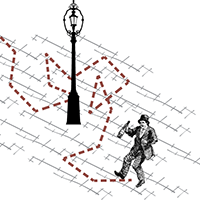
The script simulates a random price walk and saves it to a CSV file.
This file can be used to create charts of random price walk.
How to create custom symbols you can read here .
Script Settings:
SymName - The name of the CSV file that will be saved in MQL5/Files.
HistoryDepth - The number of minutes to simulate a random price walk.
StartFrom - At which price the simulation will start.
VolaCycle - Mode simulates intraday volatility.
The pictures show the recommended settin
FREE

Several assets in several markets have the behavior of using specific numbers as Force Numbers, where support, resistance and price thrust is created. Let this indicator draw those levels of support and resistance for you. You can also stack it to show different level of Prices! This technique is being used by Tape Readers and Order Flow traders all over the world for a long time. Give it a try. Challenge yourself to study new ways of Price Action!
SETTINGS
What Price reference to use in th
FREE

The Willing horse Expert Advisor EURUSD trades on the signals of the Moving Average, Stochastic Oscillator, Average True Range indicators; uses a variety of intelligent strategies, without martingale, hedging or grid; applies stop loss to protect your capital; there is a capital management system, it has restrictions on the volume of trading positions (in% of the deposit). This advisor does not require adjustment, just attach it to the M1-chart of EURUSD. You can test any period from 01/01/2018.

KT Bollinger Bands Trader is a 100% automated expert advisor that's incorporated a mean reversion trading strategy using the Bollinger bands during the period of low volatility. Price often reacts at the upper or lower line of Bollinger bands, but a reversal not always occurs. However, there is more chance of price reversal during the time of low volatility.
Entries A buy trade is activated when price correctly aligns below the bottom line of Bollinger bands. A sell trade is activated when pri

Trailing Stop Fast Trailing Stop Fast EA locks trade profit once trade moves in profit by certain points(eg 100 points) by moving the Stop Loss in direction of trade.
There are three inputs in EA to be provided by user to EA TrailingStart this input used as activator when trade moved 100 points towards profit, this EA will start shifting your stop loss towards profit.
TrailingStop input defines what should be the distance of stop loss from current market price once TrailingStart activat

Basket trading /Basket SL TP/Portfolio SL TP/ Group Trade SL TP
This is very good utility when you want set SL TP for many open trades or portfolio
As soon your account equity reach SL or TP , This EA will close all trades . you are allowed to change SL and TP any time.
Also you need not to monitor group trades all the time you just set SL and TP in utility and relax once SL / TP situation will come all trades will be closed automatically.
SL and TP are in $Amount like 100$ SL and 500
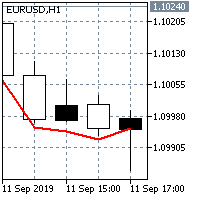
SEMA is the Sextuple Exponential Moving Average:
SEMA = PEMA + QEMA(y - PEMA)
The principle of its calculation is similar to Double Exponential Moving Average (DEMA). The name "Sextuple Exponential Moving Average" does not very correctly reflect its algorithm. This is a unique blend of the single, double, triple, quadruple and pentuple exponential smoothing average providing the smaller lag than each of them separately. SEMA can be used instead of traditional moving averages. It can be use

Signal: https://www.mql5.com/en/signals/2021117 Manual: https://www.mql5.com/en/blogs/post/751386 NZDJPY H1 Settings: https://files.fm/f/uztbgjkt5p
Multi Strategist (MS) is a strategy scanner and fully automated multi-currency Expert Advisor. This Expert advisor offers a streamlined framework for strategy scanning. On top of that MS is capable of utilizing those strategies for live trading including: multiple layers of strict risk/drawdown management info panels providing detailed info ab

Este indicador permite determinar a probabilidade de o preço atingir um ou outro nível. Seu algoritmo é bastante simples e baseia-se no uso de dados estatísticos nos níveis de preços de um par de moedas específico. Graças aos dados históricos coletados, é possível determinar até que ponto o preço será alterado durante a barra atual. Apesar de sua simplicidade, este indicador pode fornecer assistência inestimável na negociação. Assim, com sua ajuda, é possível determinar os níveis TakeProfit e S

O Indicador 3 Automatic Vwap (Midas) pode ser usado para quem estuda Preço e Volume para mapear o movimento de quem direciona o mercado. Ele plota automaticamente 3 Vwaps sendo que duas delas são dinâmicas e vão sendo atualizadas no decorrer do dia, se novas máximas ou novas mínimas surgirem. A terceira Vwap é diária e pode ajudar se a tendência é de alta ou baixa.
Ainda, foi inserido um indicador auxiliar que plota pontos de interesse (também dinâmicos) com os preços OHLC (Open, High e Low do

Introduction to X3 Chart Pattern Scanner X3 Cherart Pattern Scanner is the non-repainting and non-lagging indicator detecting X3 chart patterns including Harmonic pattern, Elliott Wave pattern, X3 patterns, and Japanese Candlestick patterns. Historical patterns match with signal patterns. Hence, you can readily develop the solid trading strategy in your chart. More importantly, this superb pattern scanner can detect the optimal pattern of its kind. In addition, you can switch on and off individu

Easily get all relevant economic events of the current day right into your chart, as markers. Filter what kind of markers do you want: by country (selected individually) and by Importance (High relevance, Medium, Low or any combination of these). Configure the visual cues to your liking. If there is more than one event set to the very same time, their Names will be stacked and you will see the messages merged with the plus (+) sign on the marker. Obviously that long or too much events on the sam
FREE

Apollo 2 The wall It is an advanced trading system. This is a fully automatic Expert Advisor, which allows you to presize the trade according to the preferences of the trader. Apollo 2 have more customization options for your trade. Different options for different styles of trade. Apollo 2 the wall is a break system of trade with different algorithm of trade mode. This EA using signals to place orders. Is a revolution in the customization of the trading. The algorithms developed for the id

Para quem gosta de tendencia Force será um indicador muito útil. Isso por que ele é baseado no famoso ADX, que mede a força de uma tendencia, porém sem as 3 linhas confusas dele. Force tem sua interpretação muito simples: se o histograma estiver acima do nível zero a tendência é de alta, do contrário é queda. Você pode utilizá-lo para encontrar divergências também, algo muito lucrativo. Agradeço ao Andre Sens pela ideia da versão 1.1. Se tiver alguma dúvida ou sugestão, por favor, mecontate. Faç
FREE
The system is based on signals from three indicators: Ichimoku Kinko Hyo indicator Stochastic Williams Fractals Each indicator works on its own timeframe. Note : input defaults are not optimized. Test the expert on a demo and configure the input parameters in accordance with the acceptable risk and goals.
INPUT PARAMETERS Magic Number
Every Tick (false - Every Bar)
Inputs for main signal: The threshold value of the signal to open [0...100]
The threshold value of the signal to close [0...10
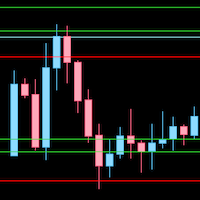
Desenha níveis de suporte e resistência baseado nas altas/baixas ou fechamento do diário, semanal ou mensal. Este indicador utiliza as altas, baixas ou fechamentos para desenhar linhas horizontais no gráfico. Ao observar essas linhas você pode identificar tendência (ganhando ou perdendo níveis de suporte/resistência) e encontrar bons níveis de entrada para seus trades. Para traders que utilizam price action como método, esse indicador é essencial.

This EA uses a variety of strategies and functions such as neural network grid scalping, mobile stop loss, automatic lot number setting, etc. Use revolutionary price model algorithms, price behavioral trading, and signature collaborative work with artificial intelligence adaptive processing units. The system adopts some kind of reverse sampling development method, which makes the system show a very substantial benefit in the 13-year historical backtesting. Profit drivers to keep profits maximiz

Como o próprio nome já diz, este é um oscilador de exaustão. Porém, talvez você se pergunte: o que o difere de outros osciladores como RSI, Stocástico, CCI etc? A diferença é que o nosso é mais poderoso e preciso! Nosso oscilador filtra o ruído causado por outros osciladores, e te mostra somente o momento exato de entrar na operação. Claro que utilizá-lo sozinho, como qualquer outro indicador, tem seus riscos. O ideal é conciliá-lo com análise técnica e/ou outros indicadores. Comprando você ganh

ChannelRSI5 O indicador Relative Strength Index (RSI) com níveis dinâmicos de zonas de sobrecompra e sobrevenda.
Os níveis dinâmicos mudam e se ajustam às mudanças atuais no indicador e nos preços e representam uma espécie de canal.
Configurações do indicador period_RSI - Período médio para calcular o índice RSI. Applicated_RSI - O preço aplicado. Pode ser qualquer uma das constantes de preço: PRICE_CLOSE - Preço de fechamento, PRICE_OPEN - Preço de abertura, PRICE_HIGH - Preço máximo para o
FREE

Este é um indicador de volume convencional, que exibe o volume de ticks ou o volume real (se disponibilizado pela sua corretora). Porém ele tem outros recursos como: 5 esquemas de cores: única, ao cruzar com média móvel, ao cruzar um nível especificado, ao ter diferença de volume entre as barras e conforme a cor das velas. Poder ter uma média móvel personalizável. Poder ter a linha indicativa de valor. Agradeço ao Diego Silvestrin pelas ideias da versão 1.1 e ao Konstantin Demidov pela sugest
FREE

Easy Market torna o mercado mais fácil de operar. Ele te proporciona ver um mercado "eternamente" lateral (sem tendência), tornando extremamente fácil ver quando o preço está sobre comprado ou sobre vendido. Tanto quem gosta de operar tendência quanto mercado consolidado irá gostar do Easy Market. Você pode usá-lo como uma janela auxiliar (em baixo do gráfico) ou em modo tela cheia. Veja as capturas de tela e note como ele te dá entradas precisas! Se tiver alguma dúvida ou sugestão, por favor, n

MOON 2 THE WALL is a Oscilator indicator. I s a powerful indicator of TREND for any par and any timeframe. It doesn't requires any additional indicators for the trading setup.The indicator gives clear signals about opening and closing trades.This Indicator is a unique, high quality and affordable trading tool.
Perfect For New Traders And Expert Traders Low risk entries. Never repaints signal. Never backpaints signal. Never recalculates signal. For MT5 Only Great For Scalping Great For Swi

Imagine VWAP, MVWAP and MIDAS in one place... Well, you found it! Now you can track the movement of Big Players in various ways, as they in general pursue the benchmarks related to this measuring, gauging if they had good execution or poor execution on their orders. Traders and analysts use the VWAP to eliminate the noise that occurs throughout the day, so they can measure what prices buyers and sellers are really trading. VWAP gives traders insight into how a stock trades for that day and deter
FREE

TickChart Indicator plots tick line on the main window of MetaTrader.
In the Lite version, the number of ticks is limited to 20 and the alert function described below is omitted. The tick-line shows the most detailed, fastest and real-time activities of the market, which are usually hidden in bars or candles longer than 1 minute. Usually, several new tick-line segments appear while a bar of M1 time frame is completed. After the release of an important economic indicator, the number of ticks pe
FREE
TickChart Indicator plots tick line on the main window of MetaTrader. ( Free version of this is "TickChart Indicator Lite" )
The tick-line shows the most detailed, fastest and real-time activities of the market, which are usually hidden in bars or candles longer than 1 minute. Usually, several new tick-line segments appear while a bar of M1 time frame is completed. After the release of an important economic indicator, the number of ticks per bar may exceeds 100. This indicator overlays the tic

Você está cansado de ficar apagando os objetos do gráfico e depois ter que colocá-los de novo? E se você tivesse uma ferramenta que te possibilite ocultar e exibir todos os objetos quando você quiser? Legal, né? Por isso desenvolvi essa ferramenta em forma de indicador. Com ela você oculta todos os objetos utilizando um botão de atalho no gráfico ou pelo teclado (configurável). Se tiver alguma sugestão ou encontrar algum erro, por favor, nos contate. Faça bom uso!
FREE

Pivot levels indicator shows 7(9 for Camarilla) pivot levels. It is adjusted for major use, including: all standard time frames
choice of periods to show four popular calculation formulas (typical, median, weighted and Camarilla)
pivot day shift choice of properties for lines and labels choice of showing alerts when crossing pivot lines Parameters: ----------Main parameters----------- Timeframe - time frame for pivot levels
Number of periods to show - displays pivot levels for number of perio

DYJ ArtOfMakingMoney attempts to gauge bullish and bearish forces in the market by using two separate measures, one for each type of directional pressure. The EA's BearsIndex attempts to measure the market's appetite for lower prices
The EA's BullsIndex attempts to measure the market's appetite for higher prices Input: m_magic = 54289721 -- magic number InpTF = PERIOD_H1 -- TimeFrame InpLots = 0.01 - - Lots InpLotsExponent = 1 -

KT MACD Divergence shows the regular and hidden divergences build between the price and oscillator. If your trading strategy anticipates the trend reversal, you can include the MACD regular divergence to speculate the potential turning points. And if your trading strategy based on the trend continuation, MACD hidden divergence would be a good fit.
Limitations of KT MACD Divergence
Using the macd divergence as a standalone entry signal can be a risky affair. Every divergence can't be interpr

Encontrou um ótimo sinal, mas o lote de um provedor é muito pequeno? Você precisa de um volume de posição maior, mas as configurações do terminal são muito ruins? O Signal Lot Manager aumentará o volume da posição do provedor por meio de uma ordem duplicada do volume necessário. Basta definir um tamanho de lote e um nome de sinal para copiar pedidos. O Signal Lot Manager é um utilitário multiplicador de lotes para duplicar pedidos em seu terminal. A fonte pode ser selecionada por qualquer consul

"TPA Sessions" indicator is a very important tool to complement "TPA True Price Action" indicator . Did you ever wonder, why many times the price on your chart suddently turns on a position you can't explain? A position, where apparently no support or resistance level, or a pivot point, or a fibonacci level is to identify? Attention!!! The first run of the TPA Session indicator must be in the open market for the lines to be drawn correctly.
Please visit our blog to study actual trades wit
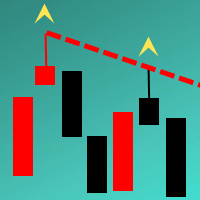
The Indicator automatically draws trend lines on the specified timeframe ( Trend lines period parameter). The lines are drawn based on the last two known fractals of the specified period. If you want the lines to be drawn only on the confirmed fractal, then set the Confirmed or unconfirmed fractal parameter to True . Indicator feature - lines are drawn with the accuracy of any timeframe. It allows analyzing the chart on smaller timeframes without loosing the precision of drawing the lines in re
O Mercado MetaTrader é o melhor lugar para vender robôs de negociação e indicadores técnicos.
Você apenas precisa desenvolver um aplicativo para a plataforma MetaTrader com um design atraente e uma boa descrição. Nós vamos explicar como publicar o seu produto no Mercado e oferecer a milhões de usuários MetaTrader.
Você está perdendo oportunidades de negociação:
- Aplicativos de negociação gratuitos
- 8 000+ sinais para cópia
- Notícias econômicas para análise dos mercados financeiros
Registro
Login
Se você não tem uma conta, por favor registre-se
Para login e uso do site MQL5.com, você deve ativar o uso de cookies.
Ative esta opção no seu navegador, caso contrário você não poderá fazer login.