MP Custom Levels for MT5
- 유틸리티
- 버전: 1.0

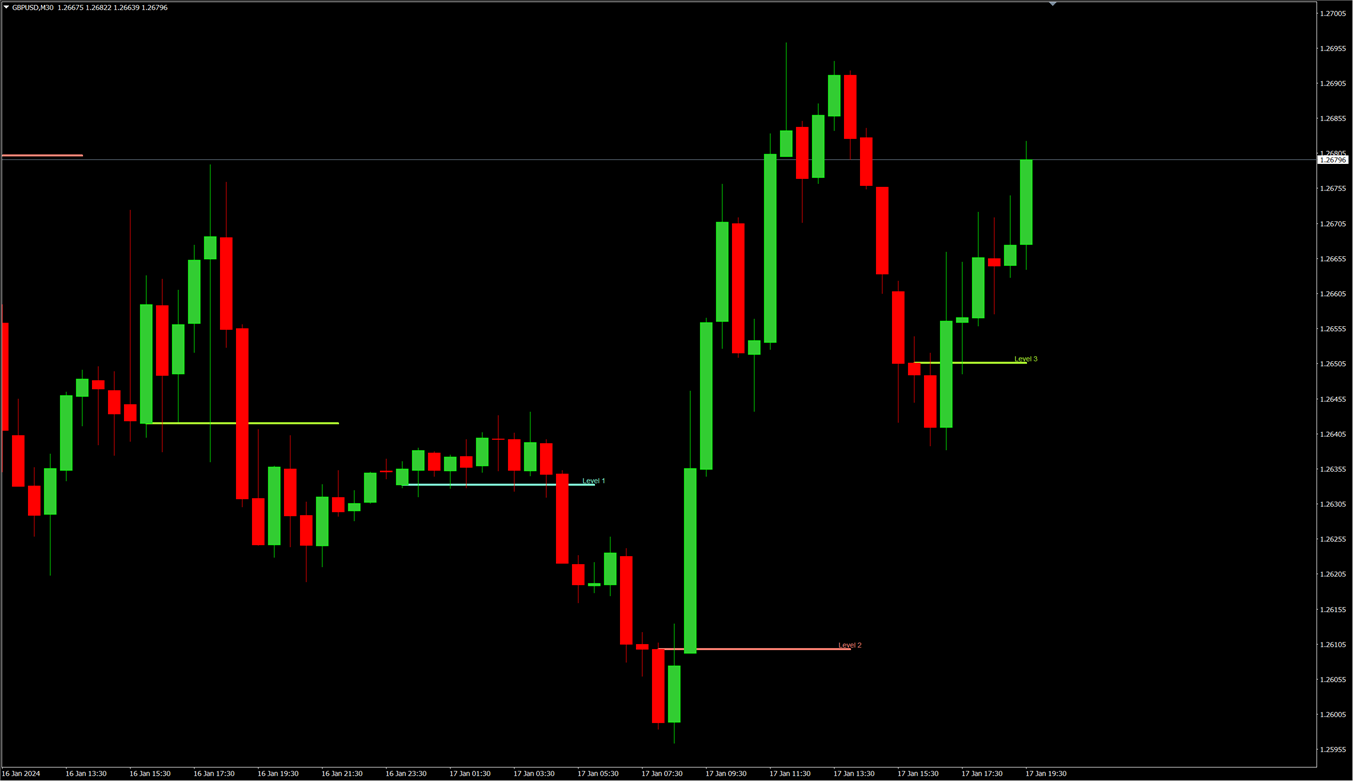
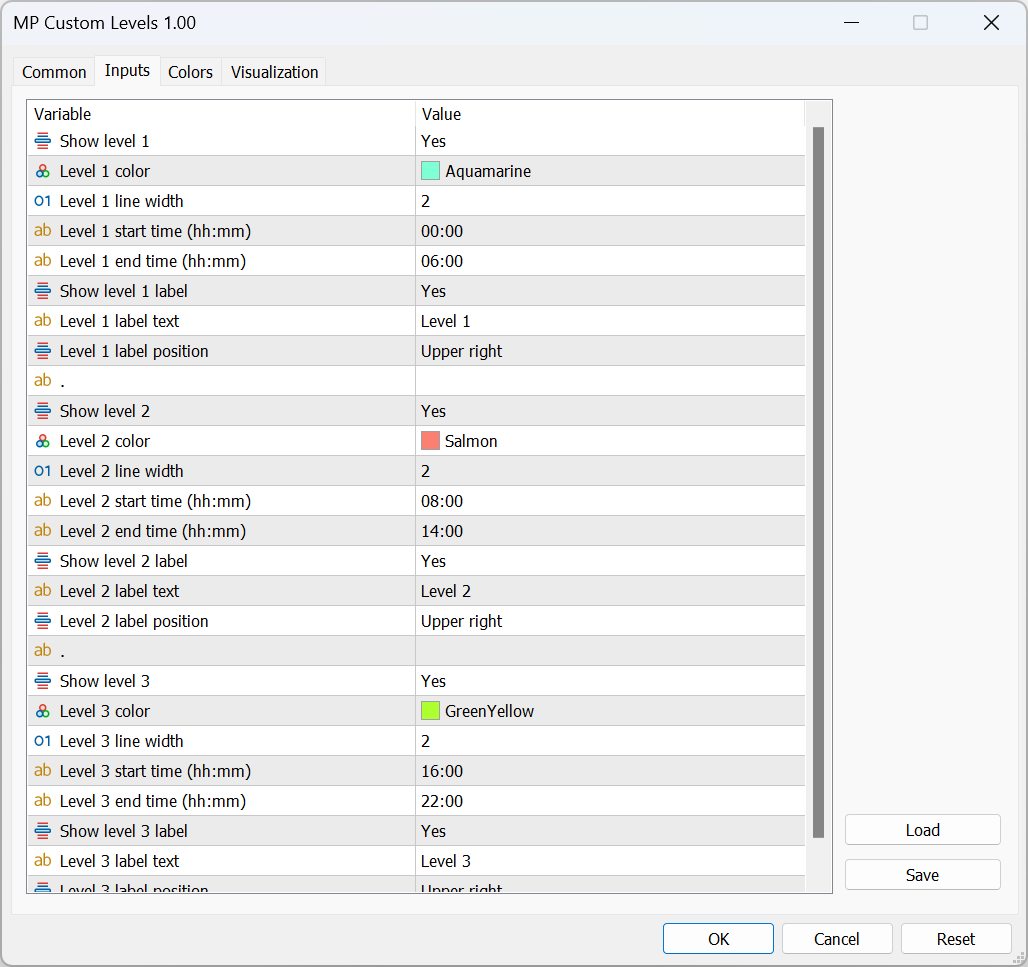
This utility identifies certain candle open times on chart, this can help you to see your favorite candle open and use it as it fits in your strategy.
This tool is very useful for intraday charting and indicating your sessions.
___________________________________________________________________________________
Disclaimer:
Do NOT trade or invest based upon the analysis presented on this channel. Always do your own research and due diligence before investing or trading. I’ll never tell you what to do with your capital, trades or investments. I’ll also never recommend for you to buy, sell, long or short any asset, commodity, security, derivative or cryptocurrency related instrument as it's extremely HIGH RISK! You should always consult with a professional/licensed financial adviser before trading or investing in any type of assets.
사용자가 평가에 대한 코멘트를 남기지 않았습니다