Range Exhaustion MT5
- Indicateurs
-
Robert Gerald Wood
 Développeur de logiciels professionnel depuis plus de 25 ans, je crée maintenant des outils pour moi-même et les partage avec la communauté au sens large.
 - Version: 1.0
- Activations: 10
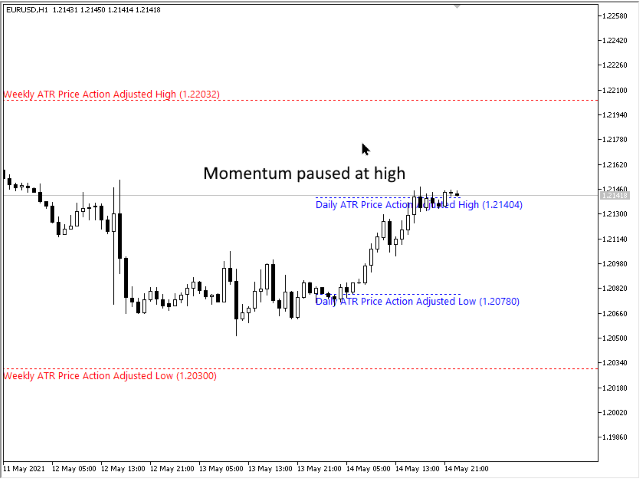
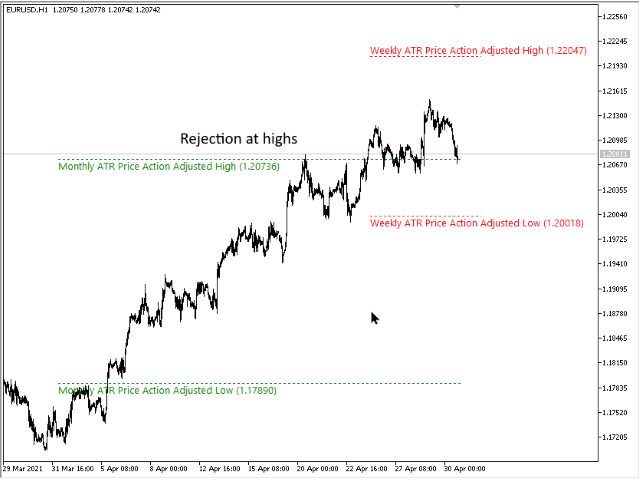
L'épuisement de la fourchette se produit lorsque le prix atteint ou dépasse la fourchette attendue pour la période en cours. À ces niveaux, le prix commence à perdre son élan par rapport au début de la période, c'est donc un bon point pour vous assurer que vous ne prenez pas de nouvelles positions.
Cet indicateur vous montrera où cela est susceptible de se produire sur votre graphique, montrant les niveaux pour les périodes quotidiennes, hebdomadaires et mensuelles.
Lorsque vous voyez un prix dépasser ces niveaux d'épuisement, cela vous indique que l'élan derrière le mouvement est très fort et se dirige probablement vers le niveau de délai plus élevé.
L'indicateur peut utiliser le calcul Average True Range (ATR) ou Average Range (ADR), selon vos préférences. Par défaut, nous utilisons l'ATR car nous trouvons qu'il fonctionne mieux sur les graphiques Forex, mais l'ADR a l'avantage sur les indices et symboles basés sur les actions.
L'indicateur dispose d'un certain nombre de modes de dessin, décrits ci-dessous, qui vous permettent de l'adapter à vos besoins.
PARAMÈTRES
ModeCalcul
Choisissez entre AverageTrueRange (ATR) ou AverageDailyRange (ADR) pour calculer les niveaux.
ModeDessin
L'indicateur peut s'afficher de différentes manières.
- Tirer la ligne ajustée du prix - Le niveau s'ajuste au cours de la période, en fonction des hauts et des bas atteints. Il s'agit de la méthode par défaut et la plus couramment utilisée.
- Tirage au sort maximum attendu - Le niveau est une valeur fixe, correspondant à la clôture de la dernière période plus ou moins la valeur ATR ou ADR.
- Dessinez les deux lignes - Affiche les deux lignes ci-dessus.
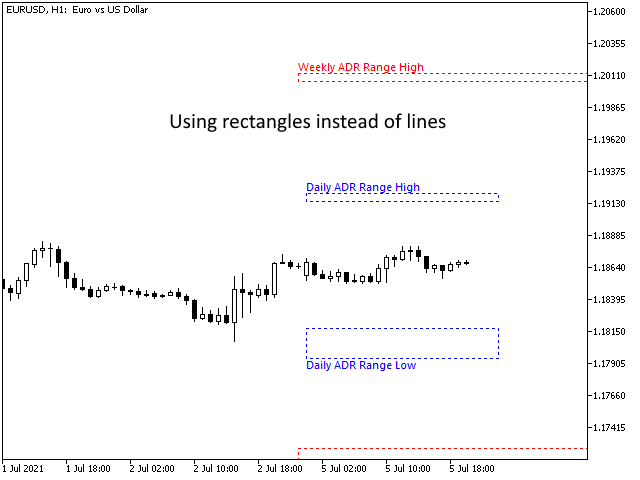
- Dessiner des rectangles - Affiche un seul rectangle où les lignes du haut et du bas sont le prix ajusté et le Max/Min prévu
Période d'examen
La période à utiliser lors du calcul des valeurs ATR/ADR.
Afficher les limites quotidiennes
Lorsque vrai, dessine les niveaux d'épuisement quotidiens.
Afficher les limites hebdomadaires
Lorsque vrai, dessine les niveaux d'épuisement hebdomadaires.
Afficher les limites mensuelles
Lorsque vrai, dessine les niveaux d'épuisement mensuels.
Afficher les descriptions
Lorsque true, dessine des étiquettes descriptives pour les niveaux. Si false, seule la ligne est dessinée, mais les lignes ont des info-bulles si vous avez besoin de savoir ce qu'elles représentent.
AfficherPrixDansDescription
Lorsque vrai, la valeur du niveau sera ajoutée à la description et à l'infobulle.
DescriptionFontSize
Taille de police à utiliser lors du dessin des descriptions
Prolonger les lignes
Lorsque true, au lieu de tracer les lignes jusqu'à la fin de la période, les lignes s'étendent indéfiniment à droite du graphique.
Les paramètres suivants apparaissent pour chaque période, D1, W1 et MN1
XX_Couleur
La couleur à utiliser lors du dessin des lignes et de la description
XX_LineWidth
La largeur de la ligne à tracer. Si LineStyle est autre que Solid, cette valeur est ignorée. Seules les lignes pleines peuvent avoir une largeur sur MetaTrader.
XX_LineStyle
Le type de ligne à tracer à partir de la sélection standard.