MFI Alerts MT5
- 지표
- 버전: 1.2
- 업데이트됨: 26 11월 2021
- 활성화: 20

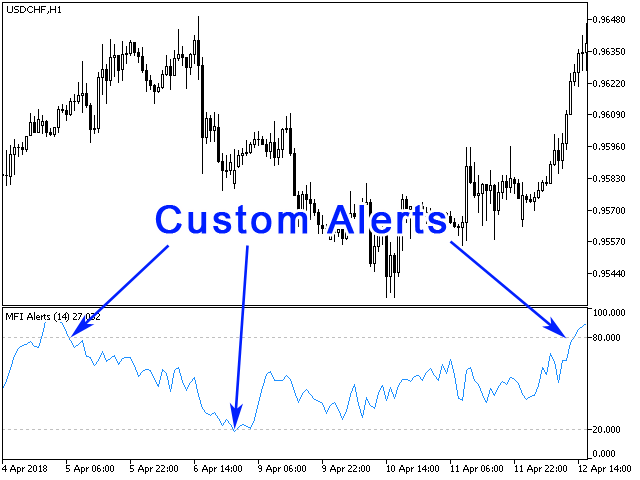
If you use the MFI (Money Flow Index) indicator, the waiting time till the next signal can be long enough. Now you can avoid sitting in front of the monitor by using MFI Alerts. This is an addition or a replacement to the standard MFI oscillator. Once there appears an MFI signal on the required level, the indicator will notify you with a sound or push, so you will never miss a signal. This is especially significant if you follow the indicator in different timeframes and currency pairs, which can be a complicated task.
If you don't know the benefits of MFI or how to use it, please read here. If you need signals of a more popular RSI indicator, use RSI Alerts. If you need the version for MetaTrader 4, see MFI Alerts.
Currently supported events
- Crossing down the upper signal level (default is 80) - a sell signal.
- Crossing up the upper signal level (default is 80) - a buy signal, or better wait.
- Crossing down the lower signal level (default is 20) - a buy signal, or better wait.
- Crossing up the lower signal level (default is 20) - a buy signal.
You can also edit the values of these levels using the Max signal level and Min signal level variables.
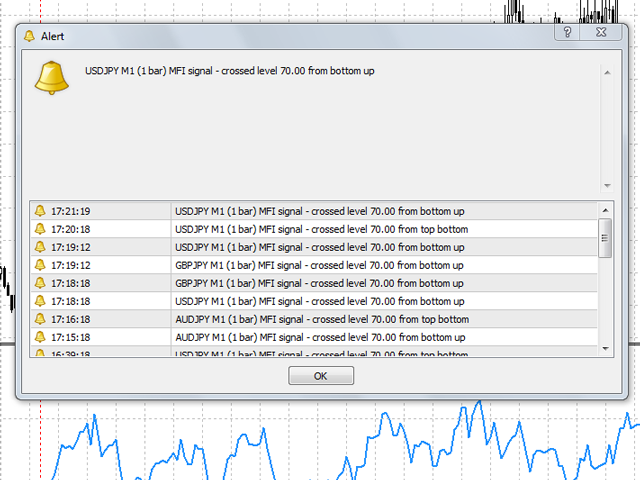
Available Alerts
- Sound signal with a pop-up message box - Alert.
- A push notification to a mobile terminal (smartphones and tablets) - Push.
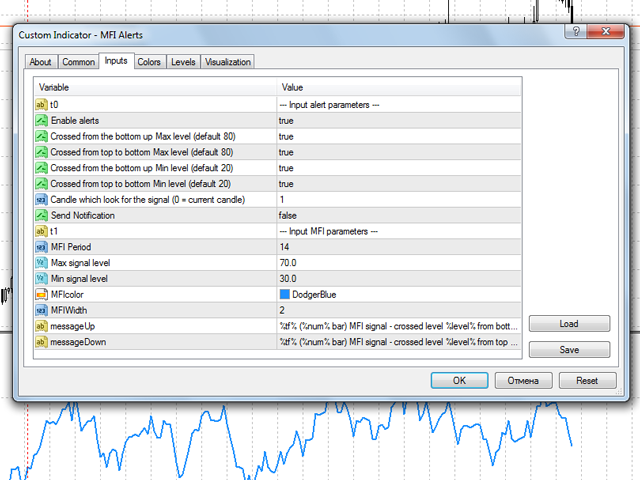
Indicator Parameters
- Enable alerts - allow sound alerts and message display on the screen.
- Crossed from the bottom up Max level (default 80) - enable alert for the indicator crossing Max signal level from bottom up
- Crossed from top to bottom Max level (default 80) - enable alert for the indicator crossing Max signal level from top down
- Crossed from the bottom up Min level (default 20) - enable alert for the indicator crossing Min signal level from bottom up
- Crossed from top to bottom Min level (default 20) - enable alert for the indicator crossing Min signal level from top to bottom
- Candle which look for the signal (0 = current candle) - the number of the candlestick, on which the signal is used (0 - current candle, 1 - previous).
- Send Notification - allow sending Push notifications to your mobile terminal.
- Send Email Notification - allow sending Email notifications to email.
- MFI Period - MFI indicator period
- Max signal level - upper signal level
- Min signal level - lower signal level
- MFIcolor - indicator color
- MFIWidth - indicator line width
- messageUp - message template for upward crossing
- messageDown - message template for downward crossing
The text in the message can be edited. Tags are used in variables messageUp and messageDown:
- %level% mean the level crossed by the indicator
- %tf% mean the timeframe from which the signal is received.
- %num% mean the number of the candlestick from which the signal is received.
If you need any additional functionality for the indicator, contact me.
works perfectly. very nice