Time Levels with Alerts
- 지표
- 버전: 1.3
- 업데이트됨: 26 11월 2021
- 활성화: 20

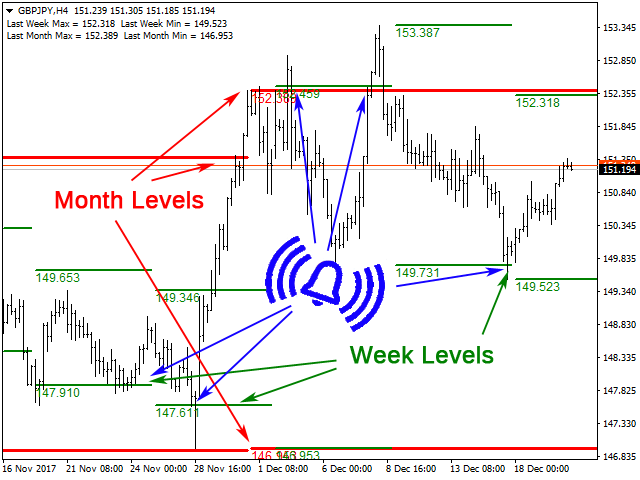
This is an expanded version of the Time Levels indicator provided with sound alerts notifying of level intersection. The indicator is designed for displaying the following price levels on the chart:
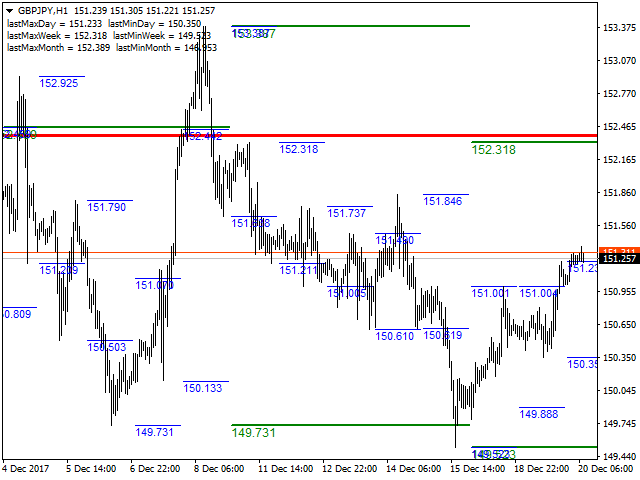
- Previous day's high and low.
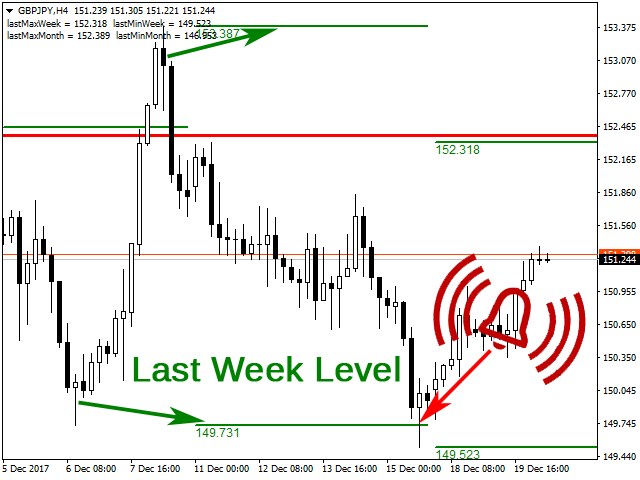
- Previous week's high and low.
- Previous month's high and low.
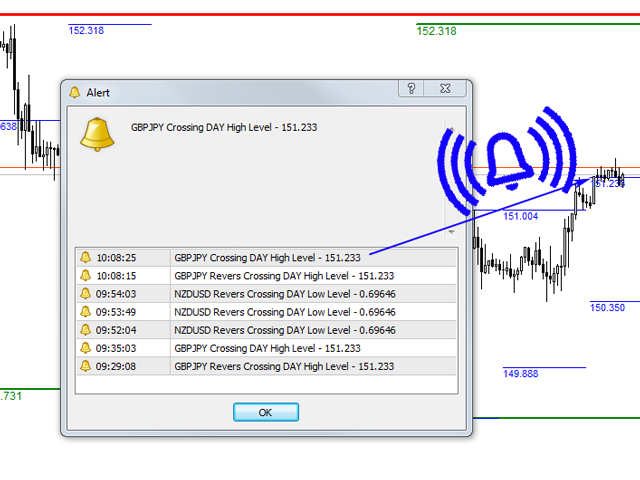
Each of the level types is customizable. In the indicator settings, you set line style, line color, enable or disable separate levels. This version is provided with an option for alerting using an audio signal and a pop-up window to notify the user about the intersection of levels, both when the price breaks the lines and returns back inside the channel formed of selected levels.
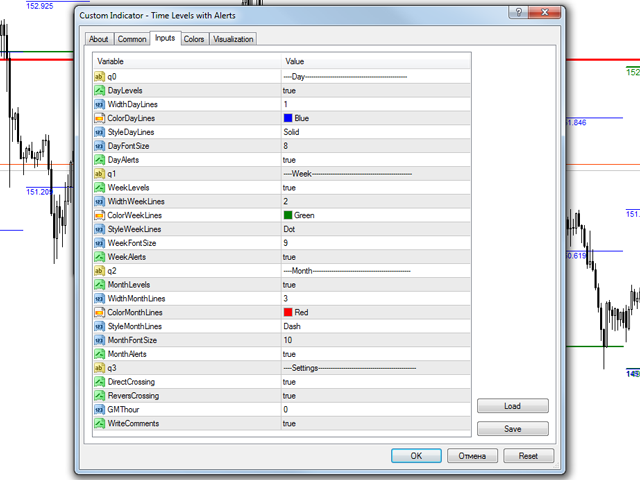
Configurations
- ----Day-------------------------------------------------
- DayLevels - enable/disable previous day's levels.
- WidthDayLines - line width of daily levels.
- ColorDayLines - line color of daily levels.
- StyleDayLines - line style of daily levels. The parameter only works if WidthDayLines =1.
- DayFontSize - font size for the daily level labels.
- DayAlerts - enables/disable alerts when the levels are crossed.
- ----Week------------------------------------------------
- WeekLevels - enable/disable previous week's levels.
- WidthWeekLines - line width of weekly levels.
- ColorWeekLines - line color of weekly levels.
- StyleWeekLines - line style of weekly levels. The parameter only works if WidthWeekLines =1.
- WeekFontSize - font size for the weekly level labels.
- WeekAlerts - enables/disable alerts when the weekly levels are crossed.
- ----Month-----------------------------------------------
- MonthLevels - enable/disable previous month's levels.
- WidthMonthLines - line width of monthly levels.
- ColorMonthLines - line color of monthly levels.
- StyleMonthLines - line style of monthly levels. The parameter only works if WidthMonthLines =1.
- MonthFontSize - font size for the monthly level labels.
- Month Alerts - enables/disable alerts when the monthly levels are crossed.
- ----Settings-----------------------------------------------
- DirectCrossing - enable / disable alerts notifying of channel breakouts.
- ReversCrossing - enable / disable alerts notifying of price returning back inside the channel.
- GMThour - terminal time zone.
- WriteComments - show text comments featuring level values.