CCI Alerts MT5
- 지표
- 버전: 1.12
- 업데이트됨: 26 11월 2021
- 활성화: 20

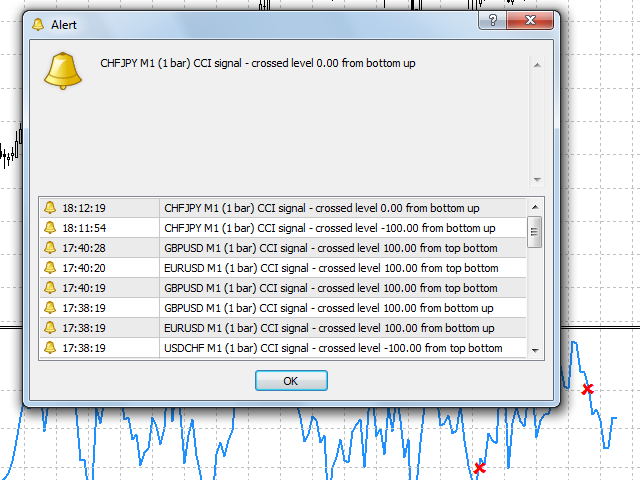
When using CCI (Commodity Channel Index) oscillator, the waiting time till the next signal can be long enough depending on a timeframe. CCI Alerts indicator prevents you from missing the indicator signals. It is a good alternative for the standard CCI indicator. Once there appears a CCI signal on the required level, the indicator will notify you with a sound or push, so you will never miss an entry. This is especially significant if you follow the indicator in different timeframes and currency pairs, which can be a complicated task.
This version of CCI Alerts is for MetaTrader 5. If you need the version for MetaTrader 4, see CCI Alerts. If you need signals of another popular RSI indicator, use RSI Alerts.
Currently supported events
- Crossing down the upper signal level (default is 100) - a sell signal.
- Crossing up the upper signal level (default is 100) - a buy signal, or better wait.
- Crossing down the lower signal level (default is -100) - a sell signal, or better wait.
- Crossing up the lower signal level (default is -100) - a buy signal.
- Crossing down the zero level (0) - a sell signal.
- Crossing up the zero level (0) - a buy signal.
You can also edit the values of these levels using the Max signal level and Min signal level variables.
Available Alerts
- Sound signal with a pop-up message box - Alert.
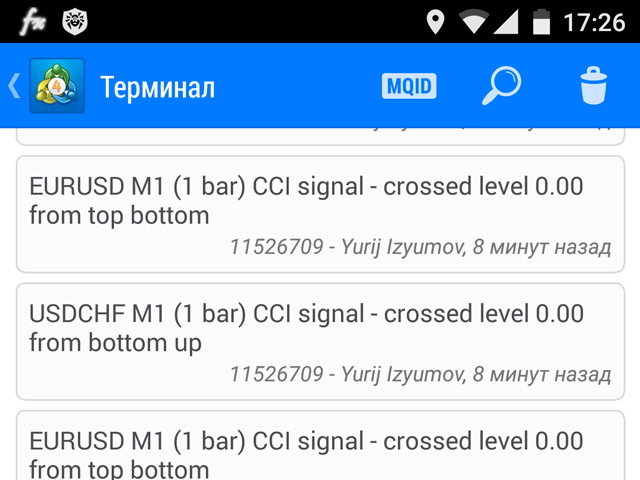
- A push notification to a mobile terminal (smartphones and tablets) - Push.
If you want to enable push notifications, you should properly configure your MetaQuotes ID in terminal settings (how to do it).
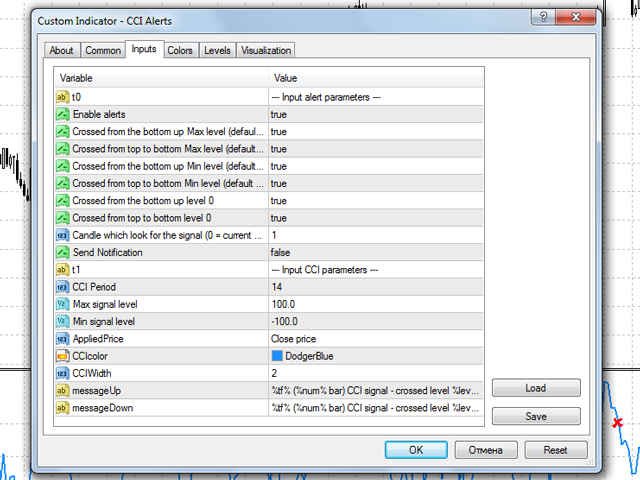
Parameters
- Enable alerts - allow sound alerts and message display on the screen.
- Crossed from the bottom up Max level (default 100) - enable alert for the indicator crossing Max signal level from bottom up
- Crossed from top to bottom Max level (default 100) - enable alert for the indicator crossing Max signal level from top down
- Crossed from the bottom up Min level (default -100) - enable alert for the indicator crossing Min signal level from bottom up
- Crossed from top to bottom Max level (default -100) - enable alert for the indicator crossing Min signal level from top down
- Crossed from the bottom up level 0 - enable alert for the indicator crossing the zero level from bottom up
- Crossed from top to bottom level 0 - enable alert for the indicator crossing the zero level from top down
- Candle which look for the signal (0 = current candle) - the number of the candlestick, on which the signal is used (0 - current candle, 1 - previous).
- Send Notification - allow sending push notifications to your mobile terminal
- CCI Period - CCI indicator period
- Max signal level - upper signal level
- Min signal level - lower signal level
- AppliedPrice – price applied for plotting the indicator
- messageUp - message template for upward crossing
- messageDown - message template for downward crossing
The text in the message can be edited. Variables messageUp and messageDown use the following tags:
- %level% mean the level crossed by the indicator
- %tf% mean the timeframe from which the signal is received.
- %num% mean the number of the candlestick from which the signal is received.
If you need any additional functionality for the indicator, contact me.
, Пока ничего не могу сказать, он не срабатывает, я написал подробно на почту автора, со своими настройками, посмотрим что ответит. Есть пересечение уровня, уведомления нет. Посмотрим.