RSI Alerts MT5
- 지표
- 버전: 1.6
- 업데이트됨: 11 2월 2026
- 활성화: 20

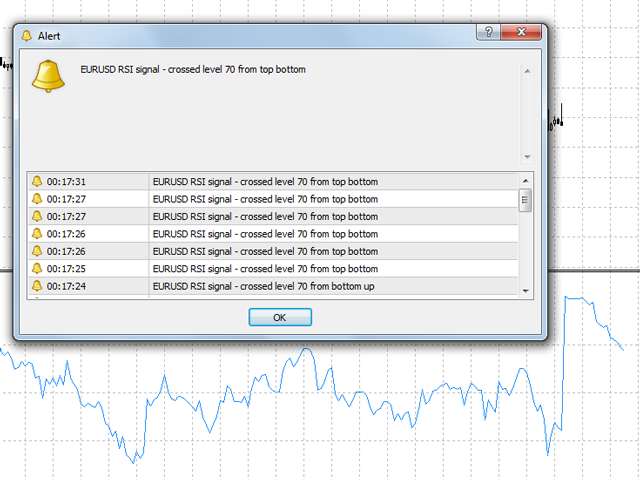
RSI Alerts는 MetaTrader 5용 지표로, 클래식 Relative Strength Index(RSI)에 편리한 알림 기능을 더합니다. RSI 선과 30, 50, 70 레벨은 그대로 보이면서, 선택한 레벨을 넘을 때 팝업 알림, 푸시 알림, 이메일을 보냅니다. 반전이나 돌파 가능성을 놓치지 않습니다.
어떤 것을 기준으로 하나요?
표준 RSI(Relative Strength Index)를 바탕으로 합니다. 수많은 트레이더가 과매수/과매도와 모멘텀 변화를 보는 데 쓰는 바로 그 오실레이터입니다. RSI Alerts는 RSI 공식을 바꾸지 않고, RSI 선만 추적해 필요한 레벨을 넘을 때 알려줍니다.
- - 과매수 구간(예: 70, 설정 가능) - 되돌림이나 숏 진입을 찾을 때 자주 씁니다
- - 과매도 구간(예: 30, 설정 가능) - 반등이나 롱 진입용
- - 중간선(50) - 추세·모멘텀 확인용
어떤 크로스를 중요하게 볼지는 전략에 맞게 선택하면 됩니다.
주요 기능
- - 6가지 독립 알림 - 각각 켜기/끄기 가능:
- - RSI가 레벨 70을 아래에서 위로 크로스(과매수)
- - RSI가 레벨 70을 위에서 아래로 크로스
- - RSI가 레벨 30을 아래에서 위로 크로스(과매도)
- - RSI가 레벨 30을 위에서 아래로 크로스
- - RSI가 레벨 50을 아래에서 위로 크로스
- - RSI가 레벨 50을 위에서 아래로 크로스
- - 시간 필터 - 지정한 구간(예: 서버 시간 00:00-06:00)에서만 알림 허용. 시작=종료면 24시간.
- - 여러 알림 경로 - 팝업, MT5 푸시, 이메일(각각 따로 켜기).
- - RSI 설정 - 기간, 가격 종류(Close / Open / High / Low / Median / Typical / Weighted), 과매수/과매도 레벨(기본 70/30), 선 색·두께, 레벨 색.
- - 신호 bar 선택 - 현재 bar(0) 또는 N bar 전(1-10)을 검사해 노이즈를 줄이거나 종가 봉 기준으로 할 수 있습니다.
- - 메시지 템플릿 - 알림 문구에 `%num%`(bar 번호), `%level%`(레벨 값) 플레이스홀더 사용 가능.
- - 주말 갭 방지 - bar 사이 시간이 크게 벌어지면(예: 금요일->월요일) 신호를 보내지 않아 오작동을 막습니다.
누구에게 맞나요?
- - RSI로 진입하는 스윙·포지션 트레이더로, 중요 레벨 도달 시 알림이 필요한 분.
- - 여러 종목·타임프레임을 쓰며 모든 차트를 계속 볼 수 없는 분 - 조건이 충족될 때만 알림이 옵니다.
- - RSI를 필터로 쓰는 알고·재량 트레이더로, 알림 시 분석이나 수동 주문을 하고 싶은 분.
- - 24/7 모니터는 하기 싫지만 RSI 기반 세트업은 놓치고 싶지 않은 분.
설정 목록과 의미
=== Alert settings ===
- Enable popup alerts - 팝업 알림 켜기/끄기(기본: 켜짐).
- Signal: RSI crosses above level (overbought) - RSI가 과매수 레벨(예: 70)을 아래->위로 넘을 때 알림(기본: 꺼짐).
- Signal: RSI crosses below level (overbought) - RSI가 과매수 레벨을 위->아래로 넘을 때 알림(기본: 켜짐).
- Signal: RSI crosses above level (oversold) - RSI가 과매도 레벨(예: 30)을 아래->위로 넘을 때 알림(기본: 켜짐).
- Signal: RSI crosses below level (oversold) - RSI가 과매도 레벨을 위->아래로 넘을 때 알림(기본: 꺼짐).
- Signal: RSI crosses above level 50 - 레벨 50을 아래->위로 넘을 때 알림(기본: 꺼짐).
- Signal: RSI crosses below level 50 - 레벨 50을 위->아래로 넘을 때 알림(기본: 꺼짐).
- Bar to check for signal (0 = current bar) - 크로스 판단에 쓸 bar: 0=현재, 1=1봉 전, ... 10까지(기본: 1).
- Send push notifications - MT5 푸시 알림 켜기/끄기(기본: 꺼짐).
- Send email - 알림 문구 이메일 발송 켜기/끄기. MT5 메일 설정 필요(기본: 꺼짐).
=== Alert time filter (HH:MM, Start=End = 24h) ===
- Window start (e.g. 00:00) - 알림 허용 구간 시작(서버 시간), 형식 HH:MM(예: 00:00).
- Window end (e.g. 06:00) - 구간 종료, 형식 HH:MM. 시작=종료면 24시간 허용.
=== RSI settings ===
- RSI period - RSI 계산 기간(기본: 14).
- Applied price - RSI에 쓸 가격(Close / Open / High / Low / Median (High+Low)/2 / Typical (High+Low+Close)/3 / Weighted (High+Low+Close+Close)/4), 기본 Close.
- Overbought level - 과매수 레벨(RSI 값, 기본: 70).
- Oversold level - 과매도 레벨(RSI 값, 기본: 30).
- RSI line color - RSI 선 색.
- RSI line width - RSI 선 두께(픽셀, 기본: 1).
- Horizontal levels color (30, 50, 70) - 레벨 30, 50, 70 선 색.
=== Alert message templates (%num%=bar, %level%=level) ===
- MessageCrossUp - 레벨을 아래->위로 넘을 때 알림 문구. `%num%`(bar 번호), `%level%`(레벨 값) 사용 가능.
- MessageCrossDown - 레벨을 위->아래로 넘을 때 알림 문구. 동일하게 `%num%`, `%level%` 사용 가능.
RSI Alerts v1.6 - MetaTrader 5. 표준 RSI 기반. 참고용. 과거 결과가 미래 결과를 보장하지 않습니다.


It doesnt send notifications, all settings are correct: as it should be