VisualVol
- 지표
-
Maxim Kuznetsov
 My big personal project : http://nektomk.ru/en:atcl:start
Integration MT4 with world via Tcl :-) Excel, Mail, Networking, Rest-API, Websockets and many many others are accessable from MetaTrader. - 버전: 1.0
- 활성화: 5
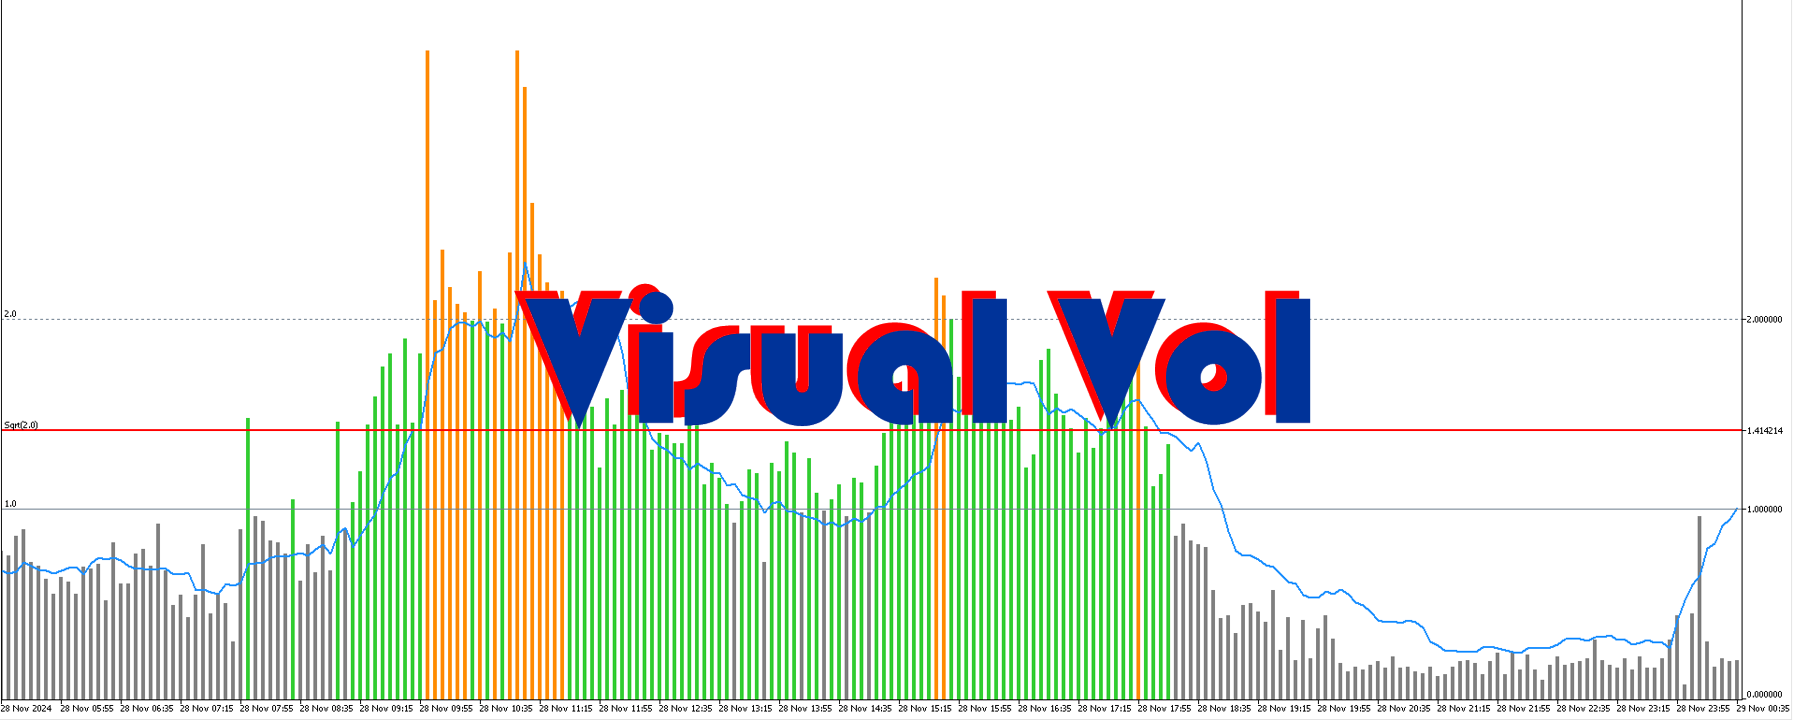
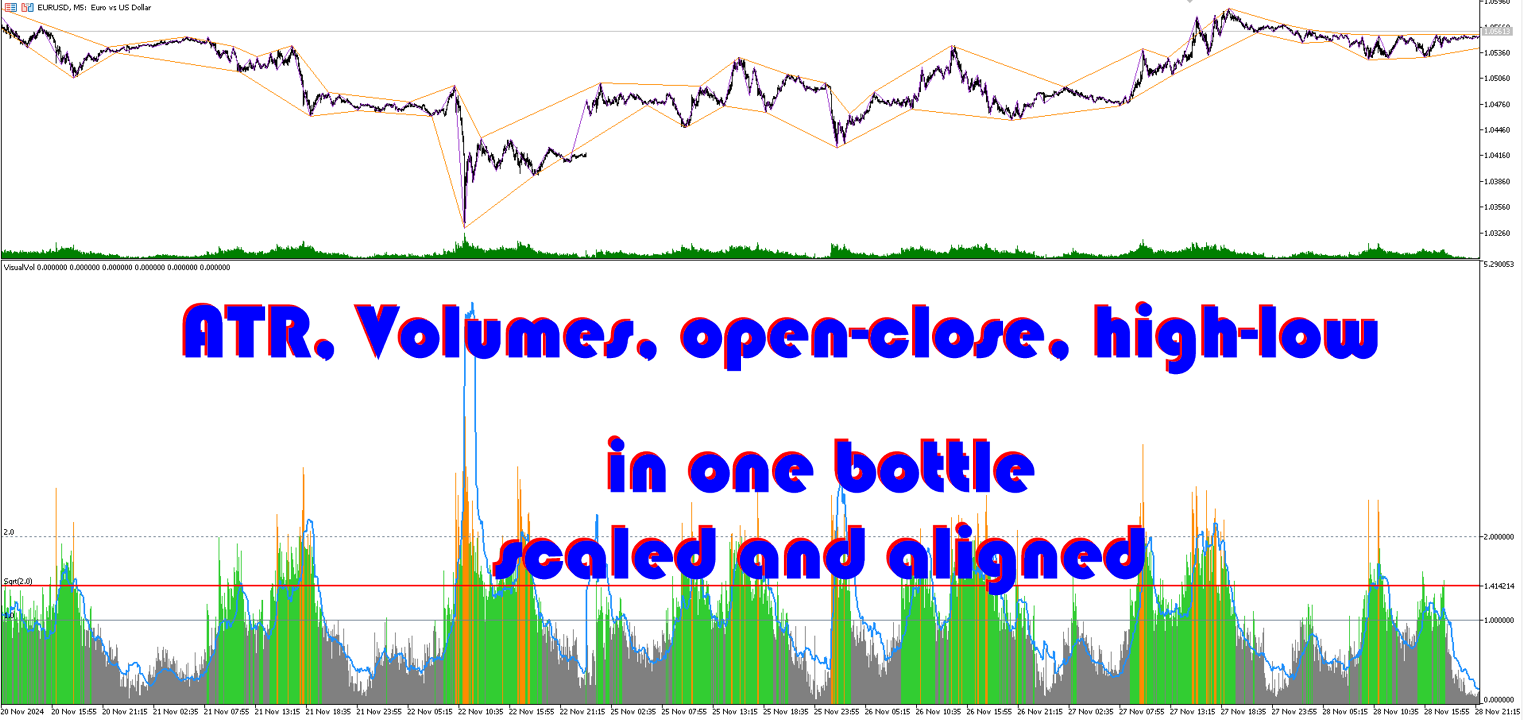
The indicator highlights the points that a professional trader sees in ordinary indicators. VisualVol visually displays different volatility indicators on a single scale and a common align. Highlights the excess of volume indicators in color. At the same time, Tick and Real Volume, Actual range, ATR, candle size and return (open-close difference) can be displayed. Thanks to VisualVol, you will see the market periods and the right time for different trading operations.
The indicator displays:
- The tick volume is in the form of a colored histogram with "thick" lines.
- the real volume in the form of a simple histogram
- the distance |open-close| and the size of the high-low candle in the form of lines
- valid range and ATR (average valid range), also in the form of lines
all the indicators are shown in a single overall scale and you can see their relationship.
The levels are marked on the indicator:
- 1.0 is the average level. Indicators below 1.0 are readings below the average value. The histogram of the tick volume less than 1.0 shows gray bars, green bars above it
- 1.414 - sqrt(2). Normal market activity.
- 2.0 is a critical level. An indicator above 2.0 indicates a sharp movement and very high volatility. The histogram of the tick volume will be orange in this case
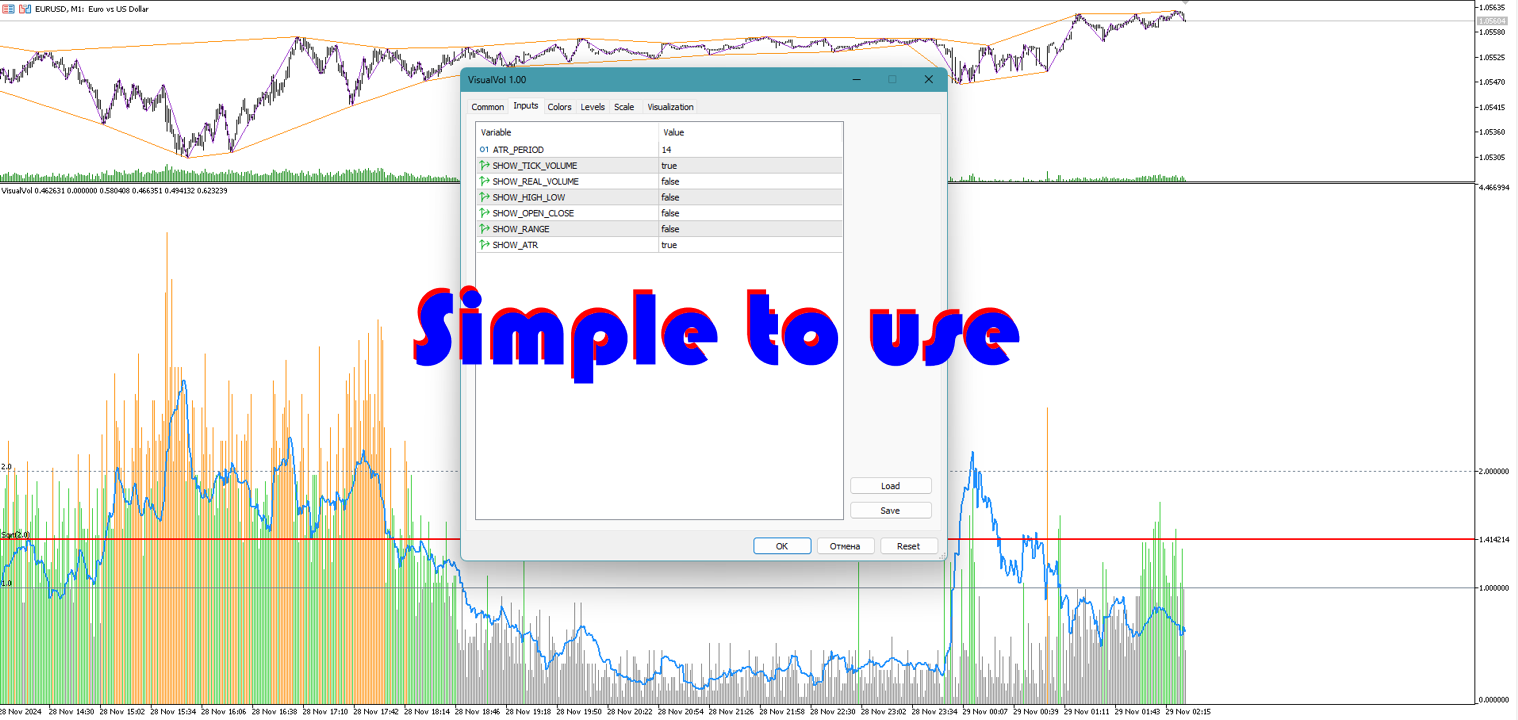
Parameters
ATR_PERIOD - the period of the displayed ATR
Other parameters allow you to turn on/off individual components.
By default :
Tick volume, candle size and ATR are included
The real volume, the open-close and the actual range are off. If you need them, just turn them on
ATTENTION: The indicator is designed for manual trading and analytical activities. When zooming, the visually visible number of bars of the trading chart is used.
Recommendations for use
Try to make trend entries with the green color of the tick histogram, counter-trend entries with orange.
Use night scalping techniques at values below 1.0 (with a gray volume histogram).
Use the ATR line as a signal: the excess of volumes over the ATR indicates the beginning of an active phase of the market. A decrease below it, about completion (price back)