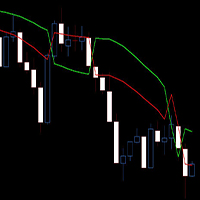
ULTRA Indicator V1

ULTRA Indicator V1 MT5 | Smart Money Concepts (SMC) + Order Block Supply & Demand Trading System

Overview

ULTRA Indicator V1 is a professional MetaTrader 5 (MT5) Smart Money Concepts (SMC) trading system designed to identify institutional-level market structure, liquidity zones, and high-probability reversal areas using Order Blocks and Supply & Demand analysis.

This indicator integrates two powerful MQL5 Market tools:

  • SMC Structure Markup
  • Supply and Demand Order Blocks MT5 (OB)

By combining structure + liquidity + confirmation signals, ULTRA Indicator V1 provides a complete rule-based trading framework for forex traders who want to trade like institutions rather than retail traders.

Key Concept Behind ULTRA Indicator V1

The system is built on institutional trading logic:

  • Markets move in structured phases (accumulation, manipulation, distribution)
  • Price reacts to liquidity zones (Order Blocks)
  • High-probability trades occur when structure and liquidity align

ULTRA Indicator V1 filters market noise and focuses only on high-quality institutional setups.

Core Components

1. Smart Money Concepts (SMC) Structure Engine

  • Automatically maps market structure in real-time
  • Identifies swing highs and swing lows
  • Detects Break of Structure (BOS)
  • Defines bullish or bearish market bias
  • Highlights active trading range for precision planning

2. Supply & Demand Order Block System (MT5)

Powered by the Supply and Demand Order Blocks MT5 (OB) indicator:

  • Detects institutional Order Blocks (OBs)
  • Separates:
    • 🔵 Decisional Order Blocks (trend-shifting zones)
    • 🔴 Extreme Order Blocks (liquidity extremes)
  • Highlights high-probability reversal and continuation zones
  • Maps key institutional supply and demand areas

3. ULTRA Signal Confirmation Engine

  • Provides entry confirmation after structure + OB alignment
  • Eliminates premature entries
  • Confirms timing only when price interacts with valid zones
  • Designed for precision execution, not prediction
Trading Methodology (Step-by-Step Strategy)

Step 1: Market Structure Analysis (SMC)

Use the SMC Structure Markup to:

  • Identify market trend direction
  • Mark swing structure
  • Define the active trading range

Step 2: Order Block Mapping

Using Supply and Demand OB tool:

  • Identify Decisional Order Blocks
  • Identify Extreme Order Blocks
  • Mark all institutional liquidity zones

Step 3: Wait for Price Reaction

Do not enter early.

Wait for price to:

  • Return into a valid Order Block zone
  • Re-enter institutional liquidity area

Step 4: ULTRA Signal Confirmation

Only execute when:

  • Price is inside OB zone
  • SMC structure supports direction
  • ULTRA signal confirms entry

Step 5: Entry Execution

  • Enter at the exact price provided by the indicator
  • Set Stop Loss slightly beyond invalidation level
  • Avoid widening SL unnecessarily

Step 6: Take Profit Strategy

  • Set Take Profit at nearest:
    • Swing high (for sell setups)
    • Swing low (for buy setups)
  • Based strictly on market structure, not fixed RR
Key Features

✔ Smart Money Concepts (SMC) structure detection
✔ Automated Break of Structure (BOS) identification
✔ Institutional Order Block detection (Decisional + Extreme)
✔ Supply and Demand zone mapping
✔ High-probability signal confirmation system
✔ Precise entry price guidance
✔ Structure-based take profit targeting
✔ Clean, rule-based trading workflow
✔ Works on all MT5 trading instruments

Trading Strategy Philosophy

ULTRA Indicator V1 is built for traders who want to move beyond indicators that "predict" price.

Instead, it focuses on:

  • Liquidity-driven price movement
  • Institutional footprint (Order Blocks)
  • Market structure confirmation (SMC)
  • Timing precision through signal validation

This creates a non-discretionary trading framework where every trade is based on structured logic.

Ideal For
  • Smart Money Concepts (SMC) traders
  • Institutional-style forex traders
  • Intraday traders (M15, M30, H1)
  • Swing traders (H4, Daily)
  • Traders using Order Block strategies
  • Traders seeking rule-based entry systems
Advantages Over Traditional Indicators

Unlike standard MT5 indicators, ULTRA Indicator V1:

  • Does NOT rely on lagging signals alone
  • Does NOT generate random arrows
  • Does NOT trade without structure context

Instead, it combines:

  • Structure + Liquidity + Confirmation = Precision Entry System
How to Use Effectively

For best results:

  • Trade only when structure and OB align
  • Avoid trading against market bias
  • Wait for ULTRA confirmation signal
  • Always respect swing-based targets
  • Do not force trades in low liquidity zones
FAQ

What is an Order Block in trading?

An Order Block is a zone where institutional traders place large orders, causing strong market reversals or continuations.

Does this indicator repaint?

No. Signals are based on confirmed structure and completed price action conditions.

Can it be used for scalping?

Yes, but it performs best in intraday and swing trading conditions.

What markets does it support?

All MT5 instruments including forex, indices, gold, and crypto.

Do I need SMC knowledge?

Basic understanding helps, but the indicator visually maps structure and zones automatically.

Final Summary

ULTRA Indicator V1 MT5 is a complete Smart Money Concepts trading system that merges:

  • Market structure intelligence (SMC)
  • Institutional liquidity zones (Order Blocks)
  • Precise signal confirmation

It is designed for traders who want structured, rule-based, high-probability entries instead of emotional or indicator-heavy trading.

추천 제품
FVG Concept and Market Structure (MS) Indicator – Comprehensive Analysis with Interactive Control This is not just an indicator. It is a useful tool for market analysis. This indicator combines several analytical functions, making it one of the more complete solutions in its field. This tool represents a comprehensive solution for analyzing market behavior with the goal of forecasting the direction of price movement. The indicator is designed to assist the trader and not distract them with unnec
FREE
The indicator for trading on the signals of the harmonic pattern AB=CD. It gives signals and shows the levels of entry into the market, as well as levels for placing stop orders, which allows the trader to make timely decisions on entering the market, as well as effectively manage positions and orders. It supports sending push notifications to a mobile device, e-mail, as well as alerts. This indicator has been ported from the version for MetaTrader 4. For more information, as well as a detailed
XAUUSD(금) 오더플로우 - 외환, 지수, 암호화폐, 선물에도 사용 가능. 신규 - 바이너리 옵션 모드: 캔들 단위 만기의 CALL / PUT 신호, Setup Lab이 브로커 페이아웃으로 내 종목과 타임프레임의 각 셋업을 측정합니다. 무료 데모 - 테스트 방법 (먼저 읽어주세요): 전략 테스터: 시각화 모드 와 실제 틱 기반 모든 틱 모델을 선택하세요. M1 또는 M5 와 최근 2-3일 기록을 사용하세요. 처음 로드할 때 MetaTrader가 틱을 다운로드하는 동안 몇 초 기다리세요. 테스트 시작 전 캔들은 M1 바로 추정되며, 새 캔들은 실제 틱으로 만들어집니다. 차트의 버튼(CLASSIC, PRO, BOX, BID x ASK, WICK)을 눌러 보기를 전환하세요. RGT Cluster Footprint 는 각 캔들 내부 에서 일어나는 일을 보여줍니다: 각 가격에서 거래된 거래량, 누가 공격적이었는지(매수자 또는 매도자), 그리고 시장이 반응할 가능성이 높은 위치. 하나의 지
수요 공급 볼륨 존 — 기관급 지지/저항 및 매수·매도 압력 표시 Supply Demand Volume 는 가격 구조, 거래량 분석 및 실시간 변동성을 기반으로 주요 수요 및 공급 구역을 자동으로 탐지하는 정밀한 도구입니다. 정확한 지지/저항 레벨, 수급 흐름, Wyckoff 이론 또는 스마트 머니 개념을 사용하는 트레이더를 위해 설계되었으며, 매수/매도 세력 비교 및 잠재적 반전 신호를 시각적으로 제공합니다. 주요 기능: 자동 존 탐지 – 과거 고점/저점 및 ATR(평균 진폭)을 기반으로 주요 기관 거래 구역을 감지합니다.   매수/매도 볼륨 분석 – 실시간으로 매수/매도 세력의 강도를 시각화하여 방향성을 확인합니다.   중간선 및 가격 라벨 – 컬러와 가격 마커가 포함된 중간선 제공.   시간 기반 확장 – 구역이 자동으로 미래까지 확장되어 지속적으로 유효하게 유지됩니다. 추천 대상: 반전 트레이더 돌파 트레이더 볼륨 및 프라이스 액션 기반 트레이더 스캘핑 및 인트라데
Fixed Volume Profile
Carlos Pascual Perez Maturano
This indicator, titled "Fixed Volume Profile.mq5", is a custom tool for MetaTrader 5 (MQL5) designed to calculate and display a Volume Profile over a user-defined fixed time range. The Volume Profile shows the distribution of trading volume at different price levels during a specific period, helping to identify areas of high activity (such as Points of Control or POCs) and volume-based support/resistance areas. Main Functionality: Interactive Range: The indicator creates two vertical lines on
FREE
This SMT (Smart Money Technique) divergence indicator identifies discrepancies in price movement between two different trading symbols, helping traders detect potential market reversals. This tool compares the price action of two correlated assets, such as two currency pairs or indices, to spot divergences where one asset's price moves in the opposite direction of the other. For example, while one symbol may be making higher highs, the other might be making lower highs, signaling a divergence. T
FREE
Visual Bollinger Bands Divergence
Luiz Felipe De Oliveira Caldas
VWAP 밴드 비주얼 스타일 1.0 금융 시장 지표는 트레이더와 투자자가 금융 시장을 분석하고 의사 결정을 내리는 데 사용하는 필수 도구입니다. VWAP 및 Bollinger Bands는 트레이더가 시장 추세 및 가격 변동성을 측정하는 데 사용하는 두 가지 인기 있는 기술 분석 도구입니다. 이 제품에서는 두 지표를 결합하여 시장 동향과 변동성에 대한 종합적인 분석을 제공하는 고유한 제품을 만들 것을 제안합니다. 이 제품은 데이터 기반 분석을 기반으로 정보에 입각한 결정을 내리려는 거래자와 투자자에게 이상적입니다. 다이버전스 전략은 트레이더가 시장에서 잠재적인 추세 반전을 식별하는 데 사용하는 인기 있는 기술 분석 기법입니다. 이 전략은 가격 변동과 기술 지표 간의 차이를 식별하는 데 의존합니다. 이 섹션에서는 비주얼 스타일과 볼린저 밴드를 사용한 다이버전스 전략에 대해 설명합니다. 예를 들어 비주얼 스타일과 볼린저 밴드를 사용하는 다이버전스 전략은 트레이더가 시장에서 잠재적인
Hunttern ZigZag MT5
Hassan Gh Fakhraei
5 (1)
Hunt markets with Hunttern ZigZag . Easy to use with one parameter    You can use it for the following:       -Classic patterns       -Heads and shoulders       -Harmonic patterns       -Elliott Wave       -Support and resistance       -Supply and Demand Single parameter:      -Period (1-120) Features:        -Candle time        -Single parameter        -Light mode template This is version 1 of Hunttern ZigZag. We are very happy to receive feedback from you.
FREE
SessionFlowMap — POC 레벨이 포함된 멀티 세션 거래량·델타 프로파일 SessionFlowMap은 외환 거래일의 각 세션(아시아, 런던, 뉴욕, 그리고 선택 사항으로 시드니와 사용자 지정 세션)에 대해 거래량 프로파일과 델타 프로파일(매수와 매도의 불균형)을 만들어 차트에 표시합니다. 각 세션마다 POC(Point of Control, 가장 많이 거래된 가격)와 Value Area(VAH와 VAL, 거래량 대부분이 모인 구간)를 찾아 이 레벨들을 수평선으로 오른쪽으로 연장합니다. 각 세션에서 시장이 어디에 시간과 자금을 썼는지, 어떤 레벨이 다시 중요해질 수 있는지 한눈에 볼 수 있습니다. MT4-version:  https://www.mql5.com/en/market/product/200941 작동 방식 각 세션은 고유한 시간대에 따라 M1 히스토리에서 잘라냅니다. 아시아, 런던, 뉴욕, 시드니의 시간은 GMT로 설정하며 브로커의 서버 시간으로 자동 변환됩니다. 사
SPECIAL LAUNCH OFFER: $30 (1-Month Rent) Limited time offer to build our community and gather feedback! AmbM GOLD Institutional Scalper A high-precision M5 algorithm for XAUUSD (Gold) , engineered to trade exclusively at Institutional Liquidity Levels ($5/$10 psychological marks). PERFORMANCE DATA (BUY ONLY) • Win Rate: 87.09%. • Safe Growth: +$4,113 profit on $10k (13.75% Max Drawdown). • Extreme Stress Test: Successfully generated +$22,997 in a 5-year stress test (2020-2026), proving
UZFX-알파 스트라이크 시그널 v2.0은 높은 확률의 거래 기회를 정밀하고 명확하게 식별하도록 설계된 전문가급 시장 분석 도구입니다. 이 고급 지표는 정교한 가격 움직임 인식과 동적 리스크 관리 시각화를 결합하여 차트에 직접 명확한 매수 및 매도 신호를 제공합니다. 참고: { LTL 164343 } 지표와 함께 사용하면 신호의 적중률을 높일 수 있습니다. LTL 신호를 통해 추세를 파악하고, 알파 신호를 진입 신호로 활용하십시오. 이러한 접근 방식은 승률을 극대화하고 오신호를 방지하는 데 도움이 됩니다. 작동 원리 이 지표는 잠재적인 추세 반전 또는 지속을 시사하는 특정 캔들 패턴을 식별하여 시장 구조를 분석합니다. 이러한 패턴이 당사의 독자적인 알고리즘 조건과 일치할 때 지표는 명확한 시각적 신호를 생성합니다: 매수 신호(파란색 화살표)는 강세 모멘텀이 감지될 때 시장 저점에서 나타납니다 매도 신호(빨간색 화살표)는 약세 압력이 확인될 때 시장 고점에서 나타납니다 트레이더를
FREE
This is the Full Version, to get the free version please contact me. The free version works on “GBPCHF” charts. All symbols and time frames scanner. Harmonic Pattern Harmonic patterns are used in technical analysis that traders use to find trend reversals. They are considered one of the most accurate technical analysis tools, as they allow traders to predict the future price movement direction and the potential trend targets. Also, unlike many other technical tools, the number of false signals
Precision Spike Detector
Francisco Mandomo Simbine
5 (2)
Precision Spike Detector V3 – Institutional-Grade AI Trading System Attention: The price increases by US$50 for every 10 purchases.  Final price: US$599 Precision Spike Detector V3   is a   state-of-the-art, institutional-grade market analysis system   for   MetaTrader 5 , designed to detect   high-probability market movements   in synthetic indices such as   Boom, Crash, GainX, and PainX . After purchase, send me a private message to receive the optimized configuration files,  the installation
Qzone
Vinutthapon Bumroong
Quantific Structure Zone is a technical indicator designed for Price Action and SMC traders. It maps the market structure and identifies dynamic supply and demand zones on the chart. Built with a non-repainting algorithm, it provides signals upon confirmed candle closes, making it suitable for live trading and backtesting. The indicator highlights market swings and price levels. Features Automated Market Structure: Identifies and labels structural swing points with HH (Higher High), HL (Higher
FREE
Matreshka
Dimitr Trifonov
5 (2)
Matreshka self-testing and self-optimizing indicator: 1. Is an interpretation of the Elliott Wave Analysis Theory. 2. Based on the principle of the indicator type ZigZag, and the waves are based on the principle of interpretation of the theory of DeMark. 3. Filters waves in length and height. 4. Draws up to six levels of ZigZag at the same time, tracking waves of different orders. 5. Marks Pulsed and Recoil Waves. 6. Draws arrows to open positions 7. Draws three channels. 8. Notes support and re
VolumeDeltaWaves
Stanislav Korotky
This indicator is an extended implementation of Weis waves. It builds Weis waves on absolute volumes (which is the classical approach) or delta of volumes (unique feature) using different methods of wave formation and visualization. It works with real volumes, if available, or with tick volumes otherwise, but also provides an option to use so called "true volume surrogates", as an artificial substitution for missing real volumes (for example, for Forex symbols), which was introduced in correspo
Scalping Corloring rule
Ailton Felix De Morais
Operating Principle The SNIPER Indicator , developed by Felix Trader, was designed to help traders identify potential buying and selling opportunities in the financial markets. Its main purpose is to simplify chart analysis by identifying favorable market conditions for Day Trading and displaying visual signals that help traders recognize potential entry points and price reversal opportunities. With an intuitive visual interface, the indicator displays signals directly on the chart, making marke
Here I present you this awesome indicator I made. This is a nique combination witch puts you in the same level as MM's. So you can surf a lot of waves and identify the rally time, breakouts, and the perfect time to get in the market. ---- The SSL Channel is a great all-rounder based on 2 Simple Moving Averages, one of recent Highs, one of recent Lows. The calculation prints a   channel   on the chart consisting of 2 lines. This strategy gives a Long signal when price closes above the top of thes
Ultimate Double Top & Bottom (Pro Volume Matrix) Stop trading retail breakouts. Start trading Institutional Traps. The   Ultimate Double Top & Bottom   is not a standard, lagging pattern scanner. It is a highly advanced, non-repainting structural engine equipped with a proprietary   3-Leg Volume Matrix . Designed exclusively for Smart Money Concepts (SMC) and order flow traders, this indicator mathematically dissects the tick volume inside M and W patterns to reveal true institutional intent:  
Anti-Harmonic Pattern Scanner (MT5) Elevate your technical analysis and capture high-probability market reversals with the Anti-Harmonic Pattern Scanner for MetaTrader 5. Built specifically to tackle the unique price delivery of modern synthetic and spike indices, this indicator combines advanced geometric precision with strict non-repainting execution to give you a true trading edge. Key Perks & Features 100% Non-Repainting & Permanent Stamping: Say goodbye to the illusion of "perfect" backtest
Psychological Levels – Round Number Lines and Order Block Zones for MT5 Overview Psychological Levels draws horizontal price levels at round numbers (endings in 0 and 5) and highlights order block zones around them. Traders often watch these areas for reactions, reversals, and liquidity. The indicator keeps your chart clean by drawing only the levels near the current price and updating them as price moves. Features Horizontal lines at round numbers ending in 0 and 5, each with its own style, wid
FREE
Volume flow Profile
Israr Hussain Shah
Master Edition은 거래량과 자금 흐름의 관점을 통해 시장 구조를 시각화하도록 설계된 전문가급 분석 도구입니다. 표준 거래량 지표와 달리, 이 도구는 차트에 일일 거래량 프로필을 직접 표시하여 가격 발견이 발생한 위치와 "스마트 머니"가 위치한 곳을 정확하게 볼 수 있게 합니다. 이 Master Edition은 명확성과 속도를 위해 설계되었으며, 로드 시 차트 레이아웃을 즉시 아름답게 만드는 독특한 자동 테마 동기화 시스템을 특징으로 합니다. 주요 기능: 진정한 자금 흐름 계산: 표준 틱 거래량을 넘어섭니다. "Use Money Flow"를 활성화하면 거래량이 가격에 따라 가중치가 부여되어 특정 가격 수준에서의 실제 자본 투입을 드러냅니다. 가치 영역(VA) 시각화: 가치 영역(기본값: 거래량의 70%)을 자동으로 계산합니다. VA Fill: 통제 구역을 즉시 식별하기 위해 가치 영역 배경을 음영 처리합니다. 주요 수준: 통제점(POC), 가치 영역 고점(VAH), 가치 영
IBI Footprint
Brahim Eljaziri
IBI Footprint draws a professional footprint chart from the real trades of the exchange : for every candle and every price level you see how many contracts were sold and how many were bought . What you see Top of each column: candle volume (V) and delta (Δ = buys − sells). Each price row: sells | buys. Warmer cells = more volume. Diagonal imbalances highlighted (buyer in blue, seller in red). POC (price with the most volume) framed in gold. Click the panel to shrink it to a thin bar and see your
FREE
이 표시기는 이산 Hartley 변환을 기반으로 합니다. 이 변환을 사용하면 재무 시계열을 처리할 때 다양한 접근 방식을 적용할 수 있습니다. 이 지표의 특징은 판독값이 차트의 한 지점이 아니라 지표 기간의 모든 지점을 참조한다는 것입니다. 시계열을 처리할 때 표시기를 사용하여 시계열의 다양한 요소를 선택할 수 있습니다. 필터링의 첫 번째 가능성은 이 접근 방식을 기반으로 합니다. 불필요한 모든 고주파수 구성 요소는 단순히 폐기됩니다. 첫 번째 그림은 이 방법의 가능성을 보여줍니다. CutOff 매개변수를 선택하면 원래 시계열의 세부 정보를 선택할 수 있습니다(빨간색 선 - 주요 정보만 남음 CutOff = 0, 노란색 - 주요 및 가장 낮은 주파수 기간 CutOff = 1 , 파란색 - 가장 높은 주파수의 모든 노이즈가 삭제됩니다. CutOff = 4 ). 그러나 이것이 유일한 가능성은 아닙니다. 추가 필터링으로 노이즈 성분을 억제할 수 있습니다. 두 옵션 모두 이 표시기에 구현
" Blow It Up!" - The Trading Indicator That Questions Your Life Choices Tired of boring indicators? Meet your new market companion that delivers: "YOLO BUY!" arrows when you should probably panic Explosive rectangle confetti (because why not?) 200+ soul-crushing quotes like "Your stop loss is imaginary" and "This is n't trading, it's donating to whales" Random alerts that roast your strategy This Indicator is lik e Therapy - Because daytrading shouldn't fe el like watching paint dry! Highlights
거래량 프로파일 멀티모드: 지표 방식이 아닌, 원하는 방식으로 거래량을 분석하세요. 대부분의 거래량 프로파일 지표는 거래자들이 미리 정해진 분석 범위 안에 갇히도록 만듭니다. 하지만 시장은 고정된 틀 안에서 움직이지 않는데, 분석까지 그럴 필요가 있을까요? 볼륨 프로파일 멀티 모드는 거래량 분석 시점, 장소, 방법을 완전히 자유롭게 결정할 수 있도록 해줍니다. 시장 구조 분석, 거래 세션 프로파일링, 더 높은 시간대의 활동 모니터링, 또는 진행 중인 경매 추적 등 어떤 목적이든 이 지표는 사용자의 거래 스타일에 맞춰 조정되므로 사용자가 거래 스타일에 맞춰야 할 필요가 없습니다. 직관적인 워크플로우를 원하는 초보자와 유연성을 요구하는 전문가를 위해 설계된 Volume Profile Multi-Mode는 네 가지 강력한 프로파일링 방법을 하나의 고도로 상호작용적이고 맞춤 설정 가능한 거래 도구로 결합합니다. 4가지 강력한 프로파일링 모드 1.       플렉서블 박스 : 대시보드에서 토
AURA Session Zones Mapper is a professional-grade, ultra-clean chart indicator designed specifically for Smart Money Concepts (SMC), ICT, and Price Action day traders. Say goodbye to cluttered charts with overlapping, opaque boxes. AURA provides a minimalist, visually pleasing approach to mapping major market sessions, ensuring your focus remains strictly on price action and institutional levels. Built with a strict No-Repaint algorithm , this indicator not only maps the sessions but actively an
FREE
This indicator will show you the average entry price for positions, pending orders and both, every side and every type has an different color; It will also show you actual risk, pending risk, both sum and for both sides and the sum of both; you can configure Day, Week, Month and Year Financial Risk to show you if you are close to it; it shows the risk return of each side and both sides too, based on risk and profit for actual position and pending orders
FREE
Expert VWAP TripleMA
Michael Amorim Vieira
Expert VWAP TripleMA is a visual indicator developed for traders who want to concentrate essential readings of average price, trend, and operational confluence into a single tool. It combines a daily VWAP, VWAP standard deviation bands, and up to 3 independent moving averages, all fully configurable by the user. Its purpose is to reduce dependence on multiple external indicators and provide a cleaner, more objective, and better organized view directly on the MetaTrader 5 chart. The indicator was
Impulse MACD Signals MT5
Bruno Alberto Nunez Aguilar
Impulse MACD Signals is a momentum oscillator designed to reduce the false signals that affect the classic MACD in ranging markets. Unlike the traditional MACD, the Impulse MACD outputs a value of zero when price action stays inside the moving average channel, which means the indicator naturally stays silent during consolidation phases. This implementation is a clean, non-repainting port of the Impulse MACD concept for MetaTrader 5, built from the mathematical specification and enhanced with a
이 제품의 구매자들이 또한 구매함
Trend Sniper X
Sarvarbek Abduvoxobov
4.87 (46)
Trend Sniper X 는 트레이더가 추세 방향과 잠재적 반전 지점을 명확하고 정확하게 포착할 수 있도록 도와주는 MetaTrader 5용 멀티 타임프레임 추세 추종 지표입니다. MT4용: https://www.mql5.com/en/market/product/193245 가격 정보: 현재 가격은 프로모션 할인가이며, 향후 업데이트 및 새로운 기능이 출시됨에 따라 변동될 수 있습니다. 보너스 혜택: 본 지표 전용 무료 자동매매 Assistant EA를 받으시려면 구매 후 작성자에게 메시지를 보내주시기 바랍니다. Code2Profit 채널 멀티 타임프레임 분석으로 시장을 마스터하세요! Trend Sniper X로 승률을 극대화하는 방법: 핵심 규칙 및 세션 팁 기술 사양 플랫폼 MetaTrader 5 지표 유형 멀티 타임프레임 추세 지표 운용 타임프레임 모든 차트 타임프레임 지원, 독립적으로 선택 가능한 상위 타임프레임(M1–MN1) 주요 상품 외환, 금(XAUUSD) 및 기타 C
Entry Points Pro for MT5
Yury Orlov
4.54 (155)
Entry Points Pro는 주문을 넣기 전에 어디에서 진입하고, 스탑을 어디에 두고, 어떤 랏으로 거래할지 보여 줍니다. 가격 지금 199 USD이며, 이 가격으로는 4카피입니다. 이후 가격은 249 USD, 최종 가격은 349 USD입니다. 저는 시장에서 트레이딩으로 돈을 벌고 그것을 보여 드립니다. 그래서 이 인디케이터를 모두에게 팔 필요가 없습니다. 스스로 생각하는 트레이더를 위한 도구이지, 마법 버튼이 아닙니다. 돌파가 없으면 거래도 없습니다. 회색 화살표는 취소된 신호입니다. 가격이 신호 캔들을 돌파하지 못했으므로 진입도 손실도 없습니다. 화살표는 캔들이 마감될 때 나타나며 리페인팅되지 않습니다. 설정은 두 가지: 예치금과 거래당 리스크. 결제 전에 확인하세요: 무료 데모는 MT5 전략 테스터에서 작동하며 2분이면 됩니다. 구매 후에는 제가 직접 설정을 도와 드리겠습니다. 2019년, 저는 이 지표가 무엇을 할 수 있는지 전 세계에 보여 주었습니다. 실계좌에서 지표의
Gann Made Easy MT5
Oleg Rodin
5 (14)
Gann Made Easy 는 mr.의 이론을 사용하여 최고의 거래 원칙을 기반으로 하는 전문적이고 사용하기 쉬운 Forex 거래 시스템입니다. W.D. 간. 이 표시기는 Stop Loss 및 Take Profit Levels를 포함하여 정확한 BUY 및 SELL 신호를 제공합니다. PUSH 알림을 사용하여 이동 중에도 거래할 수 있습니다. 구매 후 거래 방법 안내 및 유용한 추가 지표를 무료로 받으시려면 저에게 연락주세요! 아마도 Gann 거래 방법에 대해 이미 여러 번 들었을 것입니다. 일반적으로 Gann의 이론은 초보자 거래자뿐만 아니라 이미 거래 경험이 있는 사람들에게도 매우 복잡한 것입니다. Gann의 거래 방식은 이론적으로 적용하기 쉽지 않기 때문입니다. 나는 그 지식을 연마하고 Forex 지표에 최고의 원칙을 적용하기 위해 몇 년을 보냈습니다. 표시기는 적용하기가 매우 쉽습니다. 차트에 첨부하고 간단한 거래 권장 사항을 따르기만 하면 됩니다. 지표는 지속적으로 시장 분석
Ultra Indicator
Ihor Otkydach
5 (1)
ULTRA는 “올인원” 방식으로 작동하는 기술적 지표로, 시장을 독자적으로 분석하고, 매매 신호를 생성하며, 손절매 주문 설정 수준을 표시하고, 이익을 실현하거나 손실을 최소화하기 위해 포지션을 청산해야 할 시점을 제안합니다. 다시 말해, 시장을 분석하는 법을 모르거나, 가격 수준(손절매를 어디에 설정할지)을 파악하지 못하거나, 자금 관리에 어려움을 겪더라도 상관없습니다. ULTRA가 그 모든 것을 대신 해줄 테니까요! 구매자 특전 : ULTRA 지표를 구매하신 후, 저에게 비공개 메시지를 보내주시면 “ULTRA BOT”을 무료 선물로 드립니다. 이 도구는 해당 지표의 신호를 바탕으로 개설한 거래를 관리하는 데 도움을 주는 특별한 도구입니다(각 거래에 대해 손절매를 설정하고, 최상의 결과를 얻을 수 있도록 전략의 규칙에 따라 거래를 자동으로 청산해 줍니다).  또한 구매자분들께 다양한 자산에 바로 적용할 수 있는 설정값을 제공해 드리고 있으며, 이를 통해 지표가 최대 효율로 작동할
통화 강도 마법사는 성공적인 거래를 위한 올인원 솔루션을 제공하는 매우 강력한 지표입니다. 표시기는 여러 시간 프레임의 모든 통화 데이터를 사용하여 이 또는 해당 외환 쌍의 힘을 계산합니다. 이 데이터는 특정 통화의 힘을 확인하는 데 사용할 수 있는 사용하기 쉬운 통화 지수 및 통화 전력선의 형태로 표시됩니다. 필요한 것은 거래하려는 차트에 표시기를 부착하는 것뿐입니다. 표시기는 거래하는 통화의 실제 강세를 보여줍니다. 지표는 또한 추세와 거래할 때 유리하게 사용할 수 있는 구매 및 판매 거래량 압력의 극한값을 보여줍니다. 지표는 또한 피보나치에 기반한 가능한 대상을 보여줍니다. 표시기는 PUSH 알림을 포함한 모든 유형의 알림을 제공합니다. 구매 후 연락주세요. 나는 당신과 거래 팁을 공유하고 당신에게 무료로 훌륭한 보너스 지표를 줄 것입니다! 나는 당신에게 행복하고 유익한 거래를 기원합니다!
Auto Optimized SpeedAngle 은 지속적인 워크포워드 최적화(Walk-Forward Optimization, WFO)를 통해 곡선 적합(curve-fitting)을 제거한 기관 수준의 모멘텀 벡터화 시스템입니다. 시장 체제가 바뀔 때 성능이 떨어지는 정적 입력에 의존하는 대신, 이 지표는 표본 외(Out-of-Sample, OOS) 검증을 사용하여 매개변수를 동적으로 재보정하며, 표시되는 신호가 과거의 우연이 아닌 진정한 통계적 우위를 나타내도록 보장합니다. 핵심 기관용 프레임워크 워크포워드 최적화 엔진: 핵심 알고리즘은 수천 가지의 룩백(lookback) 및 임계값 조합을 지속적으로 스캔하며, 데이터를 인샘플(in-sample)과 표본 외(out-of-sample) 세트로 엄격하게 분리합니다. 미지의 데이터 환경에서 수학적 우수성이 증명된 경우에만 새로운 매개변수 구성을 채택합니다. 정량적 목적 함수: 순수한 총이익을 쫓는 대신, 최적화 엔진은 기관 수준의 안정성
Boba Analysis Suite
Trade Ready Solutions LLC
5 (2)
Boba Analysis Suite Boba Analysis Suite는 MetaTrader 5용 분석 지표입니다. 시장 구조, 주요 가격 영역, 전반적인 시장 상황을 하나의 차트 화면에 통합하여 표시합니다. 트레이더이자 트레이딩 코치로서의 실무 경험을 바탕으로 개발되었으며, 시장 방향 평가, 주요 가격 수준 식별, 여러 시간대의 종합적인 분석 등 체계적인 분석 과정을 지원합니다. 시장 맥락을 고려한 분석 개별 신호의 의미는 시장 상황에 따라 달라집니다. Boba Analysis Suite는 현재 차트 상황을 더 넓은 시장 구조와 연결하고, 사전에 정한 규칙에 따라 매매 아이디어를 검토할 수 있도록 돕습니다. 주요 분석 기능은 다음과 같습니다. 추세 및 시장 구조: 시장 방향과 관련 구조적 맥락을 평가합니다. 주요 가격 영역 및 수준: 추가 분석이 필요한 중요한 영역을 차트에 시각적으로 표시합니다. 여러 시간대: 서로 다른 시간대의 정보를 통합하여 전반적인 시장 상황을 평가합니다.
Dynamic Forex28 Navigator MT5
Bernhard Schweigert
5 (1)
다중 통화 강도 및 모멘텀 지표 MT5 Dynamic Forex28 Navigator는 오랫동안 사랑받아 온 인기 지표들의 진화형으로, 다섯 가지의 힘을 하나로 결합했습니다. Advanced Currency Strength28 Indicator (리뷰 700개) Advanced Currency IMPULSE with ALERT (리뷰 530개) Currency Strength EXOTICS GOLD Impulse with Alert CS28 Combo Signals (최근 보너스) 지표 네 개를 따로 구매해 차트에 겹쳐 놓을 필요가 없습니다. 28개 Forex 페어의 강도, 이를 이끄는 시장의 모멘텀, 그리고 두 가지 모두의 알림이 하나의 강력한 지표로 통합되어 한 창, 한 차트에서 확인할 수 있습니다. 위 프로그램들은 MQL5 Market에서 1,200개 이상의 리뷰를 받았으며 2016년부터 MT4 커뮤니티의 필수 지표로 자리잡았습니다. Dynamic Forex28 Navigato
M1 Sniper MT5
Oleg Rodin
5 (7)
M1 SNIPER 는 사용하기 쉬운 거래 지표 시스템입니다. M1 시간대에 맞춰 설계된 화살표 지표입니다. 이 지표는 M1 시간대 스캘핑을 위한 단독 시스템으로 사용할 수 있으며, 기존 거래 시스템의 일부로도 사용할 수 있습니다. 이 거래 시스템은 M1 시간대 거래용으로 특별히 설계되었지만, 다른 시간대에도 사용할 수 있습니다. 원래는 XAUUSD와 BTCUSD 거래를 위해 이 방법을 설계했지만, 다른 시장 거래에도 유용하다는 것을 알게 되었습니다. 이 지표의 신호는 추세 방향과 반대로 거래될 수 있습니다. 저는 지표의 신호를 활용하여 양방향으로 거래할 수 있도록 돕는 특별한 거래 기법을 알려드립니다. 이 방법은 특별한 동적 지지선과 저항선 가격 영역을 활용하는 것을 기반으로 합니다. 구매하시면 M1 SNIPER 화살표 지표를 바로 다운로드하실 수 있습니다. 또한, 아래 스크린샷에 표시된 Apollo Dynamic SR 지표는 M1 SNIPER 도구를 사용하는 모든 사용자에게 무료로
Azimuth Pro
Ottaviano De Cicco
5 (7)
Azimuth Pro V2: Synthetic Fractal Structure and Confirmed Entries for MT5 Overview Azimuth Pro is a multi-level swing structure indicator by Merkava Labs . Four nested swing layers, swing-anchored VWAP, ABC pattern detection, three-timeframe structural filtering, and closed-bar confirmed entries — one chart, one workflow from micro-swings to macro-cycles. This is not a blind signal product. It is a structure-first workflow for traders who care about location, context, and timing. 1. What Change
Apex Patterns PRO 인디케이터 구매 시 - 기반 Expert Advisor 무료 제공. 자체 최적화 차트 패턴 및 브레이크아웃 분석 시스템 기존의 패턴 스캐너는 고정된 파라미터에 의존하므로 시장 변동성과 구조가 변화할 때 성능이 저하되는 경우가 많습니다. Apex Patterns PRO는 구조적 차트 패턴 인식, 모멘텀 필터링, 통계적 자체 최적화를 하나의 분석 프레임워크로 결합하여 변화하는 시장 환경에 적응하도록 설계되었습니다. 적응형 스캐닝 엔진 자체 최적화 패턴 모드 최근 과거 데이터를 바탕으로 적절한 패턴 파라미터를 자동으로 탐색하여, 정적인 설정 대신 현재 시장 행보에 맞춰 인디케이터의 구조 감지 방식을 적응시킵니다. 스마트 브레이크아웃 필터링 클래식 패턴 인식과 모멘텀, 거래량, 프라이스 액션 지표를 결합합니다. 모든 브레이크아웃을 동일하게 다루는 대신, 시장의 기저 구조를 평가하여 현재 통계적 환경에 부합하는 셋업을 식별합니다. 주요 기능 리페인트 없는 고
Divergence Bomber
Ihor Otkydach
4.89 (94)
이 지표를 구매하신 분께는 다음과 같은 혜택이 무료로 제공됩니다: 각 거래를 자동으로 관리하고, 손절/익절 수준을 설정하며, 전략 규칙에 따라 거래를 종료하는 전용 도우미 툴 "Bomber Utility" 다양한 자산에 맞게 지표를 설정할 수 있는 셋업 파일(Set Files) "최소 위험", "균형 잡힌 위험", "관망 전략" 모드로 설정 가능한 Bomber Utility의 셋업 파일 이 전략을 빠르게 설치, 설정, 시작할 수 있도록 돕는 단계별 영상 매뉴얼 주의: 위의 모든 보너스를 받기 위해서는 MQL5 개인 메시지 시스템을 통해 판매자에게 연락해 주세요. 독창적인 커스텀 지표인 “Divergence Bomber(다이버전스 봄버)”를 소개합니다. 이 지표는 MACD 다이버전스(괴리) 전략을 기반으로 한 올인원(All-in-One) 거래 시스템입니다. 이 기술 지표의 주요 목적은 가격과 MACD 지표 간의 다이버전스를 감지하고, **향후 가격이 어느 방향으로 움직일지를 알려주
Naked Forex Tweezer Pro Indicator Tweezer Pro Indicator is a pattern recognition indicator for Forex, Stocks, Indices, Futures, Commodities and Cryptos. The standard Tweezer is a two bar pattern. Our enhanced version is a multi-bar pattern. We filter the patterns for you so that you only get the     best and most effective patterns   and ignore the noise. The Tweezer pattern is a simple and effective pattern to trade. The strategy that comes with the Tweezer is based on price action. The Twe
Adaptive Price Action Engine 지표를 구매하면 EA(자동매매 프로그램)가 무료 멀티 타임프레임 기반 자기 최적화 추세 & 캔들 패턴 분석 시스템 시장은 끊임없이 변화하며, 모든 Price Action 패턴이 모든 시장 환경에서 동일한 가치를 가지는 것은 아닙니다. Adaptive Price Action Engine 은 변화하는 시장 환경에 적응할 수 있도록 설계되었으며, 추세 구조, 멀티 타임프레임 분석, 캔들 패턴 및 통계적 최적화 를 하나의 분석 프레임워크로 결합합니다. 두 가지 적응형 모드 Dual Alpha Trend Mode 낮은 타임프레임과 높은 타임프레임에서 적합한 Alpha Trend 파라미터를 자동으로 탐색하여, 최근 시장 움직임에 맞춰 추세 분석을 조정합니다. Candlestick + Alpha Mode Alpha Trend를 통한 시장 국면 분석과 22개의 상승 및 하락 캔들 패턴 을 결합합니다. 모든 패턴을 동일하게 취급하는 대신, 다양
FX Levels Premium indicator for MT5
Renaud Herve Francois Candel
Fx Levels Premium Indicator Support and Resistance are important concepts in trading. Fx Levels Premium was created to easily draw important levels of support and resistance for the active trader. The indicator will give you all important levels (support/resistance) to watch for a wide range of assets. Trading without these levels on your chart is like driving a car for a long journey without a roadmap. You would be confused and blind. Support and resistance levels should be used as guideline
OrderFlux – MetaTrader 5용 Order Flow Footprint Chart, Volume Profile 및 Market Profile 지표 OrderFlux는 MetaTrader 5용 오더 플로우 Footprint 지표로, 각 캔들 내부에서 실제로 어떤 거래가 발생하는지 명확하게 보여줍니다. 개별 캔들을 펼쳐 각 가격 수준에서 체결된 거래량을 표시하고, 공격적인 매도와 공격적인 매수를 구분합니다. 틱 데이터를 기반으로 실시간 Footprint 차트를 구성하며, Delta, Imbalance, Absorption, Volume Profile, Market Profile(TPO), VWAP, Cumulative Delta(CVD), DOM 탭 및 경제 캘린더를 하나의 정돈되고 읽기 쉬운 인터페이스에 통합합니다. 일반적인 차트는 시가, 고가, 저가, 종가만 보여줍니다. 이는 가격 움직임의 결과이지 원인은 아닙니다. OrderFlux는 오더 플로우 트레이딩의 핵심 질문에
Meridian Pro
Ottaviano De Cicco
4 (3)
Meridian Pro 2.00: Professional Multi-Timeframe Trend Matrix for MT5 Meridian Pro 2.00 is a professional adaptive trend matrix for MetaTrader 5. It combines the original Meridian trend engine, a clean chart ribbon, closed-bar signal arrows, an 8-timeframe dashboard, Fuel momentum, weighted consensus, synthetic HTF processing and chart-native higher-timeframe context lines. The goal is simple: read current trend, multi-timeframe structure, strength, momentum and EA-ready state from one discipline
Apollo SR Master는 지지/저항 구간에서의 거래를 더욱 쉽고 안정적으로 만들어 주는 특수 기능을 갖춘 지지/저항 지표입니다. 이 지표는 지역 가격의 고점과 저점을 감지하여 시간 지연 없이 실시간으로 지지/저항 구간을 계산합니다. 새롭게 형성된 저항 구간을 확인하기 위해 지표는 해당 저항 구간을 실제 매도 또는 매수 신호로 활용할 수 있음을 나타내는 특수 신호를 표시합니다. 이 경우, 저항 구간의 강도가 높아지고, 따라서 저항 구간에서의 성공적인 거래 가능성도 높아집니다. 이것이 바로 이 지표의 핵심 아이디어입니다. SR 존은 손절매와 이익실현을 더욱 쉽게 할 수 있도록 해줍니다. 신호 방향에 따라 SR 존 위 또는 아래 공간을 손절매로 활용할 수 있습니다. 또한, 반대쪽 SR 존은 잠재적 이익실현 영역으로 활용할 수 있습니다. 또한 Apollo SR Master 지표를 사용하는 모든 사용자에게 "Apollo Price Action System" 지표를 무료로 제공합니다.
Neuro Poseidon MT5
Daria Rezueva
4.68 (53)
Neuro Poseidon is a new indicator by Daria Rezueva. It combines precise trading signals with adaptive TP/SL levels - creating best possible trades as a result! Message me and get  Neuro Poseidon Assistant  as a gift to automize your trading process! What makes it stand out? 1. Proven profitability on all assets and timeframes 2. Only confirmed BUY and SELL signals present on the chart 3. Adaptive TP & SL levels generated by the software for each trade 4. Easy to understand - suitable for al
Trend Lines PRO MT5
Roman Podpora
5 (1)
트렌드 라인즈 프로       이 지표는 시장이 실제로 어떤 방향으로 전환되는지 파악하는 데 도움이 됩니다. 실제 추세 반전 지점과 주요 시장 참여자들이 다시 진입하는 지점을 보여줍니다. 보시다시피       BOS 라인       복잡한 설정이나 불필요한 노이즈 없이 더 높은 시간대의 추세 변화와 주요 레벨을 확인할 수 있습니다. 신호는 차트에 다시 그려지지 않고 캔들이 마감된 후에도 계속 표시됩니다. VERSION MT 4   -   RFI LEVELS PRO   표시기   와 결합할 때 최대 잠재력을 발휘합니다. 지표가 보여주는 내용: 실제 변화       추세(BOS 라인) 한 번 신호가 나타나면 그 신호는 계속 유효합니다! 이는 신호를 발생시킨 후 변경될 수 있는 리페인팅 방식의 지표와 중요한 차이점입니다. 리페인팅 방식의 지표는 잠재적으로 자금 손실로 이어질 수 있습니다. 이제 더욱 높은 확률과 정확도로 시장에 진입할 수 있습니다. 또한 화살표가 나타난 후 목표가(익절)
ARICoins
Temirlan Kdyrkhan
ARICoin is a powerful trading companion designed to generate high-probability entry signals with dynamic TP/SL/DP levels based on volatility. Built-in performance tracking shows win/loss stats, PP1/PP2 hits, and success rates all updated live. Key Features: Buy/Sell signals with adaptive volatility bands Real-time TP/SL/DP levels based on ATR Built-in MA Filter with optional ATR/StdDev volatility Performance stats panel (Success, Profit/Loss, PP1/PP2) Alerts via popup, sound, push, or email Cust
Bill Williams Advanced
Siarhei Vashchylka
5 (11)
Bill Williams Advanced is designed for automatic chart analysis using Bill Williams' "Profitunity" system. The indicator analyzes four timeframes at once. Manual (Be sure to read before purchasing) Advantages 1. Analyzes the chart using Bill Williams' "Profitunity" system. Signals are displayed in a table in the corner of the screen and on the price chart. 2. Finds all known AO and AC signals, as well as zone signals. Equipped with a trend filter based on the Alligator. 3. Finds "Divergence Bar
TPA True Price Action indicator reveals the true price action of the market makers through 100% non-repainting signals strictly at the close of a candle! TPA shows entries and re-entries, every time the bulls are definitely stronger than the bears and vice versa. Not to confuse with red/green candles. The shift of power gets confirmed at the earliest stage and is ONE exit strategy of several. There are available now two free parts of the TPA User Guide for our customers. The first "The Basics"
Superhero
Ihor Otkydach
5 (3)
SUPERHERO 지표는 “올인원” 방식으로 설계된 다중 통화 거래 시스템입니다. 이 지표는 시장을 독자적으로 분석하여 포지션을 개설하고 청산할 시점에 대한 신호를 제공합니다. 손절매(Stop Loss) 및 익절(Take Profit) 주문을 활용하며, 위험 대비 수익 비율(R:R)은 1:1입니다. 이 시스템은 스마트폰으로 푸시 알림을 전송할 수 있으므로, PC에 묶여 있을 필요 없이 “이동 중에도” 매매를 할 수 있습니다. 이는 자체 거래 전문 회사에 안성맞춤입니다. 모든 고객님께 드리는 특별 혜택: 이 지표를 구매하시는 모든 분께는 제가 특별히 준비한 유틸리티를 선물로 드릴 예정이며, 이 유틸리티는 다음과 같은 기능을 제공합니다: 손절매 및 익절 주문을 자동으로 설정합니다 가격이 목표 수준에 도달하면 자동으로 포지션을 청산합니다 미결제 주문 거래를 지원합니다 평균화 거래 모드를 지원합니다 이 훌륭하고 매우 편리한 유틸리티를 선물로 받고 싶으시다면, SUPERHERO 지표를 구매하
RSI Thunder MT5
Muhammad Abdulrahman Omar Naima Allah Al-rais
RSI Thunder 는 정확하고 신뢰할 수 있는 거래 신호를 원하는 트레이더를 위해 개발된 고급 트레이딩 지표입니다. 모든 신호는 캔들이 완전히 종료된 후에만 생성되어 리페인트 문제를 완전히 제거합니다. RSI, EMA, ADX, ATR 을 하나의 논리적 시스템으로 결합하고 SMA40 추세 필터를 통해 방향성을 확실히 합니다. 최근 5개의 캔들을 분석하여 명확한 가격 구조가 형성될 때만 신호를 제공합니다. 매수 및 매도 신호는 차트에 직관적인 화살표로 표시됩니다. ATR 기반 자동 Take Profit 수준이 함께 제공되어 효율적인 거래 관리가 가능합니다. 가볍고 빠르게 작동하며 M15, M30, H1 타임프레임에 최적화되어 있습니다. RSI Thunder 는 단순한 지표가 아닌 완성된 트레이딩 시스템입니다.
ScalpPoint
Temirlan Kdyrkhan
ScalpPoint is a powerful trading companion designed to generate high-probability entry signals with dynamic TP/SL/DP levels based on volatility. Built-in performance tracking shows win/loss stats, PP1/PP2 hits, and success rates — all updated live. Key Features: Buy/Sell signals with adaptive volatility bands Real-time TP/SL/DP levels based on ATR Built-in MA Filter with optional ATR/StdDev volatility Performance stats panel (Success, Profit/Loss, PP1/PP2) Alerts via popup, sound, push, or emai
The Oracle Pro
Ottaviano De Cicco
5 (1)
The Oracle Pro: Synthetic Multi-Timeframe Bias Engine for MT5 The Oracle Pro is a premium multi-timeframe bias engine for MetaTrader 5, built for demanding and professional traders. It answers one question with discipline: what is the directional bias on each timeframe right now, how strong is it, and how much do the timeframes agree? Everything is computed on closed bars only - no repainting. The Oracle Pro is a multi-factor consensus system. It combines proprietary indicators and optimized alg
AriFocus
Temirlan Kdyrkhan
AriFocus - Non-Repainting Buy/Sell Signals AriFocus - one clear signal. AriFocus marks buy and sell signals directly on the chart and suggests a stop-loss level for each one. Every signal is confirmed on bar close and never repaints. - Buy/sell arrows, confirmed on bar close - Suggested stop-loss level for every signal - Trend band and candle coloring to show direction at a glance - 10 ready-made presets, or your own settings (14 calculation methods) - Pop-up, push and email alerts with entr
Boom Crash GainX PainX Spike Detector Overview Boom Crash GainX PainX Spike Detector is a professional analytical indicator for Deriv synthetic indices. It is designed to identify potential spike opportunities using multiple technical indicators, price movement analysis, and tick-based cycle monitoring. The indicator supports both market directions in one tool: Boom and GainX: BUY signals for potential upward spikes. Crash and PainX: SELL signals for potential downward spikes. The indicator auto
Volatility Master for MetaTrader is a real-time dashboard tool that scans up to  50 symbols  to identify high-volatility , trending markets instantly. With bullish/bearish signals, customizable alerts, and a user-friendly interface, it helps you avoid range-bound conditions and focus on high-probability trades. Clarity leads to confidence. Trade confidently and protect your capital effectively with this powerful dashboard. We don't offer free or bonus indicators in exchange of reviews from you.
제작자의 제품 더 보기
Ultra Prokit Tool
Francis Muchai Waweru
ULTRA PRO TOOLKIT EA Draw it. Size it. Execute it. Most charts are buried under tools that refuse to talk to each other. You mark a level in one place, work out your lot size somewhere else, then hand-type an order and hope you remembered the stop. Ultra Pro Toolkit EA puts the entire workflow on one panel: sketch your market structure, tell it how many dollars you are willing to lose, and let it handle the arithmetic and the order routing. ️ This is a manual trading cockpit, not a signal
필터:
리뷰 없음
리뷰 답변