Impulse Heatmap
- 지표
-
Rawal Riaz
 Never miss a turn—capture market reversals effortlessly.
 - 버전: 1.0
- 활성화: 5
The Impulse Heatmap Indicator is an advanced volume and price distribution tool designed to help traders visualize market momentum and locate critical areas of liquidity. By analyzing volume distribution across various price levels over a specified lookback period, this indicator paints a dynamic heatmap directly on your chart, bringing hidden market mechanics into plain sight.
This tool is built for traders who want to move beyond standard price action and understand where the bulk of trading activity is taking place within a given trend.
🌟 Core Features
Dynamic Volume Heatmap The core of the indicator is its visual heatmap overlay. It tracks trading volume across different price levels and uses a color gradient to highlight areas of high and low activity. "High heat" zones indicate heavy accumulation or distribution, allowing you to instantly spot significant price zones that may act as future support or resistance.
Smoothed Point of Control (POC) Line The indicator calculates the Point of Control—the exact price level where the highest volume of trading occurred within your chosen period. To make this data more actionable and less noisy, a customizable smoothing algorithm is applied. This dynamic POC line follows price action and serves as a powerful visual anchor for the current market structure.
Underlying Trend Filtration Context is everything. The indicator incorporates an underlying trend filter using a built-in Exponential Moving Average (EMA). This ensures that the volume data and heatmap context are evaluated alongside the broader market direction, helping you understand whether volume is backing a bullish impulse or a bearish rejection.
💡 How to Use the Impulse Heatmap
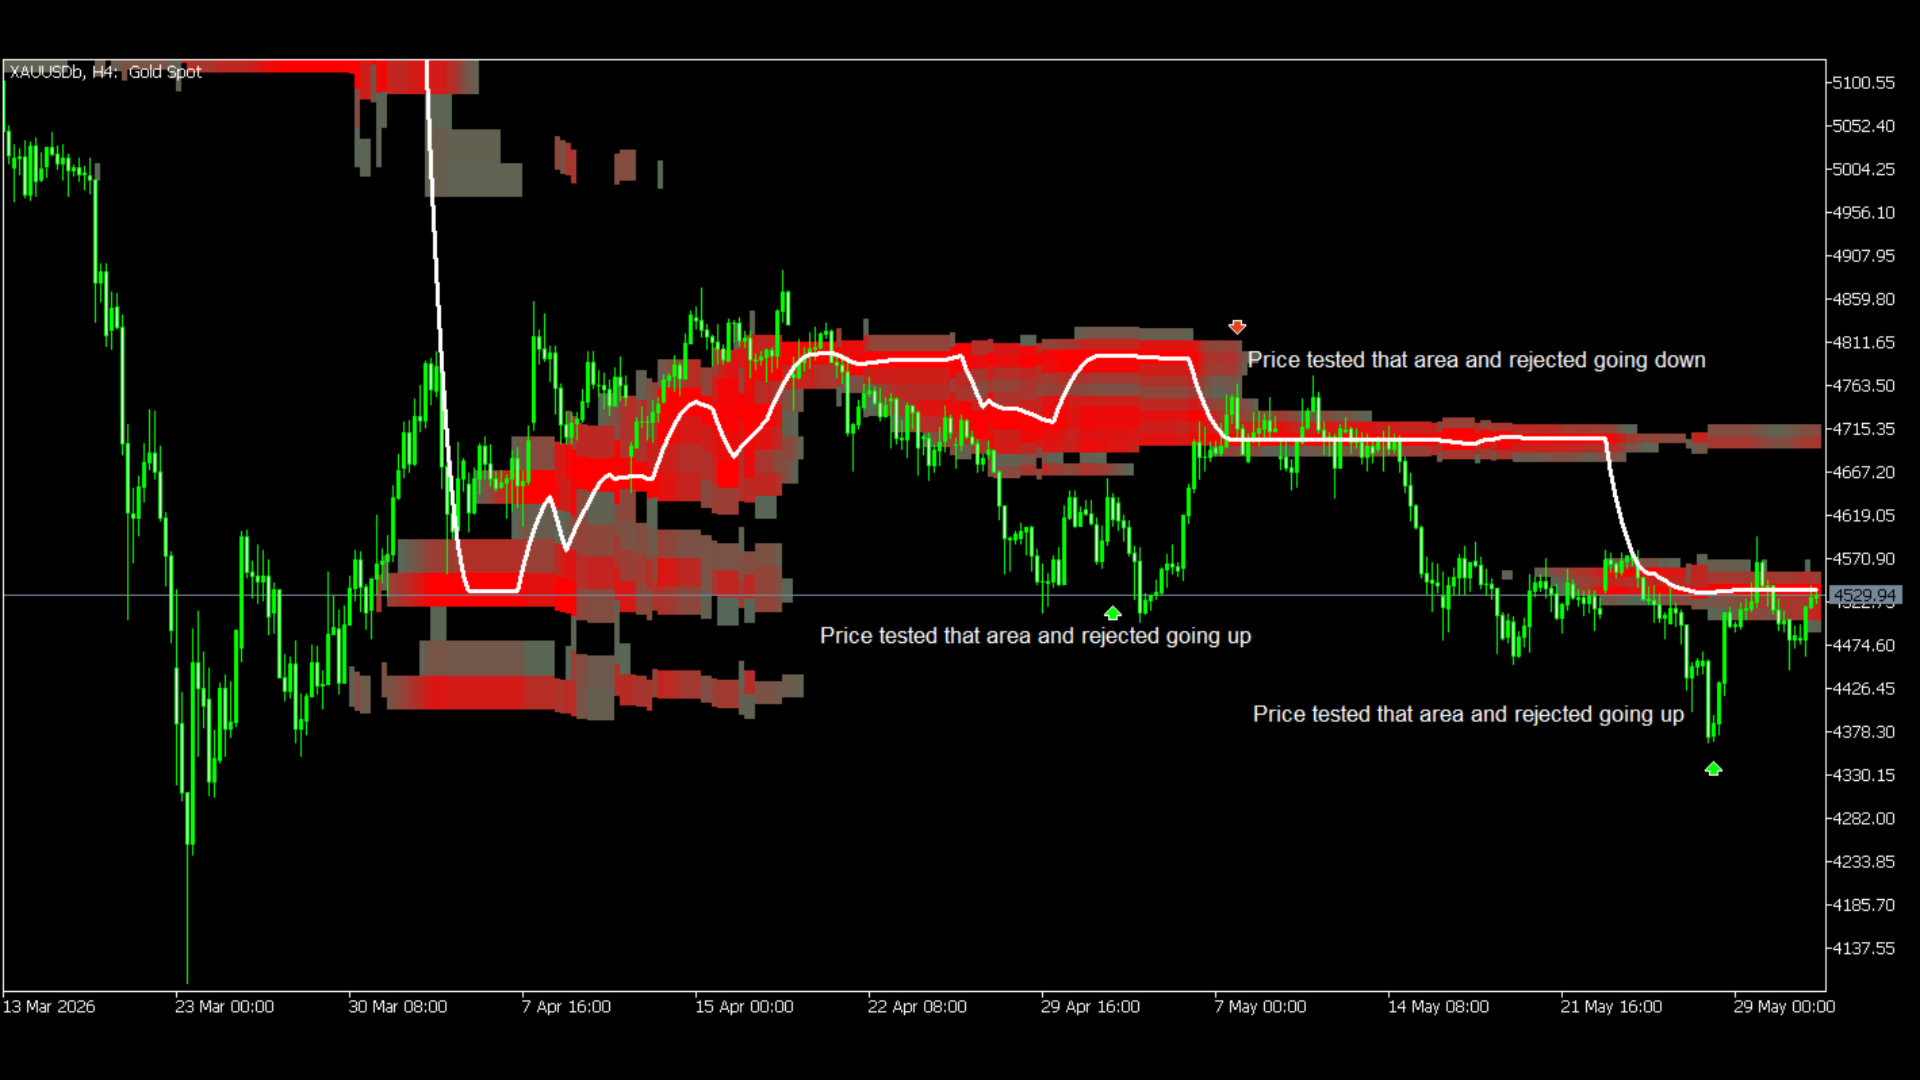
The visual intensity of the heatmap directly correlates to historical market activity. The brighter and "hotter" the color (e.g., bright red), the denser the volume at that specific price point. These dense nodes represent strong structural zones that can be traded independently based purely on price action and volume density.
🟢 Evaluating Potential Long (Buy) Scenarios
Conditions to Look For:
Established Support: Price action must be actively trading above a dense volume accumulation zone. In this configuration, the high-heat area beneath the current price acts as a heavy structural support floor.
The Retracement: Wait for the price to pull back down into this underlying volume zone. As price tests this dense foundation from above, traders can evaluate the area for potential long entries, anticipating a bounce off the historical volume wall.
🔴 Evaluating Potential Short (Sell) Scenarios
Conditions to Look For:
Established Resistance: Price action must be actively trading below a dense volume accumulation zone. In this configuration, the high-heat area above the current price acts as a heavy overhead resistance ceiling.
The Retracement: Wait for the price to rally or pull back upward into this overhead volume zone. As price tests this dense barrier from below, traders can evaluate the area for potential short entries, anticipating a rejection from the historical volume wall.
Pro Tip: You do not need to wait for secondary confirmation triggers to find value in this tool. The density of the volume itself is the primary indicator—the stronger the heat, the more significant the level. Focus on trading the reactions around these established volume density zones.
⚙️ Customization & Settings
The indicator is designed to keep your chart clean while offering essential adjustments in the settings:
Period: Adjust the lookback length to determine how much historical data the heatmap and POC analyze. (Higher values suit higher timeframes).
POC Smooth: Fine-tune the reactivity of the POC line. Lower values make it hug recent volume spikes tightly, while higher values provide a smoother, longer-term trajectory.
Visuals: Fully customize the Heatmap Opacity and your High Heat Color to match your chart's theme, and toggle the POC line on or off as needed.
Disclaimer: This indicator is designed for educational and analytical purposes only. It visualizes historical volume and price data and does not guarantee future market movements.
This tool is built for traders who want to move beyond standard price action and understand where the bulk of trading activity is taking place within a given trend.
🌟 Core Features
Dynamic Volume Heatmap The core of the indicator is its visual heatmap overlay. It tracks trading volume across different price levels and uses a color gradient to highlight areas of high and low activity. "High heat" zones indicate heavy accumulation or distribution, allowing you to instantly spot significant price zones that may act as future support or resistance.
Smoothed Point of Control (POC) Line The indicator calculates the Point of Control—the exact price level where the highest volume of trading occurred within your chosen period. To make this data more actionable and less noisy, a customizable smoothing algorithm is applied. This dynamic POC line follows price action and serves as a powerful visual anchor for the current market structure.
Underlying Trend Filtration Context is everything. The indicator incorporates an underlying trend filter using a built-in Exponential Moving Average (EMA). This ensures that the volume data and heatmap context are evaluated alongside the broader market direction, helping you understand whether volume is backing a bullish impulse or a bearish rejection.
💡 How to Use the Impulse Heatmap
The visual intensity of the heatmap directly correlates to historical market activity. The brighter and "hotter" the color (e.g., bright red), the denser the volume at that specific price point. These dense nodes represent strong structural zones that can be traded independently based purely on price action and volume density.
🟢 Evaluating Potential Long (Buy) Scenarios
Conditions to Look For:
Established Support: Price action must be actively trading above a dense volume accumulation zone. In this configuration, the high-heat area beneath the current price acts as a heavy structural support floor.
The Retracement: Wait for the price to pull back down into this underlying volume zone. As price tests this dense foundation from above, traders can evaluate the area for potential long entries, anticipating a bounce off the historical volume wall.
🔴 Evaluating Potential Short (Sell) Scenarios
Conditions to Look For:
Established Resistance: Price action must be actively trading below a dense volume accumulation zone. In this configuration, the high-heat area above the current price acts as a heavy overhead resistance ceiling.
The Retracement: Wait for the price to rally or pull back upward into this overhead volume zone. As price tests this dense barrier from below, traders can evaluate the area for potential short entries, anticipating a rejection from the historical volume wall.
Pro Tip: You do not need to wait for secondary confirmation triggers to find value in this tool. The density of the volume itself is the primary indicator—the stronger the heat, the more significant the level. Focus on trading the reactions around these established volume density zones.
⚙️ Customization & Settings
The indicator is designed to keep your chart clean while offering essential adjustments in the settings:
Period: Adjust the lookback length to determine how much historical data the heatmap and POC analyze. (Higher values suit higher timeframes).
POC Smooth: Fine-tune the reactivity of the POC line. Lower values make it hug recent volume spikes tightly, while higher values provide a smoother, longer-term trajectory.
Visuals: Fully customize the Heatmap Opacity and your High Heat Color to match your chart's theme, and toggle the POC line on or off as needed.
Disclaimer: This indicator is designed for educational and analytical purposes only. It visualizes historical volume and price data and does not guarantee future market movements.