Combined MT4
- 지표
-
Ahmed Alaaeldin Abdulrahman Ahmed Elherzawi
 Every day is a new opportunity. You can build on yesterday's success or put its failures behind and start over again. That's the way life is, with a new game every day, and that's the way baseball is.
 - 버전: 1.2
- 업데이트됨: 4 2월 2023
- 활성화: 5
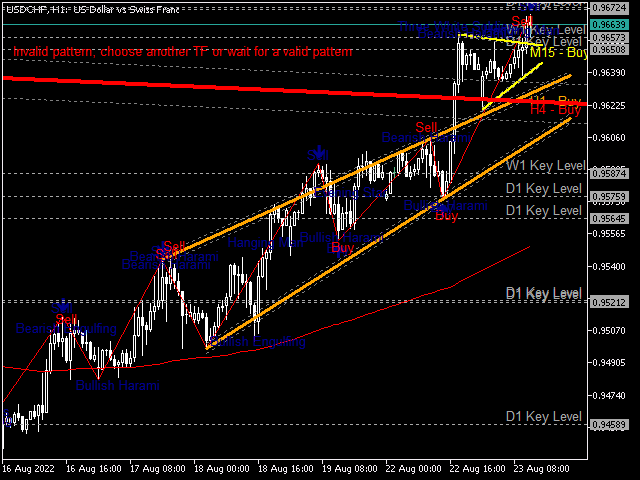
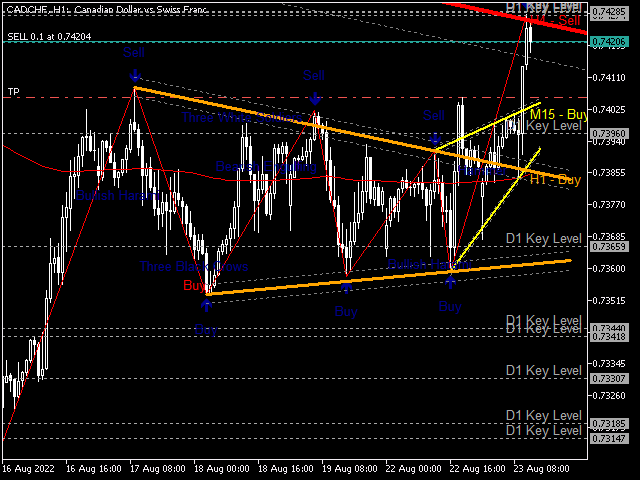
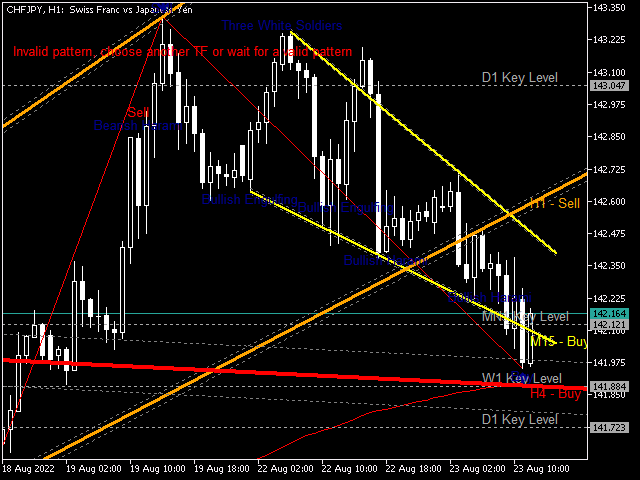
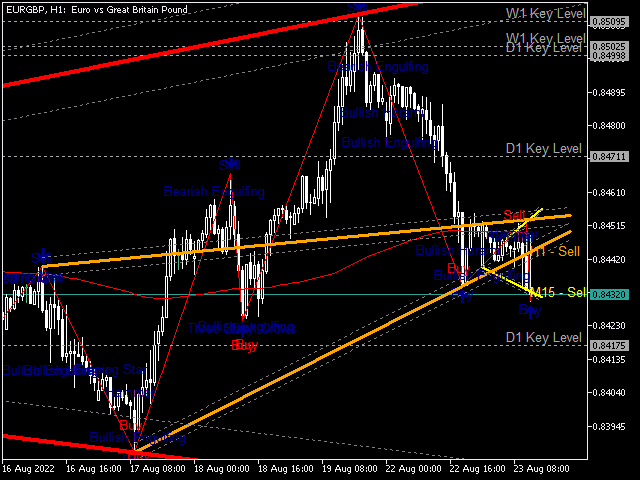
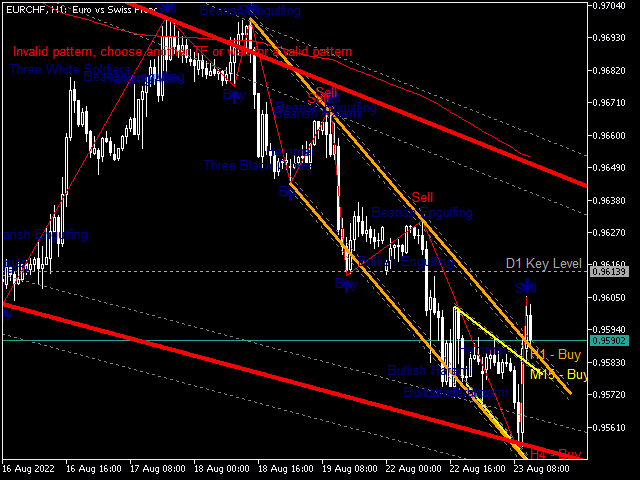
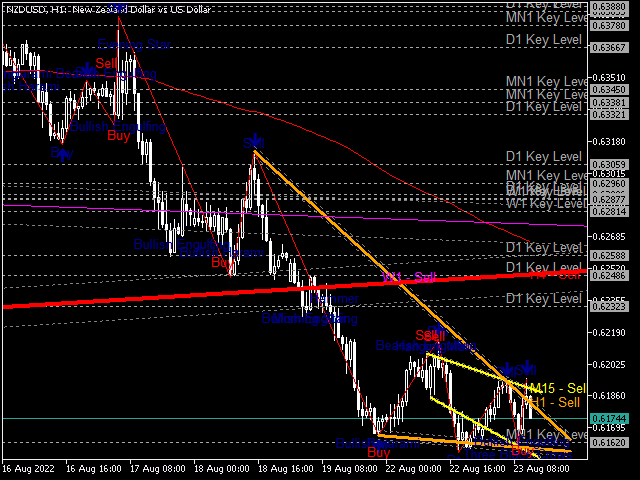
Investment Castle Combined — Three Indicators, One Clear View
The Combined indicator merges three of our tools — including the multi-timeframe Bands indicator — into a single, clear multi-timeframe view, so you can read trend, structure and momentum without cluttering your chart. Exclusive to the MQL5 Market.
What it does for you
- Three indicators in one: a unified multi-timeframe reading on a single chart.
- Multi-timeframe by design: see what matters across timeframes at a glance.
- Cleaner charts: one tool instead of three separate overlays.
- Works everywhere: any symbol, any timeframe.
Who it is for: traders who want a consolidated, multi-timeframe read of the market.
Risk warning: trading involves substantial risk of loss. Always test on a demo account first and use risk settings you are comfortable with. Past performance does not guarantee future results.