Smart Pivot Points MT4

MetaTrader 4용 스마트 피벗 포인트 - 스마트 트레이딩을 위한 명확한 레벨
스마트 피벗 포인트는 MetaTrader 4용 전문 지표로, 차트에 주요 트레이딩 레벨을 자동으로 계산하여 표시해 줍니다. 복잡한 가격 움직임을 명확하고 구조화된 지도로 변환하여 지지선, 저항선, 가격 균형점, 그리고 잠재적 목표가를 강조합니다. 명확성을 중시하는 트레이더를 위해 설계된 이 도구는 외환, 암호화폐(비트코인, 이더리움), 주가지수, 주식, 원자재(XAUUSD) 등 모든 시장에서 활용 가능합니다.

이 지표는 계산 시간을 절약하고 분석에 객관성을 더하는 믿음직한 분석 도우미입니다. 시장 신호를 제공하거나 트레이딩 결정을 대신해 주는 것이 아니라, 트레이더 스스로 정보에 기반한 트레이딩 결정을 내릴 수 있도록 고품질의 정보를 제공합니다.

주요 기능 및 이점
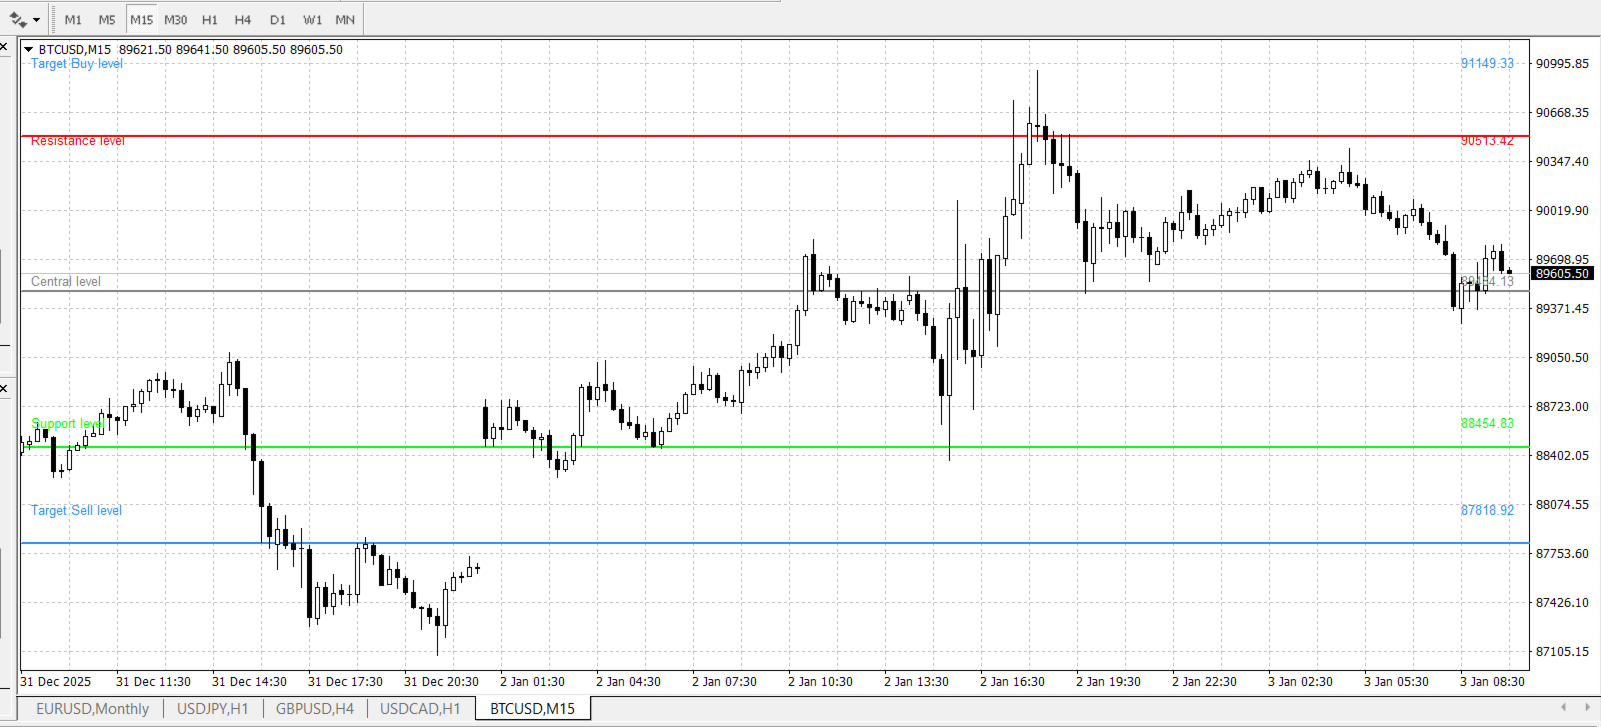
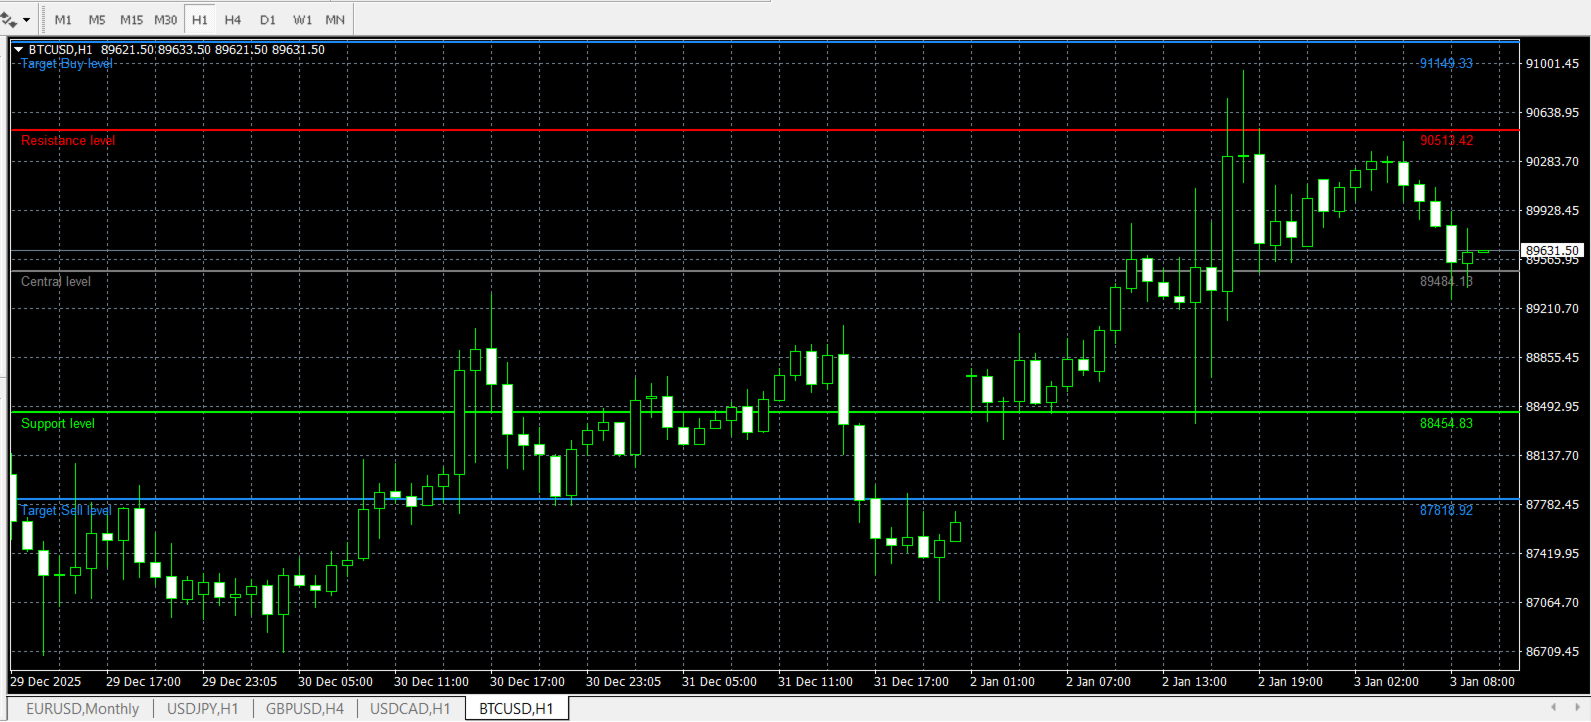
바로 사용 가능한 가격 좌표 시스템: 더 이상 레벨을 수동으로 그릴 필요가 없습니다. 중심 레벨(균형점), 지지선, 저항선, 매수 목표가, 매도 목표가 등 5개의 명확한 선이 차트에 즉시 나타납니다.

완벽한 시각적 맞춤 설정: 표시할 항목을 직접 결정할 수 있습니다. 레벨 그룹과 가격 레이블을 간편하게 활성화 또는 비활성화하여 차트를 전략에 맞게 조정하고 작업 공간을 깔끔하게 유지할 수 있습니다.

완벽한 계산 유연성: 스캘핑을 위한 분 단위(M5, M15)부터 스윙 트레이딩을 위한 일 단위(D1) 및 주 단위(W1)까지 원하는 시간 프레임을 선택하여 계산할 수 있습니다. 사용할 과거 데이터 기간 수를 지정하여 분석 깊이를 조절할 수 있습니다.

전문적이고 깔끔한 디자인: 레벨은 직관적이고 가격 모니터링에 방해가 되지 않도록 잘 구성된 색상 체계(회색, 녹색, 빨간색, 파란색)로 표시됩니다.

스마트 피벗 포인트 활용법
이 지표는 선택한 기간의 가격 데이터(고가, 저가, 시가, 종가)를 사용하여 검증된 알고리즘에 따라 자동으로 레벨을 표시합니다. 이를 통해 계산보다는 분석에 집중할 수 있습니다.

일반적인 사용 사례:

진입 시점 계획: 지지선 부근에서 매수 기회를, 저항선 부근에서 매도 기회를 찾습니다. 이 지표는 잠재적인 추세 반전 및 반등 지점을 식별하는 데 도움이 됩니다.

목표 수익 설정: 매수 및 매도 목표 레벨은 논리적이고 합리적인 수익 실현 기준 역할을 하여, 임의로 목표를 설정할 필요성을 없애줍니다.

거래 위험 및 잠재력 평가: 레벨 간의 거리를 통해 포지션 진입 전 잠재적인 손익비(리스크-리워드)를 시각적으로 평가할 수 있습니다.

시장 상황 확인: 피벗 포인트 대비 가격 위치를 통해 선택한 시간대의 현재 시장 상황(상승 또는 하락)을 빠르게 파악할 수 있습니다.

모든 거래 전략 강화: 가격 움직임, 오실레이터 또는 추세 지표를 기반으로 하는 객관적인 스마트 피벗 포인트를 시스템에 추가하여 추가적인 확인 근거를 확보하세요.

시작은 간단합니다.
구매 및 설치: MQL5 마켓에서 스마트 피벗 포인트를 구매하세요. "설치" 버튼을 클릭하면 지표가 자동으로 다운로드되어 MetaTrader 4 터미널에 나타납니다.

차트에 추가: 원하는 자산과 시간대의 차트를 엽니다. "내비게이터" 창에서 Smart Pivot Points를 찾아 차트로 드래그하세요.

기본 설정(선택 사항): 팝업 창에서 두 가지 주요 매개변수인 계산 기간(CalculationTF)과 과거 데이터 기간(LookbackPeriods)을 즉시 설정할 수 있습니다.

분석 및 거래: 생성된 레벨 그리드를 거래 계획의 일부로 활용하여 의사 결정을 내리세요.

기술 요구 사항 및 지원
플랫폼: MetaTrader 4만 지원합니다.

지원: 모든 구매자에게 MQL5 메시징 시스템을 통해 무료 지표 업데이트 및 기술 지원이 제공됩니다.

호환성: 이 지표는 컴퓨터와 가상 사설 서버(VPS) 모두에서 안정적으로 작동합니다.

위험 경고
금융 시장 거래는 투자 원금 손실의 위험이 높습니다. Smart Pivot Points는 분석 도구일 뿐 수익을 보장하는 시스템이 아닙니다. 실제 자금으로 사용하기 전에 데모 계정에서 지표를 테스트해 보세요. 거래 결정에 대한 책임은 항상 사용자에게 있습니다. 손실을 감당할 수 있는 자금으로만 거래하세요.

스마트 피벗 포인트 – 거래에 명확성을 더하여 가장 중요한 것에 집중할 수 있도록 도와줍니다.

추천 제품
VaviStar is an indicator based on trend retracements determined by ZigZag segments. It is theorized, and statistics confirm, that stocks react to certain retracement levels. Many use Fibonacci retracement levels (23.6%, 38.2%, 61.8%). It is assumed that once the price goes beyond the 61.8% retracement, we can already speak of a trend reversal. This indicator allows you to comfortably chart a segment of the ZigZag with the relative operating levels chosen. With a reversal mindset , you can use it
Fibonacci Trend Marker
Grigoriy Malychenko
Fibonacci Trend Marker   — is a trend indicator that analyzes the behavior of the current candle relative to the High-Low (HL) range of previous candles using Fibonacci retracement levels. It visually tracks trend strength, signaling potential weakening or reversal through a change in candle color. Features: Designed for trend-focused traders, it helps quickly identify trend changes based on Fibonacci levels. Effective on any timeframe with sufficient market volatility, when a sequence of 3–5 c
Moving Average Alert Plus
Christianiel Robles Faustino
Moving average alert plus  is an advance moving average alert that   will easily monitor the price action based on set moving averages to multiple open charts.  Objective:   To monitor multiple open charts and notify traders conveniently in a single display panel when using the moving averages to enter/exit a trade. Features: Monitor price action in two timeframes at the same time Supports simple, exponential, smoothed, linear weighted moving averages Trigger an alert based on candle size (full/
Indicador de Bandas de Fibonacci para Metatrader 4 . Este indicador funciona de forma similar a las conocidas Bandas de Bollinger clásicas, pero en lugar de usar la desviación estándar para trazar las bandas usa números de Fibonacci y el ATR (Average True Range). Puede usarse para trazar niveles de soporte y resistencia que pueden emplearse en sistemas de scalping de corto plazo y swing trading.  Las bandas del indicador son calculadas de la siguiente forma: Línea central : Media móvil de n peri
FREE
Indicador de Fibonacci Semanal para MT4 Maximize suas operações no mercado financeiro com o Indicador de Fibonacci Semanal para MetaTrader 4 (MT4) , a ferramenta essencial para traders que buscam identificar pontos estratégicos de suporte e resistência com base na ação do preço da última semana. Principais Recursos: Atualização Automática : O indicador recalcula os níveis de Fibonacci automaticamente a cada novo candle semanal. Níveis Personalizados : Traça apenas os níveis essenciais de Fibonac
FREE
DailyHit
Elisabet Corrales Rodriguez
Read carefully, because I’m about to sell my strategy based on over 11 years of study: This indicator plots multiple levels: thick and dotted, taking the ATR into account. On 90% of trading days, it touches one thick level and one dotted level. Levels are updated daily. If the price touches a thick level and a dotted level in a single day, trading for that day is over—you wait for the next day to look for the same setup. If the price comes very close to a level but doesn’t reach it, it’s likely
Top Movers Spotlight v1.0 See the strongest moves. Trade with confidence. Act faster. Stop wasting time flipping through charts. Top Movers Spotlight v1.0  is a powerful forex dashboard that instantly shows you: what’s moving in which direction and whether that move is actually strong Built for serious traders, this tool combines: ATR-normalized momentum multi-timeframe analysis true currency strength So you can focus only on the best opportunities — and ignore the noise. What Makes It Differe
Fibonacci Wave Bands
Luc Michael Botes
Fibonacci Wave Bands Indicator The Fibonacci Wave Bands indicator utilizes Fibonacci ratios to create dynamic bands around a central moving average. These bands are derived from key Fibonacci ratios (typically 38.2%, 50%, 61.8%) and adapt to market volatility, offering insights into potential support and resistance zones. Key Features: Fibonacci Levels: The indicator plots multiple bands above and below a central moving average based on Fibonacci ratios. Dynamic Support and Resistance: Bands ser
Open Momentum
Claus Dietrich
Optimized for Asia- London- US- Open-Session  the best Features from MOMENTUM-SOLO true Momentum - time-based Indicator it's based on a self-developed candle Pattern, in relation to the ATR Filter Daytime Weekdays Moving Averages Keltner-Channel MACD Advantages Optimised for Asia- London- US- Open-Session choose your personal times to trade - select Daytime and Weekdays Keltner-Channel => to reduce market noise - sideways movement will be hidden 3x Moving Averages => for the Trend,
Auto AndrewFork
Noor Ghani Rahman
1 (1)
Auto Pitchfork Indicator The indicator calculate the Pitch fork for the previous Day (Selectable) with multiple Support and Resistance lines from the Median price which acts as Magnet for the Price that if price touch the above warning (1) or below warning (1) lines and not cross up or down then there is maximum possibilities that it will return to the Median Line, and thus maintain the Price Action in Cyclic Pattern to the Market Move. You are able to select how many warning lines you want to k
A Fibonacci indicator is best used with other indicators like Pivots, Support/Resistance etc. Price tends to use Fibo levels as Support or Resistance lines. So, this indicator is very useful to know when price might reverse or if a level is crossed, price might continue the trend. Also, to find the best Take Profit and StopLoss lines. Don't use Fibo Indicator alone for trading as it might not always be accurate. Use it to make your strategies better as a supporting indicator. Settings: Auto Fib
FREE
Please contact me at telegram  https://t.me/smartforex7 After purchasing SmartForex Indicator then Use This Indicator...................... SMART EXIT PROFIT LINE Indicator is very Helpful with SmartForex Indicator ........................................ SMART EXIT PROFIT LINE Indicator Attach with SmartForex Indicator after then Red Line Show Exit buy Profit , Green Line show Exit Sell Profit................
FREE
Water Mark Pro MT4
Robby Suhendrawan
TradingView Style Chart Watermark Transform your MetaTrader 4 charts to look as elegant and professional as TradingView. Are you tired of the default, plain look of MetaTrader? WaterMark MT4 is a lightweight, fully customizable indicator designed to enhance your charting experience by adding sleek, modern watermarks directly to your trading terminal. This indicator bridges the visual gap between standard MetaTrader charts and premium web based charting platforms. It allows you to display the cur
FREE
The indicator draws trend lines based on Thomas Demark algorithm. It draws lines from different timeframes on one chart. The timeframes can be higher than or equal to the timeframe of the chart, on which the indicator is used. The indicator considers breakthrough qualifiers (if the conditions are met, an additional symbol appears in the place of the breakthrough) and draws approximate targets (target line above/below the current prices) according to Demark algorithm. Recommended timeframes for t
UPD1 Fibo Levels
Vitaliy Kuznetsov
5 (3)
표시기는 지정된 수의 양초를 분석하고 고가를 기준으로 피보나치 수준을 표시합니다. 레벨이 재정렬되기 때문에 범위의 오른쪽에 관심이 있습니다. 가격은 레벨을 자화하고 터치에 반응합니다. 이 도구를 사용하여 수정 후 추세 진입점을 찾습니다. 왼쪽에서 레벨이 완벽하게 상승한 것을 보면 극한 지점에서 움직임의 끝을 발견했다고 가정할 수 있습니다. 모든 선은 버퍼 또는 개체를 통해 그려집니다(선택 사항). 입력 매개변수. Bars Count - 계산 범위. Visual Button - 버튼 표시(활성화/비활성화). Corner - 버튼 앵커 각도. X indent - 픽셀의 수평 패딩. Y indent - 픽셀의 수직 패딩. Label Visual - 디스플레이 레벨 레이블. Label Font Size   - 글꼴 크기. Label Shift Bars   - 비문의 들여쓰기(촛불의 수). Label Tooltip   - 레벨 위의 커서 아래에 텍스트 표시. Draw Lines  
FREE
PivotPro Ultimate – Professional Pivot Levels with Probability Analysis & Telegram Alerts KEY FEATURES Automatic Pivot Levels   – Previous day's High, Low, and Pivot plotted on your chart Real-Time Probability Calculator   – UP/DOWN/FLAT probabilities based on last 20 bars Telegram Integration   – Instant alerts on level touches and probability changes Day Labels   – Clear day-of-week markings (MON, TUE, WED...) Full History   – All levels remain on chart for complete historic
FREE
Pivot levels Auto V1
Hafis Mohamed Yacine
What Is a Pivot Point? A pivot point is a technical analysis indicator, or calculations, used to determine the overall trend of the market over different time frames. The pivot point itself is simply the average of the intraday high and low, and the closing price from the previous trading day. On the subsequent day, trading above the pivot point is thought to indicate ongoing bullish sentiment, while trading below the pivot point indicates bearish sentimen How to Use Pivot Points The very ess
This is a simple and efficient indicator based on market logic. The indicator creates a range chosen by a trader. Trader selects only two parameters. The first one is the number of candles that define the frame. The second one is the number of candles needed for confirmation frame. The indicator shows all situations in history and works with the actual movement of the market. The indicator works on all timeframes . You are not limited by use of different timeframes, the indicator is able to adap
The SFT Fibo Smart Pivot indicator is a powerful trading tool based on the Fibonacci Golden Ratio, designed to identify key support and resistance levels in the forex market. This indicator has the ability to pinpoint significant price levels that can serve as entry and exit points for trades. It enables traders to analyze the market more effectively and make well-informed decisions. The indicator uses the Fibonacci Golden Ratio to accurately determine support and resistance levels. These levels
FREE
Swing High Low Fibonacci
Frank Wesley Iii Mccallister
This indicator identifies the major and minor swing high and low points on a chart. It then takes the most recent swing and draws a fibonacci pattern of retracement and extension levels to give you an idea of where price may move next. It allow allows you to set a pair of moving averages to help identify the direction of the overall trend. There are configuration parameters for the major and minor swing and the moving averages.
Control Trading Support And Resistance Es un indicador independiente del TimeFrame que permite proyectar niveles más relevantes del mercado en función del plazo de tiempo de la operativa. Los colores del indicador están escogidos para diferenciar entre los diferentes tipos de niveles y destacar a los más relevantes. Este indicador permite visualizar en un mismo gráfico los posibles objetivos relevantes que los diferentes traders pueden emplear siguiendo diferentes tipos de operativas en funció
XFibo Auto Fibonacci
Welinton Dos Reis Goncalves
5 (1)
Use with disciplined risk management. Fibonacci entry system based on the golden zone 38.2 - 61.8 where the entry is confirmed at 23.6 with indications of Take Profit 3:1. Automatically plotted Fibonacci contains retracement and expansion Fibonacci in a single indicator. Up to 77% win rate with this system. FTMO challenge pass with 0.50% risk and 1.50% R:R.
MoveWave
Andriy Sydoruk
MoveWave - Moving waves are very handy indicators for determining pivot levels. Most Forex traders make decisions based on technical analysis. This type of analysis determines patterns and trends in the market. With the help of complex mathematical equations that are combined and made out in the form of this indicator, the trader will be able to more accurately determine the price reversal levels. Wave theory mathematically represents various behavioral models of the market. It is used as the ba
BeST_Fibonacci Retracement Lines is an MT4 Indicator that by default is based on common  Fibonacci levels but it can also draw any 3 desired levels of Retracement or Support of a trending move. It can be used to identify pullback points but also additionally as a kind of a Trailing Stop . BeST_Fibonacci Retracement Lines indicator: • by default draws 38.2%, 50% and 61.8% Retracement Levels of the current price move defined using the Highest High (HH) and Lowest Low (LL) of a desired Look Back Pe
Fibonacci Auto Levels
Mohamed yehia Osman
Possible Price reversals levels - based on  Fibonacci + Support +  Resistance Levels Auto levels drawn based on input index (Bars Count )  ---->>> Price Over 50% Fibo line ---> UP TREND ---> BUY when price drop near Support Lines  ---->>> Price Down 50% Fibo line ---> DOWN TREND ---> SELL when price goes up  near Resistance Lines  --->>> The more close price levels ----> the more possibility for price reversals --->>> are you a scalper --> try it on M1 charts with big index like 5000 bars  or
Pivot Pro with Alert Pivot points offer very good brands that are often run over by price. At these brands, reactions of the price arise. They can be used excellently as target zones, or as entrances. The alarm function allows several charts to be opened and it is very easy to find profitable entries. No missed entries through notification on the mobile phone. You can watch the market with Alerts. These settings can be changed: Width of the alarm zone Colors of all pivot lines Colors of the
The price is moving between two curve tunnel lines in a trend. The two lines of a tunnel represent support and resistance. In an uptrend, for instance, a trade might be entered at the support of the trend line (shown by the red line in the chart) and exited at resistance of the upper tunnel line (shown by the blue line). Tunnel show trend direction for any timeframe (if you have enough bars on the chart for higher timeframes). Trend, or price tunnel, can be up, down or sideways. If the current p
Newlevel
Sergey Nanov
Indicator. Zones of support and resistance levels The most reliable tool in the hands of any technical analyst is support and resistance levels.It is these levels that magically work in the market, because the price then bounces off them, on the contrary, gaining maximum acceleration, punching them and striving for a new price point.However, in practice, many beginners face enormous difficulties in building them.This is due to the fact that the price may react quite differently to them, and ofte
FREE
Fibo label
Damir Satridinov
5 (2)
Индикатор рисует уровни Фибоначчи с выделенными Ценовыми метками.При установке индикатора на график необходимо создать трендовую линию с именем указанным в поле" Unique name of trend line to place fib on ". По умолчанию имя=" Unique name of trend line to place fib on"  =     "+"    .В индикаторе можно заменить уровни фибоначчи по своему усмотрению.Также меняются цвет,стиль,толщина линий и т. д.
FREE
Introduction In the fast-paced world of financial market trading, success often hinges on the ability to spot and leverage trends. Among the various strategies available, momentum trading stands out as a powerful tool for traders seeking to capitalize on market movements. In this article, we will delve into the concept of momentum, its significance in trading, and the numerous benefits it offers to traders. What is Momentum? Momentum in trading refers to the tendency of assets to continue moving
이 제품의 구매자들이 또한 구매함
Genesis Matrix Pro is a professional multi-timeframe trend detection indicator designed to help traders identify high-quality market alignment with clarity and structure. It combines 12 different technical indicators into one visual alignment matrix, allowing traders to quickly see when market conditions are bullish, bearish, or neutral. A signal is generated only when the selected strategies are aligned, helping reduce noise and improve decision-making. PLEASE CONTACT ME AFTER PURCHASE TO GET
The Propfolio Master Suite is the ultimate all-in-one analytical workstation for professional traders. Combining the power of the Beat The Market Maker (BTMM) methodology, Smart Money Concepts (SND/Liquidity), and Advanced Volume Profile, this suite replaces multiple different indicators with one optimized engine. Monitor up to 14 pairs simultaneously from a single chart, instantly identify market cycles, and seamlessly map institutional footprints with the click of a button. The Command Center
Scalper Inside PRO
Alexey Minkov
4.74 (69)
Scalper Inside PRO Scalper Inside PRO is an intraday trend and scalping indicator for MetaTrader 4 that uses an exclusive algorithm to quickly detect market direction and key target levels. It automatically calculates entry, exit and multiple profit targets, and shows detailed performance statistics so you can see how different instruments and strategies performed. This helps you choose the most suitable trading instruments for the current market conditions. Additionally, you can easily integrat
PRO Renko System
Oleg Rodin
5 (30)
PRO Renko System 은 RENKO 차트 거래를 위해 특별히 고안된 매우 정확한 거래 시스템입니다. 이것은 다양한 거래 상품에 적용될 수있는 보편적 인 시스템입니다. 체계는 효과적으로 당신에게 정확한 반전 신호에 접근을 주는 소위 시장 소음을 중화합니다. 이 표시기는 사용하기가 매우 쉽고 신호 생성을 담당하는 매개 변수가 하나만 있습니다. 당신은 쉽게 당신의 선택의 어떤 무역 계기에 공구를 적응시킬 수 있고 renko 막대기의 크기. 나는 항상 당신이 내 소프트웨어로 수익성있게 거래 할 수 있도록 추가 지원을 제공 할 준비가되어 있습니다! 나는 당신에게 행복하고 수익성있는 거래를 기원합니다! 구매 후 저에게 연락하십시오! 내 렌코 차트 생성기를 보내드립니다. 또한 내 개인 권장 사항 및 시스템의 다른 모듈을 무료로 공유 할 것입니다!
NAM Order Blocks
NAM TECH GROUP, CORP.
3.67 (3)
MT4 Multi-timeframe Order Blocks detection indicator. Features - Fully customizable on chart control panel, provides complete interaction. - Hide and show control panel wherever you want. - Detect OBs on multiple timeframes. - Select OBs quantity to display. - Different OBs user interface. - Different filters on OBs. - OB proximity alert. - ADR High and Low lines. - Notification service (Screen alerts | Push notifications). Summary Order block is a market behavior that indicates order collection
Quants HL Break
Ferhat Mutlu
5 (2)
LH 및 HL 브레이크아웃을 찾기 위한 순수 가격 조치에 의한 고급 계산. 그것은 당신에게 시장에서 큰 반전 포인트를 줄 것입니다.LH 및 HL 신호는 traingle 브레이크 아웃에도 사용할 수 있습니다. 브레이크 아웃이 발생하면 강한 반전을 나타냅니다. 이동 평균에 대한 좋은 필터입니다. 추세 지표와 함께 사용하는 것이 좋습니다. 지원 및 저항, 공급 수요 지표에 대한 추가 확인으로 사용할 수 있습니다. 자세한 내용은 다음 외환 스레드에서 찾을 수 있습니다. 표시기가 다시 칠해지지 않습니다. Buffers :   SetIndexBuffer ( 0 ,UpBar);      SetIndexBuffer ( 1 ,UpBar2);           SetIndexBuffer ( 2 ,DnBar);      SetIndexBuffer ( 3 ,DnBar2);           SetIndexBuffer ( 4 ,UpBarTop);      SetIndexBuffer ( 5 ,UpBa
Dynamic Forex28 Navigator
Bernhard Schweigert
4.43 (7)
Dynamic Forex28 Navigator - 차세대 외환 거래 도구. 현재 49% 할인. Dynamic Forex28 Navigator는 오랫동안 인기 있는 지표의 진화형으로, 세 가지의 힘을 하나로 결합했습니다. 고급 통화 Strength28 지표(695개 리뷰) + 고급 통화 IMPULSE with ALERT(520개 리뷰) + CS28 콤보 신호(보너스). 지표에 대한 자세한 정보 https://www.mql5.com/en/blogs/post/758844 차세대 Strength 지표는 무엇을 제공합니까?  원래 지표에서 좋아했던 모든 것이 새로운 기능과 더 높은 정확도로 강화되었습니다. 주요 기능: 독점적인 통화 Strength 공식.  모든 시간대에 걸쳐 부드럽고 정확한 강도선. 추세와 정확한 진입을 식별하는 데 이상적입니다. 역동적인 시장 피보나치 수준(시장 피보나치).  이 지표에만 있는 고유한 기능. 가격 차트가 아닌 통화 강도에 피보나치가 적용됩니다.
PZ Harmonacci Patterns
PZ TRADING SLU
3.17 (6)
Trade smarter, not harder: Empower your trading with Harmonacci Patterns This is arguably the most complete harmonic price formation auto-recognition indicator you can find for the MetaTrader Platform. It detects 19 different patterns, takes fibonacci projections as seriously as you do, displays the Potential Reversal Zone (PRZ) and finds suitable stop-loss and take-profit levels. [ Installation Guide | Update Guide | Troubleshooting | FAQ | All Products  ] It detects 19 different harmonic pric
RFI levels PRO
Roman Podpora
5 (1)
이 지표는 추세 반전 지점과 가격 반등 영역을 정확하게 보여줍니다.       주요 투자자들   . 새로운 트렌드가 형성되는 곳을 파악하고 최대한 정확하게 의사결정을 내리며 모든 거래를 완벽하게 통제합니다. TREND LINES PRO   지표와 함께 사용할 때 최대의 잠재력을 발휘합니다.  VERSION MT5 지표가 보여주는 내용: 새로운 추세의 시작 시 활성화되는 반전 구조 및 반전 수준. 최소한의 위험 대비 수익률을 갖는 이익 실현   (TAKE PROFIT)   및   손절매(STOP LOSS)   레벨 표시       RR 1:2   . 지능형 손실 감소 로직이 적용된 손절매 기능. 지정된 지표에서 두 가지 추세 유형에 대한 반전 패턴을 표시합니다. 지표: 트렌드를 따라   트렌드 라인 프로   (글로벌 트렌드 변화) 트렌드 프로   (빠른 트렌드 변화) 간단하고 효과적입니다       스캐너       실시간 추세 (신규). 다중 시간 프레임 도구 필터링. 표시하다  
Trend Catcher ind
Ramil Minniakhmetov
트렌드 캐처 인디케이터 트렌드 캐처 인디케이터는 개발자가 자체 개발한 맞춤형 적응형 트렌드 분석 지표들을 조합하여 시장 가격 움직임을 분석합니다. 단기적인 노이즈를 제거하고 근본적인 모멘텀 강도, 변동성 확대, 가격 구조 움직임에 집중하여 진정한 시장 방향을 파악합니다. 또한 이동 평균, RSI, 변동성 필터와 같은 맞춤형 지표들을 활용하여 가격을 평활화하고 트렌드를 필터링합니다. 실제 운영 모니터링 및 기타 제품은 다음 링크에서 확인하실 수 있습니다: https://www.mql5.com/en/users/mechanic/seller 텔레그램에서는 EA나 설정 파일을 판매하지 않습니다. 사기이니 주의하세요. 모든 설정 파일은 블로그에서 무료로 제공됩니다. 중요! 구매 후 즉시 연락 주시면 사용 방법 및 보너스를 드립니다!
Grabber System
Ihor Otkydach
5 (2)
탁월한 기술적 지표인 Grabber를 소개합니다. 이 도구는 즉시 사용 가능한 “올인원(All-Inclusive)” 트레이딩 전략으로 작동합니다. 하나의 코드 안에 강력한 시장 기술 분석 도구, 매매 신호(화살표), 알림 기능, 푸시 알림이 통합되어 있습니다. 이 인디케이터를 구매하신 모든 분들께는 다음의 항목이   무료로   제공됩니다: Grabber 유틸리티: 오픈 포지션을 자동으로 관리하는 도구 단계별 영상 매뉴얼: 설치, 설정, 그리고 실제 거래 방법을 안내 맞춤형 세트 파일: 인디케이터를 빠르게 자동 설정하여 최고의 성과를 낼 수 있도록 도와줍니다 다른 전략은 이제 잊어버리세요! Grabber만이 여러분을 새로운 트레이딩의 정점으로 이끌어 줄 수 있습니다. Grabber 전략의 주요 특징: 거래 시간 프레임: M5부터 H4까지 거래 가능한 자산: 어떤 자산이든 사용 가능하지만, 제가 직접 테스트한 종목들을 추천드립니다 (GBPUSD, GBPCAD, GBPCHF, AUDCAD
GoldRush Trend Arrow Signal
Kirk Lee Holloway
5 (2)
GoldRush 트렌드 화살표 신호 GoldRush 트렌드 화살표 신호 지표는 XAU/USD 시장에서 고속 단기 스캘핑 트레이더를 위해 설계된 정밀한 실시간 트렌드 분석을 제공합니다. 1분 시간대에 특화되어 설계된 이 도구는 명확한 진입점을 표시하는 방향성 화살표를 제공하여 스캘퍼들이 변동성이 높은 시장 환경에서도 자신 있게 거래할 수 있도록 합니다. 이 지표는 PRIMARY 및 SECONDARY 경고 화살표로 구성됩니다. PRIMARY 신호는 추세 방향의 변화를 나타내는 흰색과 검은색 방향성 화살표이며, SECONDARY 신호는 PRIMARY 화살표가 지시하는 방향을 확인하고 잠재적인 거래 진입점을 표시하는 파란색과 빨간색 화살표입니다. 참고: 추세 방향이 변경된 후 PRIMARY 경고 화살표가 단 하나만 표시될 경우, 다수의 SECONDARY 파란색/빨간색 화살표가 표시될 수 있음을 유의해야 합니다. SECONDARY 신호는 신호 기준을 충족하는 어떤 캔들 이후에도 표시
Introduction to Fractal Pattern Scanner Fractal Indicator refers to the technical indicator that makes use of the fractal geometry found in the financial market. Fractal Pattern Scanner is the advanced Fractal Indicator that brings the latest trading technology after the extensive research and development work in the fractal geometry in the financial market. The most important feature in Fractal Pattern Scanner is the ability to measure the turning point probability as well as the trend probabi
Advanced Currency Strength28 Indicator
Bernhard Schweigert
4.91 (657)
현재 40% 할인 초보자 또는 전문가 트레이더를 위한 최고의 솔루션! 이 지표는 우리가 독점 기능과 새로운 공식을 통합했기 때문에 독특하고 고품질이며 저렴한 거래 도구입니다. 단 하나의 차트로 28 Forex 쌍의 통화 강도를 읽을 수 있습니다! 새로운 추세 또는 스캘핑 기회의 정확한 트리거 포인트를 정확히 찾아낼 수 있기 때문에 거래가 어떻게 개선될지 상상해 보십시오. 사용 설명서: 여기를 클릭  https://www.mql5.com/en/blogs/post/697384 그것이 첫 번째, 원본입니다! 쓸모없는 지망생 클론을 사지 마십시오. 더 스페셜  강력한 통화 모멘텀을 보여주는 하위 창의 화살표 GAP가 거래를 안내합니다! 기본 또는 호가 통화가 과매도/과매도 영역(외부 시장 피보나치 수준)에 있을 때 개별 차트의 기본 창에 경고 표시가 나타납니다. 통화 강도가 외부 범위에서 떨어질 때 풀백/반전 경고. 교차 패턴의 특별 경고 추세를 빠르게 볼 수 있는 다중 시간
Advanced Supply Demand
Bernhard Schweigert
4.91 (300)
현재 40% 할인! 초보자나 전문 트레이더를 위한 최고의 솔루션! 이 보조지표는 우리가 다수의 독창적 기능과 새로운 공식을 통합한 독특하고 고품질이며 저렴한 거래 도구입니다. 이 업데이트를 통해 이중 시간대를 표시할 수 있습니다. 더 높은 TF를 표시할 수 있을 뿐만 아니라 차트 TF와 더 높은 TF 모두를 표시할 수 있습니다: 중첩 영역 표시. 모든 Supply Demand 트레이더들이 좋아할 것입니다. :) 중요한 정보 공개 Advanced Supply Demand의 잠재력을 극대화하려면 다음을 방문하십시오. https://www.mql5.com/ko/blogs/post/720245   진입 또는 목표의 명확한 트리거 포인트를 정확히 찾아냄으로 해서 거래가 어떻게 개선될지 상상해 보십시오. 새로운 알고리즘을 기반으로 매수자와 매도자 간의 잠재적인 불균형을 훨씬 더 쉽게 분간할 수 있습니다. 왜냐하면 가장 강한 공급영역과 가장 강한 수요 영역과 과거에 어떻게 진행 되었는지를(이전
Market Structure Patterns MT4
Samuel Manoel De Souza
5 (18)
Market Structure Patterns   is an indicator based on   smart money concepts   that displays   SMC/ICT   elements that can take your trading decisions to the next level. Take advantage of the   alerts ,   push notifications   and   email messages   to keep informed from when an element is formed on the chart, the price crosses a level and/or enters in a box/zone. Developers can access the values of the elements of the indicator using the   global variables  what allows the automation of trading d
Advanced UT BOT ALERTS for MT4 전문가용 다중 필터 추세 탐지 시스템|강화된 UT BOT 엔진 우리는 고품질 지표만 제공합니다. Advanced UT BOT 은 전문가용으로 설계되었으며, 안정적인 신호 로직과 안전한 계산 구조로 지연이나 잘못된 갱신을 방지합니다. 과거 신호를 다시 그리거나, 수정하거나, 삭제하지 않습니다. 모든 BUY / SELL 신호는 캔들이 마감된 후에만 생성되어 고정됩니다. 실시간 거래 중에는 리페인트가 없으며 , 캔들이 닫히는 즉시 신호가 표시됩니다. 한정 기간 할인 중 — 다음 가격은 49달러로 인상됩니다. 가격 인상 전에 지금 바로 확보하세요. 제품 개요 Advanced UT BOT ALERTS   는   UT BOT 의 핵심 로직을 기반으로 완전히 재설계된 차세대 추세 신호 시스템입니다. MT5 환경에 맞게 최적화되었으며, 다중 필터 구조, 실시간 시각화, 정밀 알림 시스템을 통합했습니다. UT Bot 지표는 원래   Yo
구매 후 저에게 연락하여 이 지표를 기반으로 한 보너스 EA를 받으십시오. Self Optimizing Double MA Strategy는 파라미터 추측을 없애기 위해 설계된 전문가 수준의 트레이딩 도구입니다. 내장된 자동 최적화 엔진으로 구동되며, 통계적 우위를 유지하기 위해 백그라운드에서 수천 개의 파라미터 조합을 시뮬레이션하여 변화하는 시장 조건에 지속적으로 적응합니다. 정적이고 구식인 설정에 의존하는 대신, 이 인디케이터는 자체 로직을 동적으로 업데이트하여 현재 시간대와 종목에 가장 수익성 있는 구성을 찾습니다. 주요 기능 내장된 자동 최적화: 시스템은 단기 MA, 장기 MA 및 RSI 기간을 주기적으로 다시 계산하여, 선택한 업데이트 빈도에 따라 설정이 항상 현재 시장 리듬과 일치하도록 보장합니다. MA 다이버전스 필터: 이동평균선이 활발하게 발산(확장)할 때만 시그널을 검증하는 핵심 추세 강도 지표입니다. 이는 평균선이 수렴하거나 평탄한 횡보장에서는 잘못된 진입을 방지합
외환 거래를 한다면, 통화 강도와 통화쌍 상관관계에 대한 상세한 정보를 아는 것은 거래 실력을 한 단계 끌어올리는 데 큰 도움이 됩니다. 상관관계를 분석하면 리스크를 절반으로 줄일 수 있고, 강도 분석을 통해 수익을 극대화할 수 있습니다. 이 지표는 통화 강도 분석과 통화쌍 상관관계를 결합하여 가장 적합한 통화쌍을 선택할 수 있도록 도와주는 하이브리드 접근 방식을 제공합니다. 통화 강도 분석 활용 방법 예를 들어, 당신의 거래 전략이 AUD/JPY 매수 기회를 제공한다고 가정해 봅시다. 하지만 KT 통화 강도 분석을 통해 JPY가 AUD보다 강해지고 있다는 것을 발견했다면, 이 거래는 손실로 끝날 가능성이 높습니다. 이 지표를 사용하면 이러한 손실을 쉽게 피할 수 있습니다. 통화쌍 상관관계 활용 방법 또 다른 예로, 거래 전략이 NZD/USD와 GBP/JPY 두 통화쌍 모두에 대해 매도 기회를 제공한다고 가정해 봅시다. KT 통화쌍 상관관계 분석을 사용하면 이 두 통화쌍 간 상관
KURAMA GOLD SIGNAL PRO (MT4) — 7층 필터, 자동 TP/SL, 품질 점수를 탑재한 XAUUSD 완벽 트레이딩 시스템 리페인트 없음. 리드로우 없음. 지연 없음. 모든 신호는 영구적입니다. 보이는 것이 그대로입니다. 보너스: 영구 라이선스 구매자에게 AI Zone Radar ($59 상당) + 전체 PDF 매뉴얼을 무료 제공. 구매 후 메시지를 보내주세요. AI Zone Radar: https://www.mql5.com/en/market/product/175834 트레이더의 신뢰: 활발한 골드 트레이더 커뮤니티에서 이미 사용 중. 정확도와 사용 편의성으로 호평을 받고 있습니다. 당신의 문제 — 그리고 해결책 골드가 하루 $30-50 움직인다는 걸 알고 있죠. 여기서 돈을 벌 수 있다는 것도. 하지만: - 너무 일찍 진입해서 가격이 당신 방향으로 가기 전에 $10 손절당함 - MA 터치마다 진입하지만 절반은 실패 - TP/SL 시스템이 없어서 너무
Dynamic Scalper System
Vitalyi Belyh
5 (1)
" Dynamic Scalper System " 지표는 추세 파동 내에서 스캘핑 방식으로 거래하도록 설계되었습니다. 주요 통화쌍 및 금에서 테스트되었으며, 다른 거래 상품과의 호환성이 가능합니다. 추가적인 가격 변동 지원을 통해 추세에 따라 단기 포지션 진입 신호를 제공합니다. 지표의 원리 큰 화살표는 추세 방향을 결정합니다. 작은 화살표 형태의 스캘핑 신호를 생성하는 알고리즘은 추세 파동 내에서 작동합니다. 빨간색 화살표는 상승 방향을, 파란색 화살표는 하락 방향을 나타냅니다. 민감한 가격 변동선은 추세 방향으로 그려지며, 작은 화살표의 신호와 함께 작용합니다. 신호는 다음과 같이 작동합니다. 적절한 시점에 선이 나타나면 진입 신호가 형성되고, 선이 있는 동안 미결제 포지션을 유지하며, 완료되면 거래를 종료합니다. 권장되는 작업 시간대는 M1~H4입니다. 화살표는 현재 캔들에 형성되며, 다음 캔들이 이미 시작되었더라도 이전 캔들의 화살표는 다시 그려지지 않습니다. 입력 매개
Master head and shoulders patterns for better trading decisions A head and shoulders pattern is a chart formation that resembles a baseline with three peaks, the outside two are close in height and the middle is highest. It predicts a bullish-to-bearish trend reversal and is believed to be one of the most reliable trend reversal patterns. It is one of several top patterns that signal, with varying degrees of accuracy, that a trend is nearing its end. [ Installation Guide | Update Guide | Trouble
PZ Double Top Bottom
PZ TRADING SLU
5 (1)
Trade double tops and bottoms effectively The PZ Double Top/Bottom Indicator is a technical analysis tool that helps traders identify potential price reversal patterns in the market. These patterns, known as double tops and bottoms, are characterized by two consecutive peaks or valleys in the price of an asset. Double tops and bottoms are often seen as potential reversal patterns because they can signal a change in the direction of the current trend. [ Installation Guide | Update Guide | Troubl
Cyclic Impulse
Vitalyi Belyh
차트를 구조화하고 주기적인 가격 변동을 식별하는 기술 지표입니다. 모든 차트에서 작업할 수 있습니다. 다양한 유형의 알림. 그래프 자체에도 추가 화살표가 있습니다. 역사를 재구성하지 않고, 촛불을 닫는 작업에 임한다. M5 이상에서 권장되는 TF입니다. 사용 및 구성이 쉬운 매개변수입니다. 매개변수가 다른 2개의 지표를 사용하는 경우, 다른 지표 없이 해당 지표만 사용할 수 있습니다. 2개의 입력 매개변수가 있습니다 주기성과 신호 지속 시간 이 2개의 매개변수는 차트 구조의 처리와 관련이 있습니다. Cyclicity - 역전 주기가 얼마나 자주 바뀌는지 조절하고 주기를 매끄럽게 합니다. Signal duration - 최소 숫자에서는 가격 움직임의 충격을 감지하고, 최대 숫자에서는 장기적 추세 움직임을 감지합니다.. --------------------------------
KuKl
IGOR KIRIANEN
The indicator is built on a non-standard Zig Zag, it draws accumulations after which if the price leaves this zone and a test of this zone occurs, then a sound signal is given and an arrow appears - after the test candle closes.The indicator does not redraw its signals, it is very easy to use, there are only three settings 1- this is the zig zag parameter 2- this is the minimum price exit from the zone 3- this is the maximum price exit from the zone. The lower the parameter for Zig Zag, the more
이 지표를 구매하면 제 프로페셔널 트레이드 매니저를 무료로 드립니다. 우선 이 거래 시스템이 리페인팅, 리드로잉 및 레이그 인디케이터가 아니라는 점을 강조하는 것이 중요합니다. 이는 수동 및 로봇 거래 모두에 이상적인 것으로 만듭니다. 온라인 강좌, 설명서 및 프리셋 다운로드. "스마트 트렌드 트레이딩 시스템 MT5"은 새로운 및 경험이 풍부한 트레이더를 위해 맞춤형으로 제작된 종합적인 거래 솔루션입니다. 10개 이상의 프리미엄 인디케이터를 결합하고 7개 이상의 견고한 거래 전략을 특징으로 하여 다양한 시장 조건에 대한 다목적 선택이 가능합니다. 트렌드 추종 전략: 효과적인 트렌드 추이를 타기 위한 정확한 진입 및 손절 관리를 제공합니다. 반전 전략: 잠재적인 트렌드 반전을 식별하여 트레이더가 범위 시장을 활용할 수 있게 합니다. 스캘핑 전략: 빠르고 정확한 데이 트레이딩 및 단기 거래를 위해 설계되었습니다. 안정성: 모든 인디케이터가 리페인팅, 리드로잉 및 레이그가 아니므로 신뢰
The Super Arrow Indicator provides non-repainting buy and sell signals with exceptional accuracy. Key Features No repainting – confirmed signals remain fixed Clear visual arrows: green for buy, red for sell Real-time alerts via pop-up, sound, and optional email Clean chart view with no unnecessary clutter Works on all markets: Forex, gold, oil, indices, crypto Adjustable Parameters TimeFrame Default: "current time frame" Function: Sets the time frame for indicator calculation Options: Can be set
Advanced Currency IMPULSE with ALERT
Bernhard Schweigert
4.9 (490)
현재 40% 할인!! 초보자 또는 전문가 트레이더를 위한 최고의 솔루션! 이 지표는 우리가 독점 기능과 비밀 공식을 통합했기 때문에 독특하고 고품질이며 저렴한 거래 도구입니다. 단 하나의 차트로 28개 통화 쌍 모두에 대한 경고를 제공합니다. 새로운 추세 또는 스캘핑 기회의 정확한 트리거 포인트를 정확히 찾아낼 수 있기 때문에 거래가 어떻게 개선될지 상상해 보십시오! 새로운 기본 알고리즘을 기반으로 구축되어 잠재적인 거래를 훨씬 더 쉽게 식별하고 확인할 수 있습니다. 이는 통화의 강세 또는 약세가 가속되는지 여부를 그래픽으로 표시하고 가속 속도를 측정하기 때문입니다. 자동차의 속도계처럼 생각하면 됩니다. 가속화할 때 Forex 시장에서 동일한 일이 분명히 더 빠르게 발생합니다. 즉, 반대 방향으로 가속화되는 통화를 페어링하면 잠재적으로 수익성 있는 거래를 식별한 것입니다. 통화 모멘텀의 수직선과 화살표가 거래를 안내합니다! 역동적인 Market Fibonacci 23 레벨은
Atomic Analyst
Issam Kassas
5 (6)
우선적으로 언급할 점은이 거래 지표가 다시 그리지 않고 지연되지 않으며 이를 통해 수동 및 로봇 거래 모두에 이상적이라는 점입니다. 사용자 매뉴얼: 설정, 입력 및 전략. Atomic Analyst는 가격의 강도와 모멘텀을 활용하여 시장에서 더 나은 이점을 찾는 PA Price Action Indicator입니다. 고급 필터를 장착하여 잡음과 거짓 신호를 제거하고 거래 잠재력을 높이는 데 도움이 됩니다. 복잡한 지표의 다중 레이어를 사용하여 Atomic Analyst는 차트를 스캔하고 복잡한 수학적 계산을 간단한 신호와 색상으로 변환하여 초보 트레이더가 이해하고 일관된 거래 결정을 내릴 수 있도록합니다. "Atomic Analyst"는 새로운 및 경험이 풍부한 트레이더를위한 종합적인 거래 솔루션입니다. 프리미엄 지표와 최고 수준의 기능을 하나의 거래 전략에 결합하여 모든 종류의 트레이더에 대한 다재다능한 선택지가되었습니다. 인트라데이 거래 및 스캘핑 전략 : 빠르고 정확한 일일
NAM Divergences
NAM TECH GROUP, CORP.
5 (1)
MT4 Multi-timeframe Divergence and Overbougt/Oversold detection indicator. Features - Fully customizable on chart control panel, provides complete interaction. - Hide and show control panel wherever you want. - Real time information about non-capitalized divergences. - Real time information about overbougt / oversold situations. - Real time information about regular divergences. - Real time information about hidden divergences. - Oscillators available for divergences detection: AO, RSI, CCI, MA
제작자의 제품 더 보기
Candle Color Day MT5
Alexandr Saprykin
캔들 컬러 데이 - 요일별 색상 캔들스틱 지표 이게 뭔가요? 차트에서 요일에 따라 캔들스틱 색상을 바꿔주는 간단한 시각화 도구입니다. 월요일은 한 가지 색상, 화요일은 다른 색상 등으로 표시됩니다. 특정 요일에 가격이 특정 방식으로 움직이는 경우가 얼마나 자주 있는지 궁금했던 적이 있으신가요? 이 지표는 그러한 패턴을 파악하는 데 도움을 줍니다. 누구를 위한 도구인가요? 다음과 같은 트레이더에게 적합합니다. 과거 데이터를 사용하여 요일을 빠르게 파악하고 싶은 트레이더 가격 움직임에서 계절적 패턴을 찾고 싶은 트레이더 차트에서 추가적인 시각적 참고 자료가 필요한 트레이더 특정 요일이 거래에 미치는 영향을 분석하고 싶은 트레이더 어떻게 작동하나요? 이 지표는 기존 캔들스틱 위에 색상이 있는 선을 그려주며, 아래에는 원래의 일본식 캔들스틱이 그대로 유지됩니다. 각 요일에는 서로 다른 색상이 지정됩니다. 기본 설정: 월요일 - 빨간색 화요일 - 녹색 수요일 - 파란
FREE
이 유틸리티는 차트에 경제 뉴스를 직접 표시합니다. 예정된 이벤트, 발표까지 남은 시간, 중요도를 보여주고 알림을 전송합니다. 대상: 경제 뉴스를 주시하는 트레이더 뉴스에 기반한 거래를 하는 트레이더 적시에 알림을 받고 싶은 트레이더 차트에서 간편하고 직관적인 캘린더를 필요로 하는 사용자 주요 기능 뉴스 패널 - 차트에 가장 가까운 경제 이벤트를 표시합니다. 통화 필터 - 거래하는 통화에 대한 뉴스만 표시합니다. 알림 - 뉴스 발표 전 선택한 시간에 알림을 보냅니다. 푸시 알림 - MetaTrader 모바일 기기로 알림을 보냅니다. 소리 알림 - 사용자 지정 가능한 소리 알림 색상 표시기 - 중요도 및 긴급도를 시각적으로 표시합니다. 설정 알림 시간(분) - 이벤트 발생 몇 분 전에 알림을 보낼지 설정합니다. 최소 중요도 - 알림을 보내기 위한 최소 뉴스 중요도 통화별 필터 - 현재 거래 중인 종목의 통화로 뉴스를 필터링합니다. 소리 알림 활성화 - 소리
FREE
Account Info AS는 MetaTrader 5용 강력한 정보 스크립트로, 거래 계좌에 대한 모든 정보를 차트에 직접 표시해 줍니다. 이 스크립트는 계좌 분석, 위험 관리 및 거래 의사 결정에 필요한 모든 데이터를 제공합니다. 주요 기능 완전한 재무 정보 계좌 유형 (데모/실계좌/경연 대회) 잔액, 자산 및 마진 현금 및 비율로 표시되는 사용 가능 마진 마진 레벨 현재 손익 위험 관리 마진콜 및 손절매 레벨 현재 심볼 1랏에 대한 마진 계산 인기 거래 상품 마진 거래 정보 미체결 포지션 (수량, 방향, 총 수익) 유형별 대기 주문 현재 심볼 정보: 랏 크기 (최소/최대/단계) 핍 단위 스프레드 스왑 크기 기술 데이터 현재 서버 시간 회사 및 서버 이름 계좌 번호 및 고객 정보 설정 스크립트는 세 가지 간단한 매개변수를 사용합니다. Line_spacing - 가독성 향상을 위해 데이터 사이에 빈 줄 추가 ShowAllSymbolsInfo -
FREE
Account Info AS는 MetaTrader 4용 강력한 정보 스크립트로, 거래 계좌에 대한 모든 정보를 차트에 직접 표시해 줍니다. 이 스크립트는 계좌 분석, 위험 관리 및 거래 의사 결정에 필요한 모든 데이터를 제공합니다. 주요 기능 완전한 재무 정보 계좌 유형 (데모/실계좌/경연 대회) 잔액, 자산 및 마진 현금 및 비율로 표시되는 사용 가능 마진 마진 레벨 현재 손익 위험 관리 마진콜 및 손절매 레벨 현재 심볼 1랏에 대한 마진 계산 인기 거래 상품 마진 거래 정보 미체결 포지션 (수량, 방향, 총 수익) 유형별 대기 주문 현재 심볼 정보: 랏 크기 (최소/최대/단계) 핍 단위 스프레드 스왑 크기 기술 데이터 현재 서버 시간 회사 및 서버 이름 계좌 번호 및 고객 정보 설정 스크립트는 세 가지 간단한 매개변수를 사용합니다. Line_spacing - 가독성 향상을 위해 데이터 사이에 빈 줄 추가 ShowAllSymbolsInfo -
FREE
Candle Color Day MT4
Alexandr Saprykin
캔들 컬러 데이 - 요일별 색상 캔들스틱 지표 이게 뭔가요? 차트에서 요일에 따라 캔들스틱 색상을 바꿔주는 간단한 시각화 도구입니다. 월요일은 한 가지 색상, 화요일은 다른 색상 등으로 표시됩니다. 특정 요일에 가격이 특정 방식으로 움직이는 경우가 얼마나 자주 있는지 궁금했던 적이 있으신가요? 이 지표는 그러한 패턴을 파악하는 데 도움을 줍니다. 누구를 위한 도구인가요? 다음과 같은 트레이더에게 적합합니다. 과거 데이터를 사용하여 요일을 빠르게 파악하고 싶은 트레이더 가격 움직임에서 계절적 패턴을 찾고 싶은 트레이더 차트에서 추가적인 시각적 참고 자료가 필요한 트레이더 특정 요일이 거래에 미치는 영향을 분석하고 싶은 트레이더 어떻게 작동하나요? 이 지표는 기존 캔들스틱 위에 색상이 있는 선을 그려주며, 아래에는 원래의 일본식 캔들스틱이 그대로 유지됩니다. 각 요일에는 서로 다른 색상이 지정됩니다. 기본 설정: 월요일 - 빨간색 화요일 - 녹색 수요일 - 파란
FREE
버전 4.4 단기적인 시간대에서 유연한 확인 시스템을 갖춘 Engulfing Pattern 감지를 위한 전문 지표입니다. 주요 기능: 유연한 시간대 설정 확정을 위한 하위 시간대를 완벽하게 사용자 정의 가능 M1-M5-M15, M5-M15-H1, M15-H1-H4 등 모든 조합 사용 가능 모든 거래 스타일 및 전략에 적합 3단계 신호 확인 약한 확정(사용자 정의 가능 시간대) - 노란색 화살표 중간 확정(사용자 정의 가능 시간대) - 파란색 화살표 강한 확정(사용자 정의 가능 시간대) - 녹색/빨간색 화살표 재설정 없이 안정적인 작동 화살표는 한 번 그려지며 사라지지 않습니다. 확정에는 마감된 캔들만 사용됩니다. 허위 트리거 방지 모든 거래 스타일에 적용 가능 스캘퍼: M1-M2-M5 데이 트레이더: M5-M15-H1 스윙 트레이더: M15-H1-H4 장기 투자자: H1-H4-D1 스마트 알림 시스템 현재 차트에서 관련 신호에 대해서만 알림이 전
Trande Candle MT4
Alexandr Saprykin
트렌드 캔들 - 즉각적인 추세 파악 지표 트렌드 캔들 지표는 차트의 캔들에 자동으로 색상을 입혀 복잡한 분석을 시각적으로 이해하기 쉬운 그림으로 바꿔줍니다. 상승 추세는 녹색, 하락 추세는 빨간색, 횡보는 회색으로 표시되어 시장의 강도와 방향을 즉시 파악할 수 있습니다. 이 도구는 두 개의 적응형 필터가 동기화되어 불필요한 노이즈 없이 명확한 신호를 제공합니다. 주요 이점 즉각적인 추세 시각화: 시장 방향을 한눈에 파악합니다. 재도색되지 않는 알고리즘: 신호는 캔들 종가에 고정되어 향후 변경되지 않으므로 과거 데이터에 대한 정확한 분석과 안정적인 거래를 보장합니다. 이중 신호 필터링: 빠른 필터와 느린 필터가 함께 작동하여 잘못된 움직임을 걸러내고 고품질 추세 조건을 강조합니다. 다양한 알림 방식: 팝업 창, 모바일 푸시 알림, 이메일 또는 소리 알림을 통해 추세 반전 알림을 받을 수 있습니다. 다양한 활용성: 모든 금융 상품 및 시간대에 적용 가능합니다. 트렌드 캔
할인 가격은 얼리 어답터에게만 적용됩니다! 이후에는 가격이 100달러로 인상됩니다. 인걸핑 패턴 대시보드 — 하위 시간대 확인 기능이 있는 멀티 심볼 인걸핑 패턴 스캐너 제품 설명 인걸핑 패턴 대시보드는 고전적인 일본식 캔들스틱 패턴인 강세/약세 인걸핑을 기반으로 하는 강력하고 편리한 트레이딩 도구입니다. 이 지표는 최대 30개의 거래 상품을 동시에 스캔하여 실시간으로 새로운 신호를 식별하고 차트에 표 형식으로 명확하게 표시합니다. 핵심 기능은 다단계 신호 확인 시스템입니다. 약한 신호 — 하위 시간대 하나에서 확인 중간 신호 — 하위 시간대 두 개에서 확인 강한 신호 — 하위 시간대 세 개에서 동시에 확인 이를 통해 잘못된 신호를 걸러내고 진입 시점의 신뢰도를 높일 수 있습니다. 이 표시기는 완전히 자율적으로 작동합니다. 필요한 기호를 한 번만 추가하면 매초 데이터를 업데이트하고, 새로운 신호는 색상으로 표시하며, 신호 발생 후 처음 60초 동안은 깜빡이기도 합니다.
버전 4.4 다중 시간대 확인 기능을 갖춘 Engulfing Candlestick Patterns 감지 전문 지표 주요 기능: 유연한 시간대 구성 확정을 위한 하위 시간대를 완벽하게 사용자 정의 가능 M1-M5-M15, M5-M15-H1, M15-H1-H4 등 원하는 조합으로 사용 가능 모든 거래 스타일 및 전략에 적용 가능 3단계 신호 확인 약한 확인(맞춤형 TF) - 노란색 화살표 중간 확인(맞춤형 TF) - 파란색 화살표 강한 확인(맞춤형 TF) - 녹색/빨간색 화살표 재도색 없이 안정적인 작동 화살표는 한 번 그려지며 사라지지 않습니다. 확정을 위해 마감된 캔들만 사용 허위 신호 방지 모든 거래 스타일에 적용 가능 스캘퍼: M1-M2-M5 데이 트레이더: M5-M15-H1 스윙 트레이더: M15-H1-H4 장기 트레이더: H1-H4-D1 스마트 알림 시스템 현재 막대 신호에 대해서만 알림이 전송됩니다. 지표 추가 시 과거 신호에서 스팸
Smart Pivot Points
Alexandr Saprykin
MetaTrader 5용 스마트 피벗 포인트 - 스마트 트레이딩을 위한 명확한 레벨 스마트 피벗 포인트는 MetaTrader 5용 전문 지표로, 차트에 주요 트레이딩 레벨을 자동으로 계산하여 표시해 줍니다. 복잡한 가격 움직임을 명확하고 구조화된 지도로 변환하여 지지선, 저항선, 가격 균형점, 그리고 잠재적 목표가를 강조합니다. 명확성을 중시하는 트레이더를 위해 설계된 이 도구는 외환, 암호화폐(비트코인, 이더리움), 주가지수, 주식, 원자재(XAUUSD) 등 모든 시장에서 활용 가능합니다. 이 지표는 계산 시간을 절약하고 분석에 객관성을 더하는 믿음직한 분석 도우미입니다. 시장 신호를 제공하거나 트레이딩 결정을 대신해 주는 것이 아니라, 트레이더 스스로 정보에 기반한 트레이딩 결정을 내릴 수 있도록 고품질의 정보를 제공합니다. 주요 기능 및 이점 바로 사용 가능한 가격 좌표 시스템: 더 이상 레벨을 수동으로 그릴 필요가 없습니다. 중심 레벨(균형점), 지지선, 저항선, 매수
Trande Candle
Alexandr Saprykin
트렌드 캔들 - 즉각적인 추세 파악 지표 트렌드 캔들 지표는 차트의 캔들에 자동으로 색상을 입혀 복잡한 분석을 시각적으로 이해하기 쉬운 그림으로 바꿔줍니다. 상승 추세는 녹색, 하락 추세는 빨간색, 횡보는 회색으로 표시되어 시장의 강도와 방향을 즉시 파악할 수 있습니다. 이 도구는 두 개의 적응형 필터가 동기화되어 불필요한 노이즈 없이 명확한 신호를 제공합니다. 주요 이점 즉각적인 추세 시각화: 시장 방향을 한눈에 파악합니다. 재도색되지 않는 알고리즘: 신호는 캔들 종가에 고정되어 향후 변경되지 않으므로 과거 데이터에 대한 정확한 분석과 안정적인 거래를 보장합니다. 이중 신호 필터링: 빠른 필터와 느린 필터가 함께 작동하여 잘못된 움직임을 걸러내고 고품질 추세 조건을 강조합니다. 다양한 알림 방식: 팝업 창, 모바일 푸시 알림, 이메일 또는 소리 알림을 통해 추세 반전 알림을 받을 수 있습니다. 다양한 활용성: 모든 금융 상품 및 시간대에 적용 가능합니다. 트렌드 캔
필터:
리뷰 없음
리뷰 답변