Automatic OrderBlocks Osw MT4
- 지표
-
William Oswaldo Mayorga Urduy
 MQL4 and MQL5 trader and developer since February 2019, delivering projects in under one day and providing post-delivery technical support.
Optimized code, advanced logic, and high-quality code. - 버전: 1.3
- 업데이트됨: 15 1월 2023
- 활성화: 5
자동 주문 블록 OSW
(메타트레이더 5)
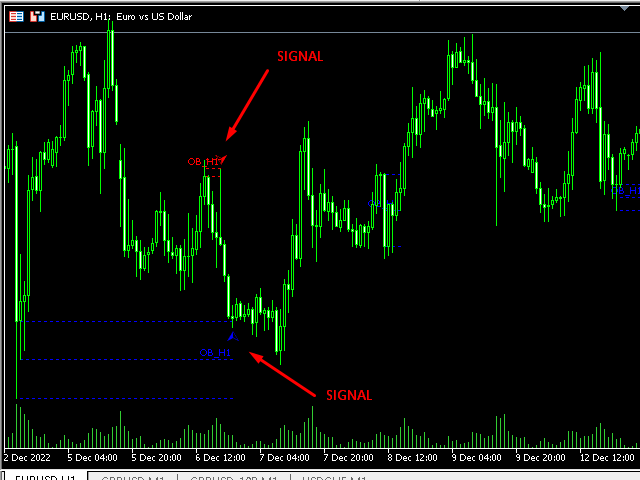
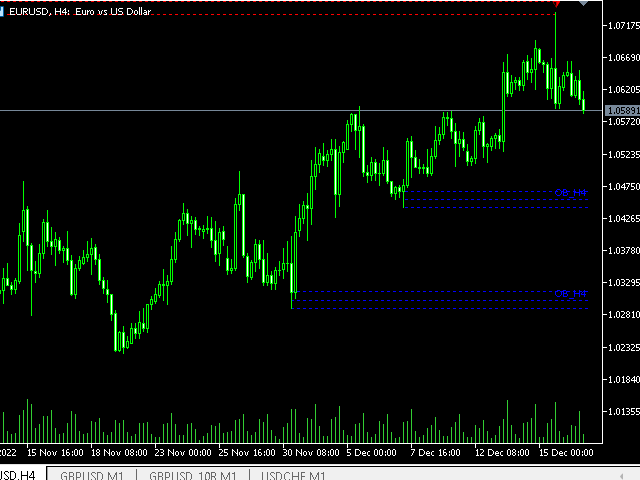
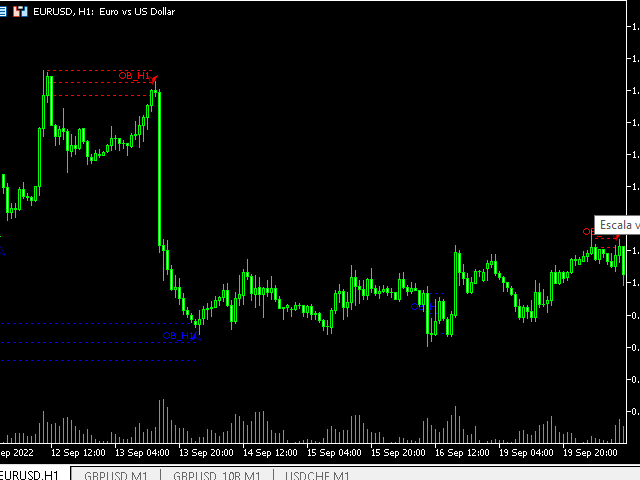
이 표시기는 다음과 같은 사전 설정된 규칙에 따라 주문 블록을 표시하는 역할을 합니다.
>이전의 충동을 깨뜨리는 충동이 있다는 것.
> 발견되면 형성된 촛대 패턴을 찾아 가장 효율적인 방법으로 장소의 고저를 계산하고 Order Block의 고저를 생성하는 역할을 합니다.
> 오더 블록이 생성된 후 인디케이터는 캔들이 오더 블록의 위아래 라인을 교차하는지 지속적으로 확인하여 가능한 신호가 있음을 나타내는 경고 신호를 생성합니다.
>지표가 제공하는 신호는 다른 전략과 같이 100% 효과적이지 않으므로 수동 기술 분석을 동반하는 것이 좋습니다.
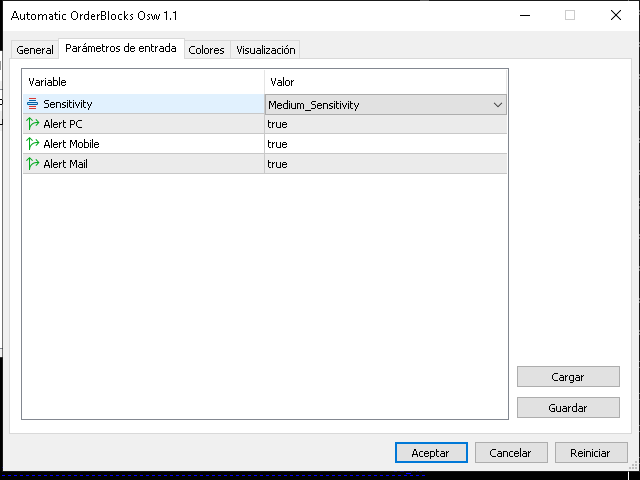
> PC, 모바일 및 이메일의 세 가지 유형의 알림이 생성됩니다.
자동 주문 블록 OSW
(메타트레이더 5)
이 표시기는 다음과 같은 사전 설정된 규칙에 따라 주문 블록을 표시하는 역할을 합니다.
>이전의 충동을 깨뜨리는 충동이 있다는 것.
> 발견되면 형성된 촛대 패턴을 찾아 가장 효율적인 방법으로 장소의 고저를 계산하고 Order Block의 고저를 생성하는 역할을 합니다.
> 오더 블록이 생성된 후 인디케이터는 캔들이 오더 블록의 위아래 라인을 교차하는지 지속적으로 확인하여 가능한 신호가 있음을 나타내는 경고 신호를 생성합니다.
>지표가 제공하는 신호는 다른 전략과 같이 100% 효과적이지 않으므로 수동 기술 분석을 동반하는 것이 좋습니다.
> PC, 모바일 및 이메일의 세 가지 유형의 알림이 생성됩니다.