Supports and Resistances and Order Blocks Osw MT5
- 지표
-
William Oswaldo Mayorga Urduy
 MQL4 and MQL5 trader and developer since February 2019, delivering projects in under one day and providing post-delivery technical support.
Optimized code, advanced logic, and high-quality code. - 버전: 1.1
- 업데이트됨: 20 7월 2023
- 활성화: 5
사용자 설명서: SRO 지능형 마킹 시스템
1. 소개
SRO 지표는 가격 움직임(Price Action) 및 SMC 트레이더를 위해 설계된 MetaTrader 5용 동적 드로잉 도구입니다. 시각적 명확성이 SRO의 가장 큰 장점입니다. 차트 전체 기록을 가로지르는 선이 생기지 않도록 미래에만 적용되는 중요한 레벨을 그릴 수 있습니다. 또한 각 객체에는 생성된 시간대가 자동으로 표시됩니다.
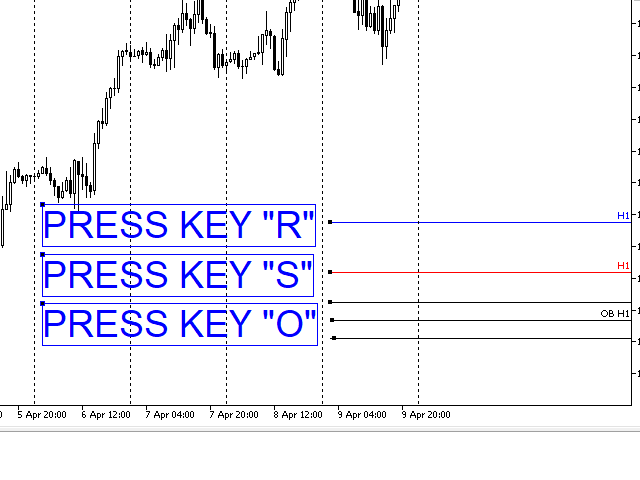
2. 빠른 실행 명령
이 시스템은 단축키를 사용하여 작동합니다. 원하는 가격 위에 마우스를 놓고 다음 단축키를 누르기만 하면 됩니다.
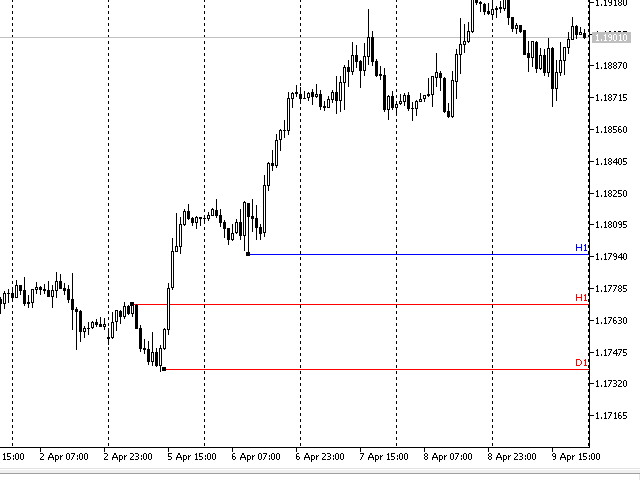
"S" 키(지지): 커서에서 오른쪽으로 수평선을 그립니다. 저점 및 수요 영역을 표시하는 데 이상적입니다.
"R" 키(저항): 수평 상단선을 그립니다. 공급 영역 및 고점을 식별하는 데 사용됩니다.
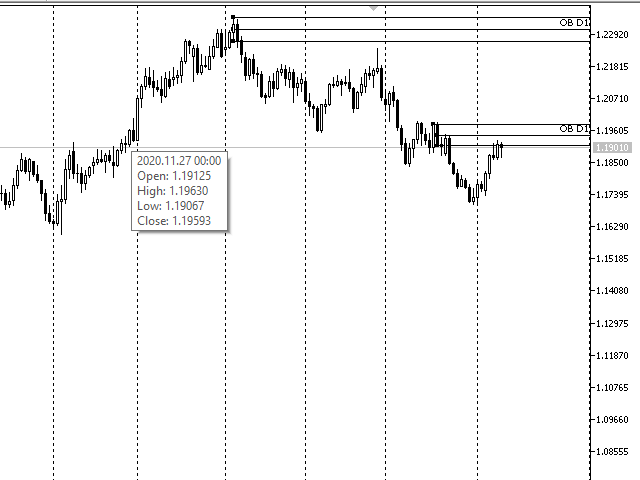
"O" 키(주문 블록): 선택한 캔들을 자동으로 프레임에 넣습니다. 고가, 저가, 그리고 손익분기점 또는 기관 투자자의 민감도가 가장 높은 영역을 나타내는 중심선(50%)을 그립니다.
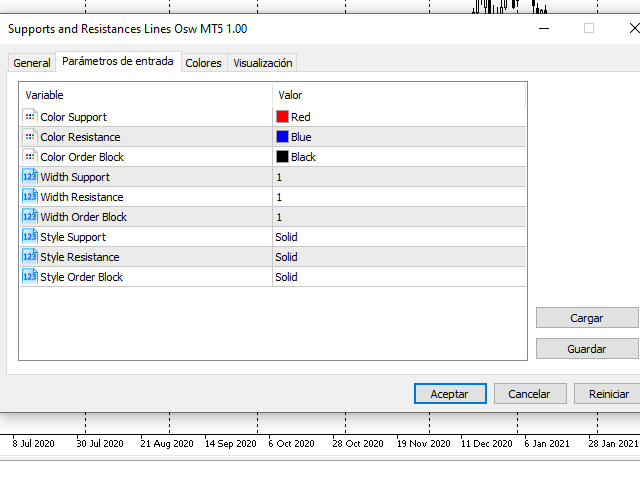
3. 매개변수 설정
입력 메뉴에서 코드를 건드리지 않고도 모양을 사용자 지정할 수 있습니다.
선(지지/저항):
색상: 영역을 시각적으로 구분합니다(예: 빨간색은 지지, 파란색은 저항).
두께: 더 높은 시간대(H4, D1)를 강조하기 위해 선 두께를 조정합니다.
스타일: 실선, 점선 또는 파선 중에서 선택합니다.
주문 블록:
색상/두께/스타일: 높은 반응 영역을 구분하는 상자를 사용자 지정합니다.
4. 거래 가이드 및 권장 사항
계층 구조: H4 또는 일봉 차트에 레벨을 표시합니다. M15로 확대하면 레이블을 통해 어떤 레벨이 가장 강한지 알 수 있습니다.
정확도: 주문 블록의 중앙선(50%)을 사용하여 지정가 주문을 설정하세요. 이 지점이 일반적으로 가장 큰 반응을 보이는 지점입니다.
컨플루언스(Confluence): 최적의 진입 시점은 상위 시간대의 지지/저항선이 하위 시간대의 주문 블록과 일치할 때입니다.
이 시스템은 전문적이고 깔끔하며 계층적인 차트를 제공하여 신속한 의사 결정을 지원합니다.