Support Resistance Dynamic
- 지표
- 버전: 1.0

The "Support Resistance Dynamic" indicator is a powerful technical analysis tool for the MetaTrader 5 platform, designed to automatically identify and plot dynamic Support and Resistance zones on price charts. This indicator helps traders easily recognize important price levels, potential reversal points, or breakout areas, thereby enabling more informed trading decisions.
2. Key Features
- Dynamic S/R Identification: Automatically identifies support and resistance zones based on an advanced Pivot Points algorithm.
- Flexible Customization: Allows users to adjust Pivot period, data source, and S/R channel width to suit various trading strategies.
- Smart S/R Filtering: Displays only the strongest and most relevant S/R levels, avoiding chart clutter.
- Intuitive Visualization: S/R lines are clearly plotted with labels showing price and percentage deviation from the current price.
- S/R Breakout Alerts: Provides instant alerts when the price breaks a significant support or resistance level.
- Breakout Confirmation: Option to add a breakout confirmation condition (e.g., number of consecutive closes) to filter out false signals.
- S/R Dashboard: A small summary panel on the chart displaying current S/R levels, their strength, and distance from the price.
3. Installation
- Download File: Download the SupportResistanceV2.mq5 indicator file.
- Open MT5 Data Folder: Open MetaTrader 5, go to the File menu -> select Open Data Folder .
- Access Indicators Folder: In the opened data folder, navigate to MQL5 -> Indicators .
- Paste Indicator File: Paste the SupportResistanceV2.mq5 file into this Indicators folder. (If you have created a symbolic link, ensure it points correctly to this file).
- Refresh MetaTrader 5: Close and reopen MetaTrader 5, or right-click on Indicators in the Navigator window (Ctrl+N) and select Refresh .
- Add Indicator to Chart: Drag the "Support Resistance Dynamic" indicator from the Navigator window onto your trading chart.
4. How to Use
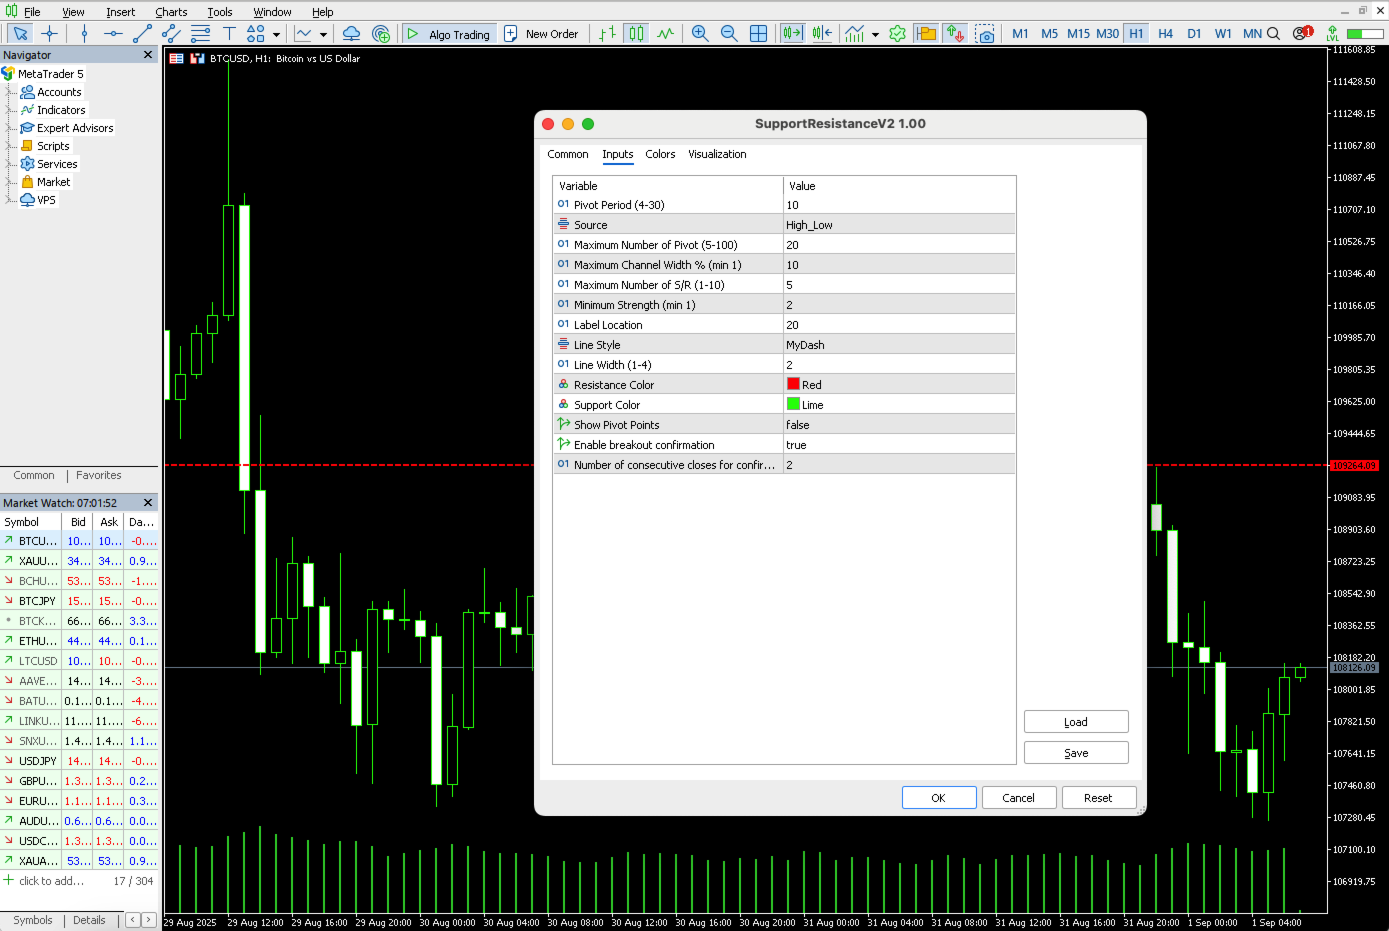
After adding the indicator to the chart, the settings window will appear. Below is a detailed explanation of the input parameters:
4.1. Input Parameters
- Setup:
- Pivot Period (prd) : The period for identifying Pivot High and Pivot Low points. A larger value results in fewer but stronger Pivots. (Default: 10, Range: 4-30).
- Source (ppsrc) : The data source for Pivot calculation.
- High/Low : Uses the highest (High) and lowest (Low) prices of the candle.
- Close/Open : Uses the closing (Close) and opening (Open) prices of the candle.
- Maximum Number of Pivot (maxnumpp) : The maximum number of Pivot points the indicator will store for S/R zone calculation. (Default: 20, Range: 5-100).
- Maximum Channel Width % (ChannelW) : The maximum width of an S/R zone, calculated as a percentage of the recent price range. Pivot points within this range will be grouped into a single S/R zone. (Default: 10, Minimum: 1).
- Maximum Number of S/R (maxnumsr) : The maximum number of strongest S/R zones to be displayed on the chart. (Default: 5, Range: 1-10).
- Minimum Strength (min_strength) : The minimum strength of an S/R zone to be displayed. Strength is determined by the number of Pivot points forming that zone. (Default: 2, Range: 1-10).
- Colors:
- Label Location (labelloc) : The position of the S/R price label relative to the current candle (positive numbers for future bars, negative for historical bars). (Default: 20).
- Line Style (line_style_input) : The line style for S/R levels (Solid, Dash, Dot).
- Line Width (linewidth) : The thickness of the S/R lines. (Default: 2, Range: 1-4).
- Resistance Color (resistancecolor) : The color for resistance lines (default: Red).
- Support Color (supportcolor) : The color for support lines (default: Lime Green).
- Show Point Points (showpp) : Toggle display of Pivot High/Low points on the chart.
- Breakout Confirmation Inputs:
- Enable breakout confirmation (confirm_breakout) : Enable/disable the breakout confirmation feature. When enabled, breakout alerts will only trigger when the confirmation condition is met. (Default: True).
- Number of consecutive closes for confirmation (confirmation_bars) : The number of consecutive candle closes above/below the S/R level required to confirm a breakout signal. (Default: 2).
- Dashboard Inputs:
- Show Dashboard (show_dashboard) : Toggle display of the S/R dashboard on the chart. (Default: True).
- Dashboard Corner (dashboard_corner) : The corner of the chart where the dashboard will be displayed.
- Dashboard Background Color (dashboard_bgcolor) : The background color of the dashboard.
- Dashboard Text Color (dashboard_textcolor) : The text color of the dashboard.
- Dashboard X Offset (dashboard_x_offset) : Horizontal offset from the chart corner to the dashboard.
- Dashboard Y Offset (dashboard_y_offset) : Vertical offset from the chart corner to the dashboard.
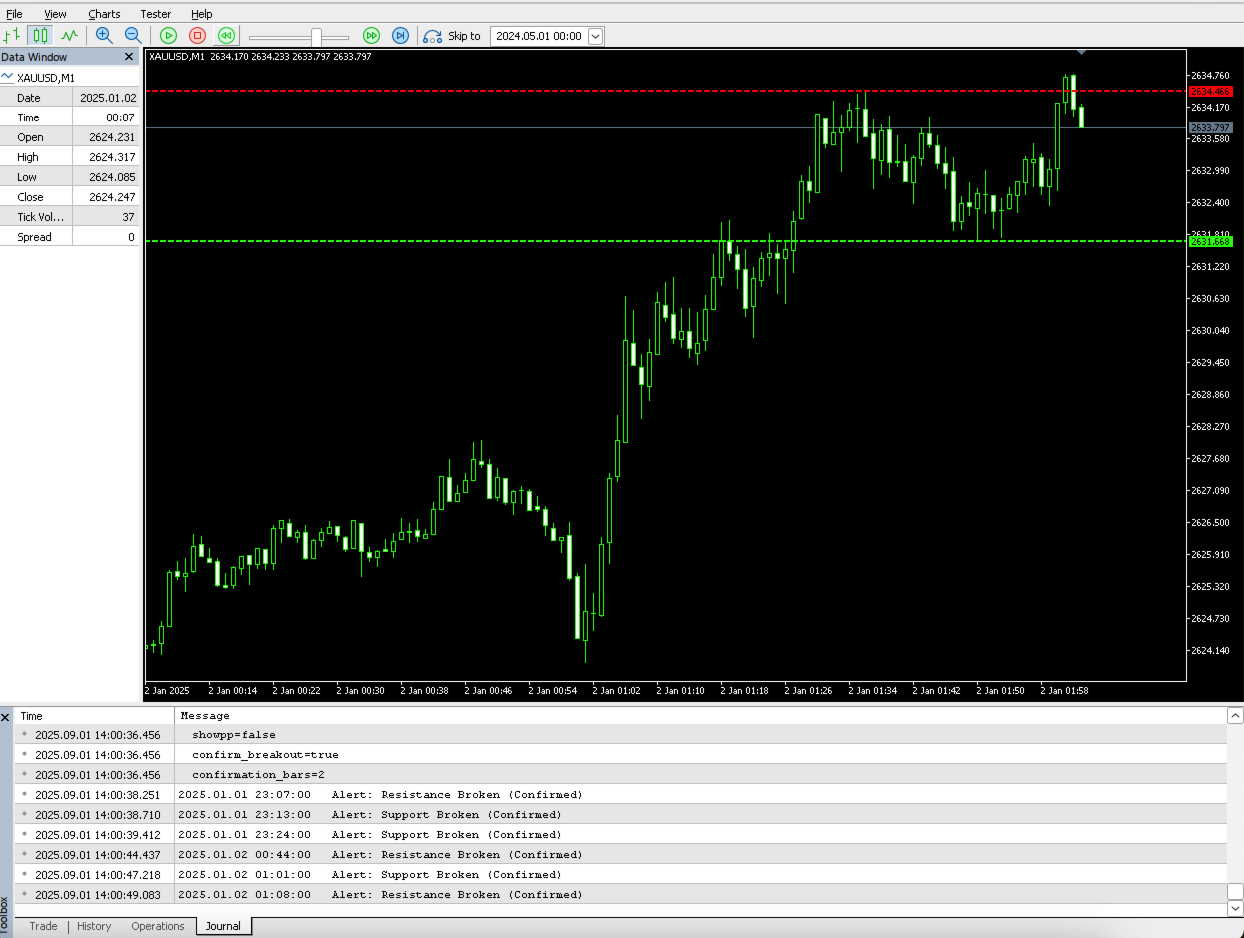
4.2. How to Read the Indicator on the Chart
- S/R Lines:
- Red horizontal lines represent Resistance levels, located above the current price.
- Green horizontal lines represent Support levels, located below the current price.
- Price Labels: Each S/R line has a label showing its price level and the percentage deviation from the current closing price.
- Pivot Points (if showpp is enabled): Small "H" (High) and "L" (Low) letters on the chart mark the Pivot points.
- S/R Dashboard (if show_dashboard is enabled):
- Displays a list of current S/R levels.
- R# : Resistance level.
- S# : Support level.
- Price : The price level of the S/R.
- (%): Percentage deviation from the current price.
- [Strength] : The number of Pivot points forming that S/R zone. Higher strength indicates a more reliable S/R zone.
4.3. Alerts
The indicator can send alerts when the price breaks support or resistance levels.
- Setting up Alerts: To receive alerts, you need to enable notifications in MetaTrader 5 (Tools -> Options -> Notifications).
- Alert Types:
- "Resistance Broken": Price breaks a resistance level.
- "Support Broken": Price breaks a support level.
- If confirm_breakout is enabled, the alert message will include "(Confirmed)" to indicate that the confirmation condition has been met.
5. Trading Application
The "Support Resistance - Dynamic" indicator can be applied in various trading strategies:
- Trend Identification: In an uptrend, price often respects support levels. In a downtrend, price often respects resistance levels. Breaking these levels can signal a trend change.
- Entry/Exit Points:
- Range Trading: Buy near support levels and sell near resistance levels when the price is moving within a defined range.
- Breakout Trading: Buy when the price breaks resistance upwards or sell when the price breaks support downwards. Use the confirm_breakout feature to filter out false breakout signals.
- Risk Management: Set Stop Loss orders appropriately. For example, place a Stop Loss just below a support level when buying, or just above a resistance level when selling.
- Combine with Other Tools: To increase signal reliability, it is recommended to combine this S/R indicator with other technical analysis tools such as Volume, oscillators (RSI, Stochastic), or candlestick patterns.
6. Important Notes
- No Indicator is Perfect: The "Support Resistance - Dynamic" indicator is a powerful support tool, but it does not guarantee profits. The market always carries risks.
- Test on Demo Account: Always recommended to test the indicator on a demo account to familiarize yourself with its operation and adjust parameters to suit your trading style before applying it to live trading.
- Market Conditions: The effectiveness of the indicator may vary depending on market conditions (trending or ranging).


Muito bom indicador, estou aprendendo usa-lo, obrigado.